Making the lab workhorse run faster
Posted: 2 February 2006 | | No comments yet
Quantitative real-time PCR, the workhorse of any genomics lab, is a well established technique that has numerous uses due to its simplicity and flexibility. In this article we will review a brief history of real time PCR, discuss our strategy for optimising a lab running Quantitative-RT-PCR and describe how this technique fits into the drug discovery process. We will conclude with some on-going issues regarding RT-PCR data generation and analysis.
Quantitative real-time PCR, the workhorse of any genomics lab, is a well established technique that has numerous uses due to its simplicity and flexibility. In this article we will review a brief history of real time PCR, discuss our strategy for optimising a lab running Quantitative-RT-PCR and describe how this technique fits into the drug discovery process. We will conclude with some on-going issues regarding RT-PCR data generation and analysis.
Quantitative real-time PCR, the workhorse of any genomics lab, is a well established technique that has numerous uses due to its simplicity and flexibility. In this article we will review a brief history of real time PCR, discuss our strategy for optimising a lab running Quantitative-RT-PCR and describe how this technique fits into the drug discovery process. We will conclude with some on-going issues regarding RT-PCR data generation and analysis.
The first documentation of real-time PCR was recorded by scientists at Cetus Corp, led by Russ Higuchi. (Higuchi, 1992, Gingeras, 2005) Commercial instruments for quantitative real time PCR were subsequently developed at Roche Molecular Systems and Applied Biosystems. The idea was conceived while the scientists were trying to visualise with ethidium bromide, post-PCR, precipitated PCR amplification product using biotinylated primers and streptavidin in the PCR reaction. Later they found that, contrary to expectations, ethidium bromide did not inhibit PCR such that the PCR products could be detected by using ethidium bromide in the reaction from the beginning. The fluorescence increased as the PCR continued. To monitor multiple PCRs simultaneously, a CCD camera was used to capture images of the tubes in the thermocycler at each cycle of the PCR reaction (Higuchi, 1993, 1997). The pixel values from the well positions were then summed to construct the cycle-by cycle, primitive ’growth curves‘. The fewer PCR cycles it took to detect an increase in fluorescence, the more copies of the target DNA sequence were in the original material.
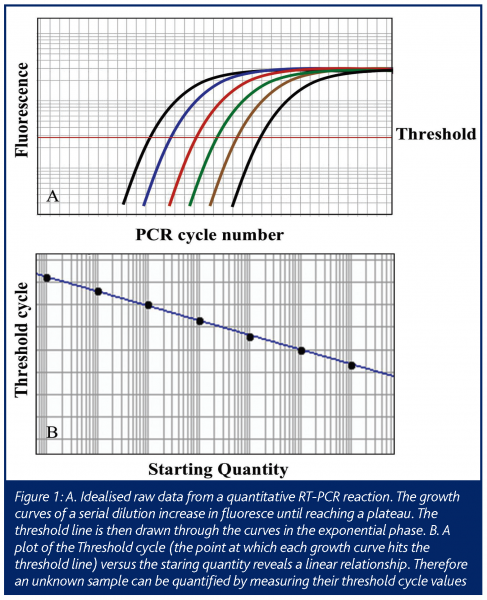
In this ‘real-time’ PCR, data is collected at each cycle of the reaction, as opposed to standard PCR that measures the final end product of a given number of cycles of PCR. This allows the amount of PCR product to be measured while the reaction is still in the exponential range of the reaction, allowing one to extrapolate back to determine the amount of starting material (Figure 1). This technology has advanced since its initial conception, such that in a relatively short time it has become a mainstream research tool (Ginzinger, 2002) using a variety of detection methods (Elvidge, 2005). The most common use is the determination of the expression level of mRNA from cells and tissues (Bustin 2000) and will be the focus of this article.
Process Biology
For a genomics-based drug discovery lab, high throughput data generation and global accessibility of data are critical for success. To make a technology such as quantitative RT-PCR work in the most efficient way, a new paradigm for the genomics age is needed. At Roche we have adopted an integrated approach called Process Biology (Reidhaar-Olson, 2002). The underlying philosophy of Process Biology addresses the implementation and optimisation of technologies with operations management and informatics integration as a fundamental element (Reidhaar-Olson, 2003).
A key to implementing Process Biology has been to adopt a modular organisation for the different technologies/services needed. At Roche, we have recognised that our therapeutic areas need two basic kinds of quantitative RT-PCR services for the discovery phase of research. We have developed two lab modules that use quantitative RT-PCR as their workhorse. Both modules share a Web-based interface for researchers to specify the gene or transcript they are interested in, submit their requests and, later, view the completed data. These modules are constantly being improved by evaluating and incorporating new lab technologies and interfaces for customers.
Two Process Biology modules
Our first high-throughput Process Biology module is STEP: Single Target Expression Profiling. Here a ‘target’ is a gene that may become (or may help find) a target for a drug discovery. There is often a need for a single gene’s expression level to be assessed on a variety of standard tissues quickly and accurately. cDNA from hundreds of tissues, cell lines and xenograft tumours can be prepared and allocated into 384 well plates. Those plates can be mass produced with the help of laboratory robotics and stored at minus 80°C. When a researcher finds a gene of interest and needs to determine its expression level in a large number of tissues, the gene can be profiled on a pre-made STEP plate filled with cDNAs of tissues or cell lines of interest. The turnaround time can be less than a day if primers/probes are available.
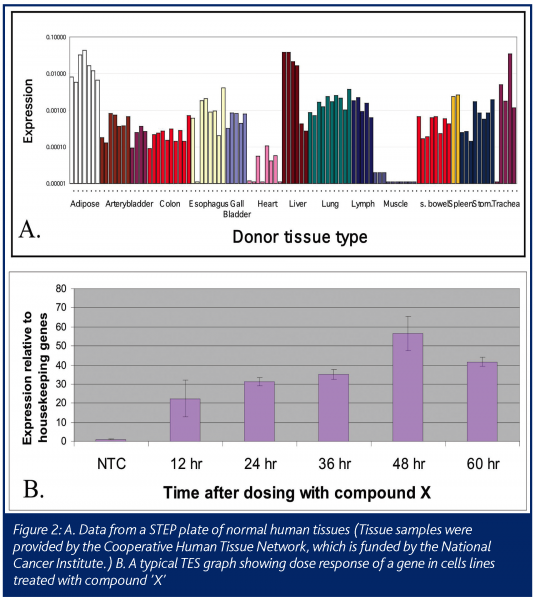
The resulting STEP data is a profile of the expression level of the gene in various tissues, such as matched diseased and normal samples for an indication of interest, or on a body map to show the average level expression of the gene in multiple organs in the body (Figure 2A). STEP data can also be a profile of the expression level of the gene in a hundred different cell lines or multiple xenograft tumors models. This data can help researchers quickly choose the best cell line model for their experiments. For example, in pre-clinical studies, if a cell line with a specific biochemical pathway intact is needed for an experiment, each gene in the pathway can be profiled on a STEP cell line plate to quickly find a cell line that expresses the key genes.
The second high-throughput Process Biology module is TES: Taq Expression Service. This module is needed to balance out the pre-selected tissue approach of STEP. Often there is a need for data on the expression of the gene of interest in a specific and unique set of tissues or cell cultures. For example, one may require data on how the expression of a gene changes with treatment of a drug (Figure 2B). The samples may be from cells treated in a time and dose course. In this case there will be two steps needed after the request is made. First is the extraction of RNA from the cells of interest and second is the PCR with primers/probes made to the gene of interest. This service will take more time than a STEP request, but can be refined with lab automation to have quick turn around times.
Quantitative RT-PCR in drug discovery
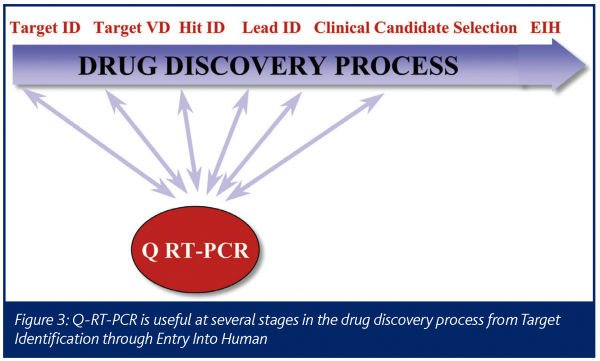
The drug discovery process begins with the identification of a potential drug target and, for successful programs, leads to a drug that can be dosed in human patients (Figure 3). Quantitative RT-PCR data can play a critical role in several points along that path.
The process often starts with Target Identification. This begins with a hypothesis about a gene that, if modulated, might help improve a disease state. The idea may come from the literature or a researcher’s own investigations of a relevant biochemical pathway. In this genomics era, hits from microarray experiments, such as genes up-regulated in a disease state, can also become drug targets. Validation of the initial hypothesis then becomes crucial and quantitative RT-PCR can play a significant role. A process such as STEP can quickly let a researcher know if the gene of interest is expressed in the relevant tissue and disease state and what the relative level of expression is in other tissues. This kind of data can quickly generate information that will be vital to help prioritise a large number of potential targets.
Once a potential drug target is chosen, the gene must be validated in a thorough and efficient manner (Target Validation). Quantitative RT-PCR often plays a critical role here as well. For example, the data can reveal the pattern of expression in other diseases and other relevant tissues. When primers and probes are designed to different transcripts, quantitative RT-PCR can show where the different splice variants of a gene are expressed. One important genomics target validation tool is the knockdown of a gene with siRNA, followed by a functional assay. Quantitative RT-PCR can be used to confirm that the gene has been knocked down in the transfected cells.
The next stage of the process involves identification of hits and then chemical leads. At this point, validation of the compound is needed. Quantitative RT-PCR can be used to determine if the compound is affecting relevant biochemical pathways, such as those related to the expected mechanism of action or to toxicological marker genes. Our TES module is often used at this stage to assess samples that have been dosed with a new compound to help understand the mechanism of action and/or off-target effects. Quantitative RT-PCR can also be used to validate potential biomarkers, such as genes that would be used to track dose response in patients.
Technology issues
Although the case can be made that quantitative RT-PCR is the gold standard (Elvidge, 2005), each expression technology has its own strengths and weaknesses. For quantitative RT-PCR there are still several issues that remain. Here we discuss two. The first is how to run the actual experiments. The second is how to normalise the data. Inevitably the choices made will impact the results.
One of the basic questions in quantitative RT-PCR is whether to run it as a ‘one-step’ or ‘two-step’ reaction. One-step is carried out in a single tube; with the reverse transcription from RNA to single stranded cDNA followed by the PCR reaction in the same tube without any manual intervention. For two-step, the reaction is stopped after the reverse transcription step and the DNA can be quantitated and stored for use in multiple further reactions (Baker 2004). For a process such as STEP, ‘two-step plus’ is the method of choice. Double stranded cDNA is created in the first step; this is both cleaned up and quantitated before the PCR step. Clean double stranded cDNA is needed if large quantities of template must be stored for years for thousands of experiments.
There is potentially no more contentious issue in genomics than how to normalise data. The goal is usually to determine how many copies of a gene have been expressed in a particular type of cell. Several issues make that easier said, than done. Ideally one would start with a cloned copy of the gene to create a standard curve, but this is often impractical for a high-throughput operation. Also, one needs an accurate count of both the number of cells and the different types of cells in a sample. However, obtaining an accurate count of how many cells’ mRNA has gone into the reaction is very difficult, in part because there is a much larger amount of ribosomal RNA in cells compared to messenger RNA and because cells can naturally, and in response to treatment, contain different levels of mRNA. Also, when working with tissue samples, one will get mixed cell populations, for example from blood vessel cells and blood cells in the tissue section. There are improvements in techniques such as laser capture micro-dissection, but getting a pure cell population from anything other than cell cultures is typically not practical. Therefore the resulting measure of the expression level of a gene needs to be normalised.
In general, researchers have chosen to use housekeeping genes for normalisation. An ideal housekeeping gene is one whose cellular expression is constant in all cells and across different types of treatment (e.g. vehicle vs. drug) or disease state (e.g. diabetic vs. normal). There are a number of favourite housekeeping genes such as GAPDH, Beta Actin or 18S Ribosomal RNA. Sometimes a panel of housekeeping genes will help and, in general, a thorough understanding of the individual experiments will help guide decision making. Different situations call for different solutions. The controversy will never be completely resolved, so each individual experiment needs to be examined and balanced for accuracy and speed. For our STEP process, a panel of nine housekeeping genes is run on our standard tissues periodically and then used to ’adjust‘ the expression of GADPH, which is run with each plate. For TES, GAPDH or a small panel of genes is used depending on the need.
Despite being a relatively new technology, quantitative real-time PCR has come a long way and has many uses in the drug discovery process. It will likely continue to be a key technology for genomics labs far into the future.


References
Bustin SA: Absolute quantification of mRNA using real-time reverse transcription polymerase chain reaction assays. Journal of Molecular Endocrinology 25(2), 169–193 (2000)
Bustin SA, Benes V, Nolan T, Pfaffl MW: Quantitative real-time RT-PCR–a perspective. J Mol Endocrinol. 34(3), 597-601 (2005)
Baker S, O’ Shaughnessy M, Noel S: RT-PCR in real time applications: one-step or two-step QRT-PCR? Insights Magazine, 4-5 (2005)
Elvidge G: Options for Quantitative analysis by real-time PCR. European Pharmaceutical Review 4, 37-43 (2005)
Gingeras TR, Higuchi R, Kricka LJ, et al: Fifty years of molecular (DNA/RNA) diagnostics. Clin. Chem. 51(3), 661-71(2005)
Ginzinger DG: Gene quantification using real-time quantitative PCR: an emerging technology hits the mainstream. Exp Hematol 30(6), 503-12(2002)
Higuchi R, Dollinger G, Walsh PS, Griffith R: Simultaneous amplification and detection of specific DNA sequences. Biotechnology 10(4), 413-7(1992)
Higuchi R, Fockler C, Dollinger G, Watson R: Kinetic PCR analysis: real-time monitoring of DNA amplification reactions. Biotechnology11(9),1026-30(1993)
Higuchi R, Watson RM: Kinetic PCR analysis using a CCD-camera and without using oligoncleotide probes. In: Innis MA, Gelfand DH, Sninsky JJ, eds. PCR methods manual. San Deigo, CA. Academic Press, 263-84 (1997)
Reidhaar-Olson J, Michael Braxenthaler, Hammer: J: Process-Biology:integrated genomics and bioinformatics tools for improved target assessment. Targets 1(6), 189-195 (2002)
Reidhaar-Olson JF, Ohkawa H, Babiss LE, Hammer: J. Process-Biology: Managing Information Flow for Improved Decision Making in Preclinical R&D. Preclinica 1(4), 161-169 (2003)


