Authentication of medicines using Raman spectroscopy
Posted: 16 February 2011 |
Raman spectroscopy offers a rapid and non-destructive technique for the identification of counterfeit medicines. Handheld Raman instruments offer the advantages of carrying the laboratory to the sample and giving a rapid pass or fail answer for the medicine inspected. It can identify a medicine regardless of its physical form as a tablet, powder, ointment, cream or liquid. However, the technique is limited as not all species of a medicine have a Raman scattering. Thus, the Raman spectrum obtained upon measuring a medicine might be due to the active pharmaceutical ingredient or any other excipient in the bulk or the coating of the formulation.
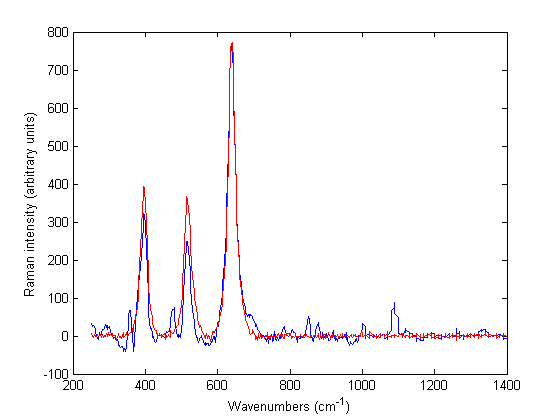
Figure 1 Baseline treated Raman spectra of Zirtek 10 milligram tablet (blue) and titanium dioxide (red) measured using the Ahura Truscan instrument
Raman spectroscopy offers a rapid and non-destructive technique for the identification of counterfeit medicines. Handheld Raman instruments offer the advantages of carrying the laboratory to the sample and giving a rapid pass or fail answer for the medicine inspected. It can identify a medicine regardless of its physical form as a tablet, powder, ointment, cream or liquid. However, the technique is limited as not all species of a medicine have a Raman scattering. Thus, the Raman spectrum obtained upon measuring a medicine might be due to the active pharmaceutical ingredient or any other excipient in the bulk or the coating of the formulation.
In addition, the Raman spectra of some species might not be detected in the reflection mode. In this respect, the use of laboratory based instruments in transmission mode can be used for the measurement of these medicines. Thus, both handheld and laboratory based instruments are complementary for the authentication of medicine detection. An initial scan could be carried out using the handheld instrument and the suspected counterfeit medicines could be taken to the laboratory and further analysed using laboratory based instruments.
Medicine counterfeiting is a global expanding problem affecting all countries in the world and accounts for an estimated 10 per cent of the world market1. It can occur in any class of drugs. However, it mostly occurs in lifestyle medication in developed countries and in life saving medication in developing countries. A counterfeit product might have a problem in its active pharmaceutical ingredient (API) or excipients1. Thus, it might range from containing an insufficient active ingredient to no active ingredient or even a toxic product. The supply channels of counterfeit products are mostly the street market or the internet. However, they can also be found in pharmacies and hospitals. In this respect, rapid and non-destructive methods are needed to identify these medicines. Near-infrared spectroscopy (NIRS) has been used for this purpose2,3, but Raman spectroscopy is rapidly gaining acceptance4-15.
Raman spectroscopy
Raman spectroscopy is a widely used technique in pharmaceutical analysis16,17 and offers a rapid and non-destructive technique for the identification of counterfeit medicines. Raman spectroscopy is a light scattering technique that is based upon the collision between the photons and the sample when the sample is irradiated with monochromatic light. Most of these photons do not change energy after collision. In this case, the collision is elastic collision and the scattering is known as Rayleigh scattering. A small proportion of photons exchange energy with the sample. This is known as inelastic collision and the scattering is known as Raman scattering. The Raman scattering has two types – Stoke Raman scattering (when the photon gives energy to the sample) and Anti-Stoke Raman scattering (when the photon takes energy from the sample). The Raman signal might be due to certain species in the sample and not due to the whole sample (as compared to the case of NIRS where reflection or transmission occurs from the sample as a whole). Thus, not all species have Raman scattering. The scattering intensity is measured and is proportional to the concentration of the interacting species. So, for a medicine to be analysed by Raman spectroscopy, the API in the medicine ideally has to have a strong Raman signal. In this respect, qualitative analysis would be made by identifying specific spectral bands corresponding to the API. Univariate and multivariate methods may be applied. In addition, for quantitative analysis, univariate and multivariate regression methods might be applied to the peak area or peak height of these bands. So, the advantages of Raman spectroscopy over NIRS is that it is specific to the species analysed, not affected by humidity and the Raman signal is proportional to the concentration of the scattering species. In addition, water has a weak Raman signal, so it is possible to get a spectrum from an aqueous solution. Raman spectroscopy does not distinguish between the various forms of the sample (solid, liquid or gel) or physical properties in solid dosage forms (powder or tablet). As with NIRS, both handheld and laboratory based Raman instruments can be used for both field and off-line analysis of medicines.
The objective of the work reviewed here was to demonstrate the use of both laboratory based and handheld Raman spectroscopic instruments for the authentication of medicines. The laboratory based method was used for offline analysis while the handheld instrument was used for both field and off-line analysis.
Measurement of samples
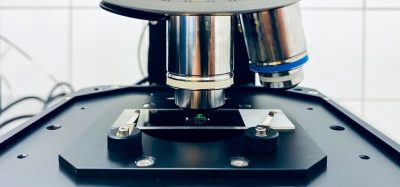
Tablet, powder and liquid samples were measured as received using two instruments to a handheld Ahura Truscan portable spectrometer and a Kaiser Raman Workstation instrument. The Truscan portable spectrometer (Ahura Scientific, Inc., Wilmington, MA) had a 785 nanometre laser excitation wavelength, an output of 300 mW and a 2048 element silicon charge coupled device (CCD) detector. The instrument was equipped with a vial holder for the measurement of liquids and a universal tablet holder. It worked in reflection mode. The Raman spectral range was 250 – 2875 cm-1.
The Kaiser Raman Workstation (Kaiser Optical, Ann Arbor, MI, USA) had a 785 nanometre laser excitation wavelength, a CCD detector and holographic grating. The instrument incorporated Kaiser’s Phat technology which removed sample irreproducibility, increased sensitivity and reduced the laser power decreasing sample damage by measuring a large area of the sample. It worked in both reflection and transmission modes. The Raman spectral range was 142 – 1898.4 cm-1. Using the Ahura Truscan instrument, built-in and off-line identification was carried out whereas only off-line identification was performed using the Kaiser Raman Workstation. Spectra of single tablets were used in this study. For off-line analysis, the spectra of the samples obtained from both instruments were exported to Matlab R2007a where baseline correction was made before a comparison of products was made. However, the high quality spectra made from multiple scans from the Ahura Truscan could not be exported.
Built-in and off-line identification of tablets The Ahura Truscan with a built-in identification algorithm had the advantages of carrying the laboratory to the sample and giving an instant pass or fail answer. Thus, a high quality spectrum for the reference product was taken and stored as a signature in the instrument library. Then a method was created from one or more signatures in the library. When a test product was run against this method, the result was displayed on the screen indicating whether the product passed or failed i.e. the test spectrum matches the signature or not. A probability value (pval) was provided indicating how closely the test spectrum was to the signatures in the reference method. The product passed if its pval was higher than 0.05. If the product failed, the built-in software matched it against other signatures in the library and the closest matches were displayed on the screen along with the spectra of the reference signature and the test product. However, although the built-in identification gave correct results for some products, it misidentified other products. An example of a products that passed was a Ciproxin 500 milligram tablet of one batch which gave a pval of 0.6 against a Ciproxin 500 milligram tablet signature of a closely related batch. An example of a tablet that was misidentified was a Zirtek 10 milligram tablet that was misidentified as titanium dioxide.
Off-line analysis of the spectra using the Ahura Truscan did not give better results than the built-in algorithm. Thus, the Zirtek 10 milligram tablet spectra matched the spectrum of titanium dioxide, which showed that the Raman scattering of the tablet was due to the titanium dioxide in the film coating and not due to cetirizine dihydrochloride which was the API of interest in the core of the tablet (Figure 1). However, this problem was not encountered when Zirtek tablets and other tablets containing cetirizine dihydrochloride were measured using the Kaiser Raman Workstation (Figure 2). So the Raman signal of a medicine was very variable between the two instruments due to a variation in the sample volume of the instruments.
Figure 1 Baseline treated Raman spectra of Zirtek 10 milligram tablet (blue) and titanium dioxide (red) measured using the Ahura Truscan instrument

Figure 2 Baseline treated Raman spectra of cetirizine dihydrochloride containing tablets including: (a) Zirtek 10 milligram manufactured by UCB Pharma Ltd., (b) Cetirizine 10 milligram tablet manufactured by OTC Concept Ltd., (c) Pireteze 10 milligram tablet manufactured by GSK, (d) Pollenshield 10 milligram tablet manufactured Actavis, (e) Benadryl 10 milligram tablet manufactured Pfizer, (f) Cetirizine 10 milligram tablet manufactured Galpharm and (g) Cetirizine 10 milligram tablet manufactured Galpharm measured using the Kaiser Raman Workstation instrument in reflection mode.
In both cases, there was no difference between the physical forms of the tablets. Thus, unlike with NIRS, the spectra of intact and powdered tablets were similar. Using the Ahura Truscan, the spectra had similiar peak positions and intensities but the intensities of the intact and powdered tablets were variable using the Kaiser instrument. Figure 3 shows the baseline treated Raman spectra of a single Ciproxin 500 milligram tablet in its intact and powdered forms when measured by the Kaiser Raman Workstation instrument. It was clear that the Raman scattering in the powdered tablet had higher intensity than with the intact tablet.

Figure 3 Baseline treated Raman spectra of Ciproxin 500 milligram tablet batch number BXB19T1 in its (a) intact and (b) powdered forms measured using the Kaiser Raman Workstation instrument
In addition to the intact and powdered forms, spectra could be obtained from other physical forms of a medicine such as pellets and liquids. Liquids can be measured provided they do not have a low concentration of API. However, not all liquid pharmaceutical products measured yielded a Raman spectrum. Thus, out of 10 liquids measured using the Ahura Truscan instrument, a spectrum could be collected from three of them only, cetirizine 1 mg/ml solution, ciprofloxacin 250 mg/5ml suspension and gentamicin 40 mg/ml suspension. The remaining spectra of liquids consisted only of noise and were Arzep 0.1 per cent w/v solution, ciprofloxacin 400mg/200ml infusion, Cosopt eyedrops, Synvisc 2 mg/ml and 8 mg/ml solution and Ipravent 250 mcg solution. Figure 4 shows the Raman spectrum of ciprofloxacin 250mg/5ml infusion. The spectrum looks very similar to the powdered and intact Ciproxin tablets which confirmed that ciprofloxacin hydrochloride is Raman active.

Figure 4 Baseline treated Raman spectra of ciprofloxacin 250 milligram / five millilitre infusion measured using the Ahura Truscan instrument
Identification of medicines of different APIs
For identification of different medicines using Raman spectroscopy, a total of 163 products containing 30 different APIs were measured using the Ahura Truscan instrument. The baseline treated Raman spectra of these medicines were compared regardless of the type of scattering obtained. In this respect, the correlation in wavelength space (CWS) method was applied to the medicines’ spectra and the r values were compared and visualised as a correlation map. Figure 5 shows the correlation map of these 163 medicines which included the following APIs to aripiprazole (1 to 5), artesunate (6 to 8), atorvastatin calcium trihydrate (9 to 21), carbamazepine (22 to 23), cetirizine dihydrochloride (24 to 30), ciprofloxacin hydrochloride (31 to 57), clopidogrel hydrogen sulfate (58 to 60), doxazosin mesylate (61 to 65), erythromycin (66 to 77), esomeprazole magnesium trihydrate (78 to 80), ezetimibe (81 to 82), finasteride (83 to 88), fluvastatin (89 to 91), isosorbide dinitrate (92 to 93), lamivudine/ zidovudine (94 to 95), letrozole INN (96 to 98), lisinopril (99 to 100), loratidine (101 to 104), losartan potassium/ hydrochlorothiazide (105 to 110), montelukast sodium (111 to 112), ofloxacin (113 to 114), propranolol hydrochloride (115 to 119), quinine (120 to 131), raloxifene hydrochloride (132 to 133), risedronate sodium (134 to 139), sildenafil citrate (140 to 142), simvastatin (143 to 144), tadalafil (145 to 146), valsartan (147 to 154) and valsartan/ hydrochlorothiazide. A dark blue colour in the map means that the r value is below 0, a green colour means that the r value is 0 – 0.2, a yellow colour means that the r value is 0.2 – 0.4, an orange colour means that the r value is 0.4 – 0.6, a light red colour means that the r value is 0.6 – 0.8 and a dark red colour means that the r value is from 0.8 – 1. So the darkest colour indicates the most similar medicines and shows that the medicines have the same matrix of API and excipients. In this respect, a dark red colour was expected to obtain between each equivalent set. However, this was only obtained in the medicines containing ciprofloxacin. This was because the ciprofloxacin spectra were less noisy and had good Raman scattering. This leads to a conclusion that in the case of discrimination of a counterfeit medicine from an authentic medicine, it is necessary for the authentic medicine to have a good Raman scattering which is not possible for all medicines.

Figure 5 Correlation map of the baseline treated Raman spectra of 163 medicines containing 30 APIs measured using the Ahura Truscan instrument
Identification of counterfeit medicines
To validate this, authentic and counterfeit Plavix 75 milligram tablets were measured using both Raman instruments. No signal could be obtained using the Ahura Truscan instrument and the Kaiser Raman Workstation in the reflection mode (Figure 6a). However, when the transmission mode was applied using the latter instrument, the authentic and counterfeit Plavix 75 milligram tablets spectra could be easily differentiated (Figure 6b). The r value among these two spectra, which was 0.8547, confirmed this result.

Figure 6 Baseline treated Raman spectra of authentic Plavix 75 milligram tablet batch number BK385 (blue) and counterfeit Plavix 75 mg tablet batch number 1753 (red) measured using the Kaiser Raman Workstation in both (a) reflection and (b) transmission modes
Conclusion
Raman spectroscopy is a rapid, sensitive and non-destructive technique for identification of counterfeit medicines. It can identify the medicine regardless of its physical form (powder, tablet, suspension or liquid). However, not all medicines have a good Raman scattering. Also, there is variation between the Raman signal using handheld and laboratory based instruments. Using laboratory based instruments, transmission mode gives better scattering than reflection mode. Therefore, it is better to use the handheld instrument for initial screening of the tablets; then further analysis could be made on suspect tablets using a laboratory based instrument.
References
1. WHO Report on Counterfeit Medicines, http to //www.who.int/medicines/services/counterfeit/overvie w/en/ (accessed on 08-01-2011)
2. A. C. Moffat , S. Assi and R. A. Watt, 2010. Identifying Counterfeit medicines using near-infrared spectroscopy. Journal of Near-infrared spectroscopy, 18, pp. 1-15
3. T. Moffat, R. Watt and S. Assi, 2010. The use of near infrared spectroscopy to detect counterfeit medicines. Spectroscopy Europe, 22 to 5, pp. 6-10
4. D. E. Bugay and R. C. Brush, 2010. Chemical identity testing by remote-based dispersive Raman spectroscopy. Applied Spectroscopy, 64 to 5, pp. 465-475
5. S. Assi, R. A. Watt and A. C. Moffat. Identification of tablets using handheld near-infrared and Raman spectroscopic instruments. IUPAC 2009, Glasgow, UK (2009)
6. P. de Peinder, M.J. Vredenbregt and T. Visser, D. de Kaste,2010. Detection of Lipitor® counterfeits: A comparison of NIR and Raman spectroscopy in combination with chemometrics, Journal of Pharmaceutical and Biomedical Analysis, 47, pp. 688-694
7. M. de Veij, A. Deneckere, P. Vandenabeele, Dr. de Kaste, L. Moens, 2010. Detection of counterfeit Viagra® with Raman spectroscopy, Journal of Pharmaceutical and Biomedical Analysis, 46, pp. 303-309
8. C. Ricci, L. Nyadong, F. Yang, F. M. Fernandez, C. D. Brown, P. N. Newton and S. G. Kazarian,2008. Assessment of hand-held Raman instrumentation for in situ screening for potentially counterfeit artesunate antimalarial tablets by FT-Raman spectroscopy and direct ionization mass spectrometry, Analytical Chimica Acta,623, pp. 178-186
9. Y. Roggo, K. Degardin and P. Margot, 2010. Identification of pharmaceutical tablets by Raman spectroscopy and chemometrics, Talanta. 191, pp. 988-995
10. B. J. Venhuis, M. V. Vredenbregt, N. Kaun, J.K. Maurin, Z. Fijałek and D. de Kaste,2011. The identification of rimonabant polymorphs, sibutramine and analogues of both in counterfeit Acomplia bought on the Internet, Journal of Pharmaceutical and Biomedical Analysis, 5, pp. 21-26
11. P.Y. Sacré, E. Deconinck, T. De Beer, P. Courselle, R. Vancauwenberghe, P. Chiap, J. Crommen and J.O. De Beer,2010. Comparison and combination of spectroscopic techniques for the detection of counterfeit medicines, Journal of Pharmaceutical and Biomedical Analysis, 53, pp. 445-453
12. R. Bate and K. Hess, 2010. Anti-malarial drug quality in Lagos and Accra – a comparison of various quality assessments, Journal of Malaria, 9, pp. 157
13. S. Trefi, C. Routaboul, S. Hamieh, V. Gilard, M. Malet- Martino and R. Martino, 2008. Analysis of illegally manufactured formulations of tadalafil (Cialis) by 1H NMR, 2D DOSY 1H NMR and Raman spectroscopy, Journal of Pharmaceutical and Biomedical Analysis, 12, pp. 103-113
14. C. Ricci, C. Eliasson, N. A. Macleod, P. N. Newton, P. Matousek and S.G. Kazarian,2007. Characterization of genuine and fake artesunate anti-malarial tablets using Fourier transform infrared imaging and spatially offset Raman spectroscopy through blister packs,Analytical and Biomedical Chemistry, 389, pp. 1525-1532
15. C. Eliasson and P. Matousek, 2007. Noninvasive authentication of pharmaceutical products through packaging using spatially offset Raman spectroscopy, Analytical Chemistry, 79, pp. 1696-1701
16. D. E. Bugay and P. A. Martoglio Smith, Raman Spectroscopy in A. C. Moffat, M. D. Osselton and B. Widdop (Eds.), Clarke’s Analysis of Drugs and Poisons, 3rd edition, Pharmaceutical Press, London (2004) pp. 358-367
17. Y. Ozaki and S. Sasic, Introduction to Raman Spectroscopy in S. Sasic (Ed.), Pharmaceutical Applications of Raman Spectroscopy, John Wiley and Sons Inc., Hoboken, New Jersey (2008), pp. 1-29
About the Authors
Sulaf Assi is a postdoctoral research fellow at the School of Pharmacy, University of Hertfordshire. She obtained her Bachelor and Masters Degree in Pharmacy from Beirut Arab University in Beirut, Lebanon. She pursued her PhD in Pharmaceutical Analysis from the School of Pharmacy, University of London. Her research interest is in looking at the quality of medicines including counterfeit medicines.
Dr Robert Watt has worked at The School of Pharmacy recently researching within the Centre of Excellence for Near Infrared Spectroscopy developing NIRS techniques for the rapid characterisation of pharmaceutical products and herbal medicines to ensure the quality and authenticity of such materials. In particular, the development of chemometric methods to optimise the identification and quantification of counterfeit medicines is of current interest.
Professor Tony Moffat is Emeritus Professor of Pharmaceutical Analysis at The School of Pharmacy, University of London. After graduating in Pharmacy at Chelsea College, University of London, he obtained his PhD and DSc degrees from the same University. After 24 years in the Forensic Science Service, he joined the Royal Pharmaceutical Society as its Chief Scientist and The School of Pharmacy as Head of the Centre for Pharmaceutical Analysis. His main interests are in the quality of medicines, particularly the identification of counterfeit medicines by near-infrared and Raman spectroscopy.