A sensitive and selective vibrational spectroscopy technique in life sciences
Posted: 12 December 2009 | Dr Cees Gooijer, Professor of Biomolecular Analysis and Spectroscopy, Laser Centre, Vrije Universiteit, Amsterdam and Dr Freek Ariese, Associate Professor of Biomolecular Analysis and Spectroscopy, Laser Centre, Vrije Universiteit, Amsterdam | No comments yet
At present, the relevance of Raman Spectroscopy (RS) as an analytical tool in pharmaceutical sciences is increasingly obvious. RS is a mode of vibrational spectroscopy based on inelastic scattering of laser light and, like infrared spectroscopy (IR), provides detailed molecular structure information (see Figure 1A). However, contrary to IR, it is applicable to aqueous samples and furthermore sample handling is minimal. It can thus provide information on compounds in their “natural” environment. To illustrate its applicability, RS can be used to study materials in situ, such as pharmaceutical tablets inside polymer containers1. It is also applied as a process analyser or a process analytical tool2. Because of its fast and non-invasive character, it is also very suitable for the fast identification of illicit or counterfeit drugs3,4.
At present, the relevance of Raman Spectroscopy (RS) as an analytical tool in pharmaceutical sciences is increasingly obvious. RS is a mode of vibrational spectroscopy based on inelastic scattering of laser light and, like infrared spectroscopy (IR), provides detailed molecular structure information (see Figure 1A). However, contrary to IR, it is applicable to aqueous samples and furthermore sample handling is minimal. It can thus provide information on compounds in their "natural" environment. To illustrate its applicability, RS can be used to study materials in situ, such as pharmaceutical tablets inside polymer containers1. It is also applied as a process analyser or a process analytical tool2. Because of its fast and non-invasive character, it is also very suitable for the fast identification of illicit or counterfeit drugs3,4.
At present, the relevance of Raman Spectroscopy (RS) as an analytical tool in pharmaceutical sciences is increasingly obvious. RS is a mode of vibrational spectroscopy based on inelastic scattering of laser light and, like infrared spectroscopy (IR), provides detailed molecular structure information (see Figure 1A). However, contrary to IR, it is applicable to aqueous samples and furthermore sample handling is minimal. It can thus provide information on compounds in their “natural” environment. To illustrate its applicability, RS can be used to study materials in situ, such as pharmaceutical tablets inside polymer containers1. It is also applied as a process analyser or a process analytical tool2. Because of its fast and non-invasive character, it is also very suitable for the fast identification of illicit or counterfeit drugs3,4.
Nevertheless, RS is not yet involved routinely in all fields where it has a distinct potential. First of all because of its limited sensitivity it is mainly used for bulk constituents: inelastic scattering is a very improbable process (typically one out of 107 photons of excitation light will be scattered inelastically), so that the Raman signals are relatively weak. Their intensities depend on the laser wavelength applied (proportional with 1/λ4), but upon shortening λ, fluorescence background (from the analyte itself, from other compounds in the sample or from impurities) tends to become much stronger as well. Fluorescence often overwhelms the Raman spectrum, even if those impurities are present at much lower concentrations. This explains why in pharmaceutical practice mostly Raman spectrometers are used that are based on either red or near-infrared lasers. A second drawback of RS – usually not mentioned in the literature – is its lack of selectivity. Practically all sample constituents possess molecular vibrations that are Raman active (i.e. cause a change in polarisability), and these will all show up in the spectrum. Obviously this is a serious drawback in the case of low analyte concentrations or when studying complex matrices such as large biopolymer systems.
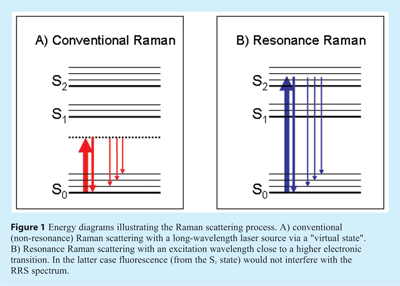

In principle, the abovementioned problems of sensitivity and selectivity can be largely overcome by applying Resonance Raman Spectroscopy (RRS). Raman signals are strongly intensified if the laser wavelength is close to an electronic absorption band (resonance), as illustrated in Figure 1B. In RRS not all vibrations are intensified, but only those that are coupled to the chromophoric group concerned, implying selectivity. Although the resonance effect in RS was already reported more than half a century ago, its use as an analytical tool is only of recent years5. Three main obstacles to its broader acceptance can be identified. First of all, for optimum use of RRS one should be able to select the appropriate excitation wavelength, but most laser systems still suffer from a lack of tunability. Secondly, in RRS the fluorescence background is expected to be an even more serious problem than in ‘normal’ RS; fluorescence is likely to occur if the laser light is absorbed by the analyte or by the chromophoric group in a (bio)polymeric system, which is of course always the case in RRS. Thirdly, analyte photodecomposition may be enhanced under resonant excitation conditions, especially in the case of stationary samples or dry materials with little heat dissipation. Despite these difficulties, important applications of RRS in the life sciences have been demonstrated, as will be illustrated below. The main reason is that in many situations the fluorescence background problem is not as serious as expected. Furthermore, novel instrumental approaches will be discussed that provide a substantial fluorescence background suppression, a reduced risk of photodecomposition and flexibility of excitation wavelength.

Nucleic acids
DNA and RNA have already been studied by RS since the late 1960’s6. Fortunately, resonance excitation is possible in the deep UV, directed at the bases adenine (A), cytosine (C), guanine (G) and thymine (T) or uracil (U). Somewhat surprisingly, fluorescence background is not an obstacle when excitation is performed in the ultraviolet region below about 260 nm. As shown by Asher, under such conditions both matrix and analyte fluorescence hardly play a role7. Simply stated, the reason is that small chromophores (e.g., isolated double bonds) usually have negligible fluorescence quantum yields, whereas larger chromophores (e.g., aromatic ring structures) tend to fluoresce at longer wavelengths and do not interfere with the deep-UV Raman spectrum.
As regards analytical applications, the interaction of nucleotides with various ions, as well as the effect of hydrogen bonding on RRS spectra have been investigated extensively. For this purpose, Takeuchi and coworkers have recorded UV RRS difference spectra of deuterium-labeled and unlabeled purines. The information was successfully used to study complex formation between the antibiotic actinomycin D and a DNA fragment8.
RRS can also be used to study the interaction of DNA with small molecules, such as carcinogens or dyes. DNA-binding compounds have potential value as gene-directed therapeutic agents. In fact, rational drug design requires insight not only into the binding characteristics, but also into the structural changes of genomic DNA caused by the interactions. RRS does not provide explicit information on the DNA backbone conformation, but it can be either directed at the DNA bases or at the drug itself, provided that it has appropriate chromophoric properties. Examples of compounds that were successfully studied include adriamycin, distamycin and hypericin9-11.
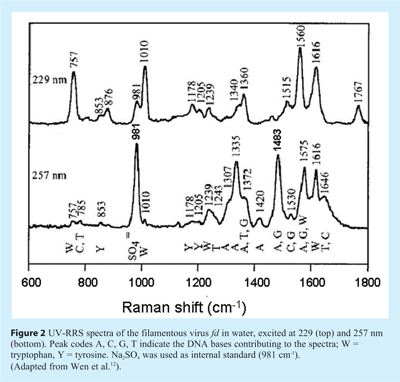
When applying UV-RRS to study nucleic acid – protein interactions it should be realised that wavelength selection is often crucial. In fact, the frequently used 266 nm line provided by the fourth harmonic of the Nd:YAG laser is very suitable and the same holds for the continuous-wave (CW) output of the frequency-doubled argon ion laser at 257 nm. However, at shorter wavelengths – for instance the 229 nm line that can also be obtained from the same Ar+ ion laser – the aromatic amino acid residues of the protein become much more pronounced in the spectra (UV-RRS of proteins will be discussed in the next Section). This is illustrated in Figure 2, where the UV-RRS spectra of a virus are shown. Whereas at 257 nm the spectrum is dominated by viral DNA, excitation at 229 nm primarily reveals the tryptophan and tyrosine residues12.
It should be noted that for studying viruses, UV-RRS has an inherent advantage compared to conventional RS. In the latter mode the Raman markers of the single-stranded DNA genome are very weak, since its contribution to the total virion mass is small, and furthermore the marker bands overlap greatly with the capsid protein bands. In this case resonance excitation at 257 nm is of great help. Since the DNA bands are selectively enhanced, these spectra provide much information about the base environments and their interaction with the viral capsid13.
Finally, it should be mentioned that the detection and identification of nucleotides by UV-RRS has been successfully coupled to liquid separation methods, as discussed in our previous paper in this journal14.

Proteins
Also in the case of proteins, deep-UV is the wavelength region of choice for RRS. Information can be obtained not only on the aromatic amino acids phenylalanine (Phe), tyrosine (Tyr) and tryptophan (Trp), but also on the peptide bonds via the amide frequencies. UV-RRS of proteins has been applied extensively in fundamental life sciences, especially for conformation studies.
The aromatic amino acids Phe, Tyr and Trp all absorb strongly in the 195-230 nm region. Their vibrational modes are well understood, in large part owing to the normal mode calculations on model compounds. The tyrosine modes are sensitive to hydrogen bonding of the phenolic OH group. At 218 nm excitation the enhancement pattern in the tyrosine UV-RRS spectrum is similar to that observed for phenylalanine; however by exciting at longer wavelengths (230-240 nm), a strong selectivity for tyrosine is observed. In view of the structure of Phe – being unable to form hydrogen bonds – its Raman band frequencies are not influenced by the protein environment or solvent. Also the presence of tyrosinate can be readily established; excitation in the 245-255 nm range has been shown to give high selectivity.
In UV-RRS the sensitivity of some vibrational bands of Tyr and Trp to the microenvironment can be used to study drug-protein interactions, although few applications have been reported so far. Hashimoto et al. studied the binding of warfarin, ibuprofen and palmitate to human serum albumin15. They showed that warfarin interacts directly with Trp at position 214, whereas ibuprofen interacts with the phenolic hydroxyl of Tyr at position 411.
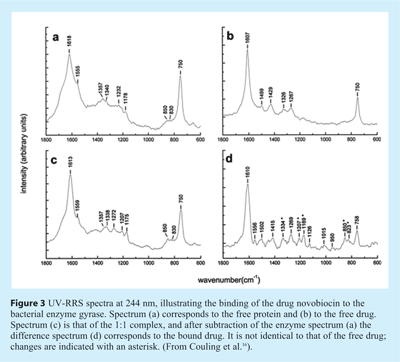
Couling et al. focused on drug binding to dihydroxyfolate reductase (DHFR), gyrase and catechol O-methyltransferase (COMT)16. An illustration of their results is reproduced in Figure 3, showing the 244 nm RRS spectra of the gyrase/novobiocin system. Gyrase is a bacterial enzyme that catalyses the introduction of negative supercoils into closed circular DNA. DNA gyrase is the target of two groups of antibacterial agents, the quinolines and the coumarins, such as novobiocin, the drug considered here. It is expected that novobiocin (which has a highly flexible molecular frame) is forced into a conformation when it binds to the protein, a change that should be reflected in its vibrational spectrum. It should be noted that novobiocin is resonantly enhanced at 244 nm as well (see Figure 3B). Therefore, in order to distinguish between the spectral changes of the enzyme and those of the drug, spectra have to be subtracted as shown in Figure 3D. Upon binding, both in the gyrase and the novobiocin spectra, substantial changes are observed. A detailed analysis of the spectra can be found in Couling et al.16.
As regards the potential of UV-RRS in protein-drug interactions, it should be emphasised that the spectra were recorded at around the 1 mg/ml level, low enough to avoid protein aggregation. The technique should be considered complementary to fluorescence spectroscopy, which is usually dominated by Trp fluorescence, whereas UV-RRS also provides information about Tyr residues.
Metalloproteins
Metalloproteins usually contain one or more coordination complexes of transition metal ions and protein ligands (such as porphyrins), forming biologically active sites. Many of these complexes show strong electronic absorption bands in the near-UV or visible range, so that in principle site-selective excitation can be performed without interferences from the remainder of the protein (300 nm is the longest absorption wavelength of amino acid residues, i.e., Trp).
This approach is very suitable for metalloporphyrins, such as heme proteins. Two bands in the electronic absorption spectrum are available, i.e. the Q-band located at about 550 nm (molar absorptivity ε of the order of 10 000 M-1cm-1) and the very strong Soret band at about 400 nm (ε being 100 000 M-1cm-1 or more). In the latter band the RRS spectrum is dominated by the totally symmetric modes of the porphyrin ring, whereas excitation in the Q-band merely enhances the non-totally symmetric modes. As a consequence, by combining these results a complete assignment of the porphyrin vibrational modes can be given. Even though the highest-frequency porphyrin ring modes do not directly involve the metal ion, they nevertheless provide detailed information about the ligation chemistry.
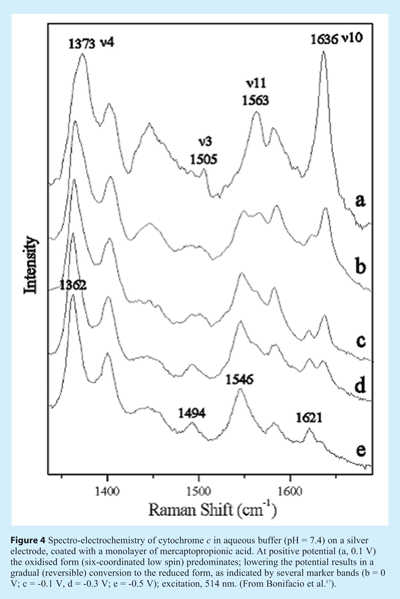
Recently, Bonifacio and coworkers developed a small-volume spectro-electrochemical cell that could be used to record spectra of cytochrome c while varying the potential of the electrode17. During the measurement the cell was moved to avoid photodegradation under the Raman microscope. Changes in the Raman marker bands indicated the reversible oxidation/reduction of the Fe-heme group (see Figure 4). The RRS spectra were extra strong owing to the surface-enhancement effect (SERRS) from the silver electrode. A self-assembled monolayer of mercaptopropionic acid on the electrode prevented direct contact and possible denaturation of the protein on the Ag surface.

Fluorescence background
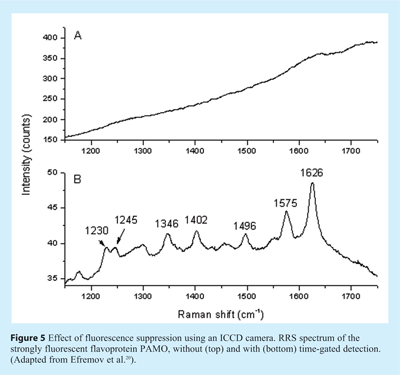
Although fluorescence interference is very minor in deep-UV RRS and in the case of some heme protein studies, fluorescence rejection remains crucial for the full exploitation of RRS in the near UV/visible range. Pelletier gave an overview of available options18. The most promising approach is based on time-gated detection in combination with a pulsed laser since fluorescence photons reach the detector after a certain delay (fluorescence lifetimes are typically in the nanosecond range) compared to the instantaneous scattering signal. For this purpose Matousek’s group developed a Kerr gate detection method19. Recently, in our group an alternative approach was developed that seems to be more easily implemented20. The excitation source is a Ti:sapphire laser that can be frequency-doubled or – tripled, providing freedom in wavelength selection over most of the UV-visible range. The laser is pulsed with a pulse width of about 3 ps (shorter pulses are not appropriate since they are accompanied with an increased spectral bandwidth, negatively affecting the resolution in the Raman spectrum). The repetition rate is as high as 76 MHz, so that low pulse energies can be used and photodegradation is minimised. This laser system is combined with a commercially available intensified charge-coupled device (ICCD) camera, which can be gated very fast (gate closing time as short as 80 ps), and thus most of the fluorescence is not detected. The overall rejection factor depends of course on the lifetime of the fluorescence background; a factor of 50-100 is obtained for lifetimes of a few ns. The feasibility of this approach is demonstrated in Figure 5, showing the effect of ICCD gating on the RRS spectra of phenylacetone monooxygenase, a flavoprotein that gives a strong auto-fluorescence background. In conclusion, we expect that the availability of user-friendly instrumentation and in particular the fluorescence suppression option will stimulate the development of more RRS applications in the 250-600 nm region.

Perspectives
It will be obvious from the applications described above that – because of its selectivity and sensitivity – RRS has many attractive features and is already widely used in fundamental life science studies. However, it has not yet been broadly implemented as a tool in bioanalytical and pharmaceutical chemistry. We believe that in the forthcoming decade this implementation will be seen and RRS will enter bioanalytical research and application laboratories. This expectation is based on current developments in instrumentation and software. In particular the very suitable deep UV-RRS mode may soon see a major breakthrough. Since it is not hindered by fluorescence background, continuous-wave (CW) lasers can be used and rugged, user-friendly instrumentation is currently available. Also the combination of deep UV-RRS with liquid separation methods (LC and CE) has already been demonstrated.
It should be stressed that in favourable cases where fluorescence background is exceptionally weak, CW lasers are also suitable for RRS in the visible range. This applies for instance to many heme proteins where strong RRS signals can be obtained from the porphyrin group. Needless to say that such proteins are very relevant from a pharmacochemistry point of view.
For a broad application of RRS over the full wavelength range, we anticipate a larger role for picosecond lasers and fast-gated detection, which will enable complete wavelength tunability (or even automated scannability) and effective fluorescence background suppression. Current progress in instrumentation development in this field is highly promising.
References
- R.L. McCreery, A.J. Horn, J. Spencer, E. Jefferson, 1998. Noninvasive identification of materials inside USP vials with Raman spectroscopy and a Raman spectral library. J. Pharm. Sci. 87: 1-8.
- J. Rantanen, 2005. Raman spectroscopy: a process analytical tool. Eur. Pharm. Rev. 2005: 53-57.
- M. de Veij, P. Vandenabeele, L. Moens, 2005. The rise of Raman. Eur. Pharm. Rev. 2005: 86-89.
- M. de Veij, A. Deneckere, P. Vandenabeele,, D. de Kaste, L. Moens, 2008. Detection of counterfeit Viagra® with Raman spectroscopy. J. Pharmac. Biomed. Anal., 46: 303-309
- E.V. Efremov, F. Ariese, C. Gooijer, 2008. Achievements in resonance Raman spectroscopy; review of a technique with a distinct analytical chemistry potential. Anal. Chim. Acta, 606: 119-134.
- R.C. Lord, G.J. Thomas Jr., 1967. Raman spectral studies of nucleic acids and related molecules. Spectrochim. Acta A, 23: 2551.
- S.A. Asher, 1993. UV resonance Raman spectroscopy for analytical, physical and biophysical chemistry. Anal. Chem., 65: 59A-66A and 201A-210A.
- A. Toyama, Y. Miyagawa, A. Yoshimura, N. Fujimoto, H. Takeuchi, 2001. Characterization of individual adenine residues in DNA by a combination of site-selective C8-deuteration and UV resonance Raman difference spectroscopy. J. Mol. Struct., 598: 85-91.
- G. Smulevich, A. Feis, 1986. Surface-enhanced resonance Raman spectra of adriamycin, 11-deoxycarminomycin, their model chromophores, and their complexes with DNA. J. Phys. Chem., 90: 6388-6392.
- C.A. Grygon, T.G. Spiro, 1989. Ultraviolet resonance Raman spectroscopy of distamycin complexes with poly(dA), poly(dT) and poly(dA-dT); role of H-bonding. Biochemistry, 28: 4397-4402.
- E. Kocisova, L. Chinsky, P. Miskovsky, 1998. J. Biomol. Struct. Dyn., 15: 1147.
- Z.Q. Wen, S.A. Overman, G.J. Thomas Jr., 1997. Structure and interactions of the single-stranded DNA genome of filamentous virus fd: Investigation by ultraviolet resonance Raman spectroscopy. Biochemistry, 36: 7810-7820.
- S.A. Overman, P. Bondre, N.C. Maiti, G.J. Thomas Jr, 2005. Structural characterization of the filamentous bacteriophage PH75 from Thermus thermophilus by Raman and UV-resonance Raman spectroscopy. Biochemistry, 4 0: 3091-3100.
- C. Gooijer, F. Ariese, R.J. Dijkstra, 2006. Raman Spectroscopy coupled to separations. Eur. Pharm. Rev., 2006: 56-61.
- S. Hashimoto, T. Yabusaki, H. Takeuchi, I. Harada, 1995. Structure and ligand-binding modes of human serum albumin studied by UV resonance Raman spectroscopy. Biospectrosc., 1: 375-385.
- V.W. Couling, P. Fischer, D. Klenerman, W. Huber, 1998. Ultraviolet resonance Raman study of drug binding in dihydrofolate reductase, gyrase, and catechol O-methyltransferase. Biophys. J., 75: 1097-1106.
- A. Bonifacio, D. Millo, C. Gooijer, R. Boegschoten, G. van der Zwan, 2004. Linearly moving low-volume spectroelectrochemical cell for microliter-scale surface-enhanced resonance Raman spectroscopy of heme proteins. Anal. Chem., 76: 1529-1531.
- M.J. Pelletier, 1999. Analytical applications of Raman spectroscopy. Blackwell Science, Oxford.
- P. Matousek, M. Towrie, A. Stanley, A.W. Parker, 1999. Efficient rejection of fluorescence from Raman spectra using picosecond Kerr gating. Appl. Spectr., 53: 1485-1489.
- E.V. Efremov, J.B. Buijs, C. Gooijer, F. Ariese, 2007. Fluorescence rejection in resonance Raman spectroscopy using a picosecond-gated intensified CCD camera. Appl. Spectr., 61: 571-578.


