NIR inspection of each tablet that exits a tablet press
Posted: 31 October 2018 | Alyssa Langlet, Antoine Cournoyer, Himmat Dalvi, Jean-Maxime Guay, Ryan Gosselin | No comments yet
In the pharmaceutical industry, waste represents at least 25% of the cost of quality. In 2004, the Food and Drug Administration (FDA) published a guide to promote the implementation of Process Analytical Technologies (PATs) in the pharmaceutical industry. This would allow better quality control (QC) and monitoring directly on the production line.
The FDA has encouraged manufacturers to use the PAT framework to develop and implement effective and efficient innovative approaches in pharmaceutical development, manufacturing and quality assurance, including continuous real-time quality assurance.
Typically, a limited number of tablets are randomly sampled within a batch for routine analysis. For a batch of a few million tablets, usually only between 10 and 30 are tested.2 The batch is then put in quarantine until QC results are obtained, which generates storage costs and reduces the company’s flexibility to respond to customer’s requirements. If the number of detected faulty tablets is higher than the Acceptance Quality Level, the batch will be manually sorted, reworked, or completely rejected and remanufactured – all of which lead to significant temporal and financial losses.
This article presents an automatic sorting system capable of testing every tablet, without creating a bottleneck for the production line.
Several QC parameters can be alternatively analysed by PATs, such as Near-Infrared Spectroscopy (NIRS) using multivariate models. Initial NIRS applications were performed off-line using a few tablets for testing.3 Offline analyses showed good correlations between studied tablet concentrations and NIR predictions, but this methodology could not be used for in-process tablet monitoring during the manufacturing process, due to lack of time and resources.
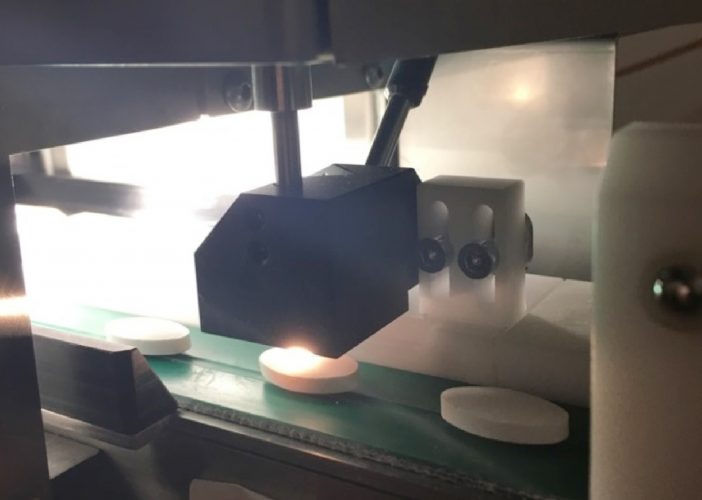
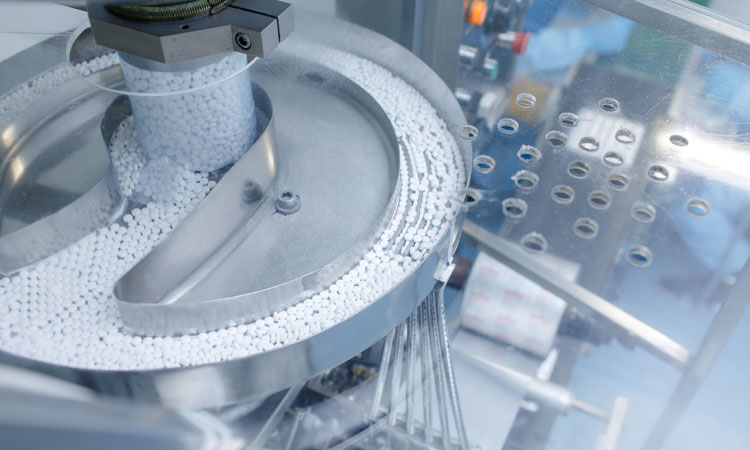
Figure 1: VisioNIR equipment scanning tablets
More recently, the development of in-line rapid technologies has facilitated the possibility of using NIRS to monitor the manufacturing process. In-line tablet monitoring has been discussed in several articles. Tablet chemical composition has been tested via NIRS immediately after compression4 at much lower speeds (6,000 tablets/hour) than those encountered during commercial production (60,000-170,000 tablets/hour).
This study presents work on the NIR acquisition of each tablet coming off a tablet press, achieving high-speed sample presentation to the probe in a consistent manner. A portion of the data was used to calibrate a model able to predict the composition of each tablet. We added a NIR probe to a vision-based system, enabling chemical composition as a sorting criterion. This system was used to discard the tablets with over- or under-potency defects.
Materials and methods
Equipment
The Teonys tablet sorting equipment (Proditec, France) was used to carry out the spectral acquisition. The commercial version is equipped with a colour line-scan camera capable of sorting tablets according to their visual appearance (ie, identifying shape and defects). Even if the machine can reach speeds of up to 300,000 tablets per hour with 5mm round tablets, when both conveyor belts are working simultaneously, this study was led at 55% of its capacity due to tablet shape and roughness.
In this research, a VisioNIR LS probe (Visiotec, Germany), working in reflectance mode, was installed on the commercial Teonys system. Located downstream of the camera, the spectral acquisitions were triggered when a tablet was detected by the visible imaging system. Each tablet was scanned once (single NIR scan) using an integration time of 0.5 milliseconds.
Tablets
The tablet ingredients used for the tests consisted of different concentrations of Ibuprofen. Five blends (A-E) with different concentrations of Ibuprofen pellets were prepared. The concentrations of excipients 1 – 4 were varied to compensate for the changes in Ibuprofen concentration (Table 1). Excipient 5 was kept constant at 1% w/w.
During compression, the blends were sequentially added in a random order (2, 8, 18, 0 and 15.8% w/w) with no interruption between the batches, thus creating transition tablets. Tablet compression was performed at a rate of 23,000 tablets / hour. Tablets were collected at intervals of one minute during the steady-state phases, and at intervals of 15 seconds for 4.5 minutes during the transition phases. A total of 51,458 tablets were thus collected. All the transition-phase and stable-phase tablets were scanned using the VisioNIR probe (850-1650nm – 3nm resolution). The probe was run at an integration time of 0.5ms per spectrum.
312 of these tablets were sub-sampled to calibrate the model. A UV-assay at 264nm was used as a reference method to quantify true Ibuprofen concentrations in the tablets (Table 2). Results show that the five blends approach the expected Ibuprofen concentrations but differ somewhat, possibly due to experimental errors or powder segregation. These assay values, rather than the expected concentrations, were used to calibrate the NIR probe.
Chemometrics
The calibration set (Xcal (312×256)) was composed of NIR spectra of sub-samples acquired by the VisioNIR system, and the Ibuprofen content responses ycal (312×1) found by the assay. The validation matrix Xval (51,458×256) was composed of NIR spectra of all the tablets acquired by the VisioNIR system. Using the Unscrambler X 10.4 software, a 2-component Partial Least Squares (PLS) model was built between Xcal and ycal. Spectra were first cropped between 1051-1201nm and pretreated using SNV and a 2nd derivative Savitzky-Golay. Raw and pretreated spectra are shown in Figure 2. A characteristic absorption peak for Ibuprofen around 1,130nm7 is clearly present in Figures 2b and 2c.
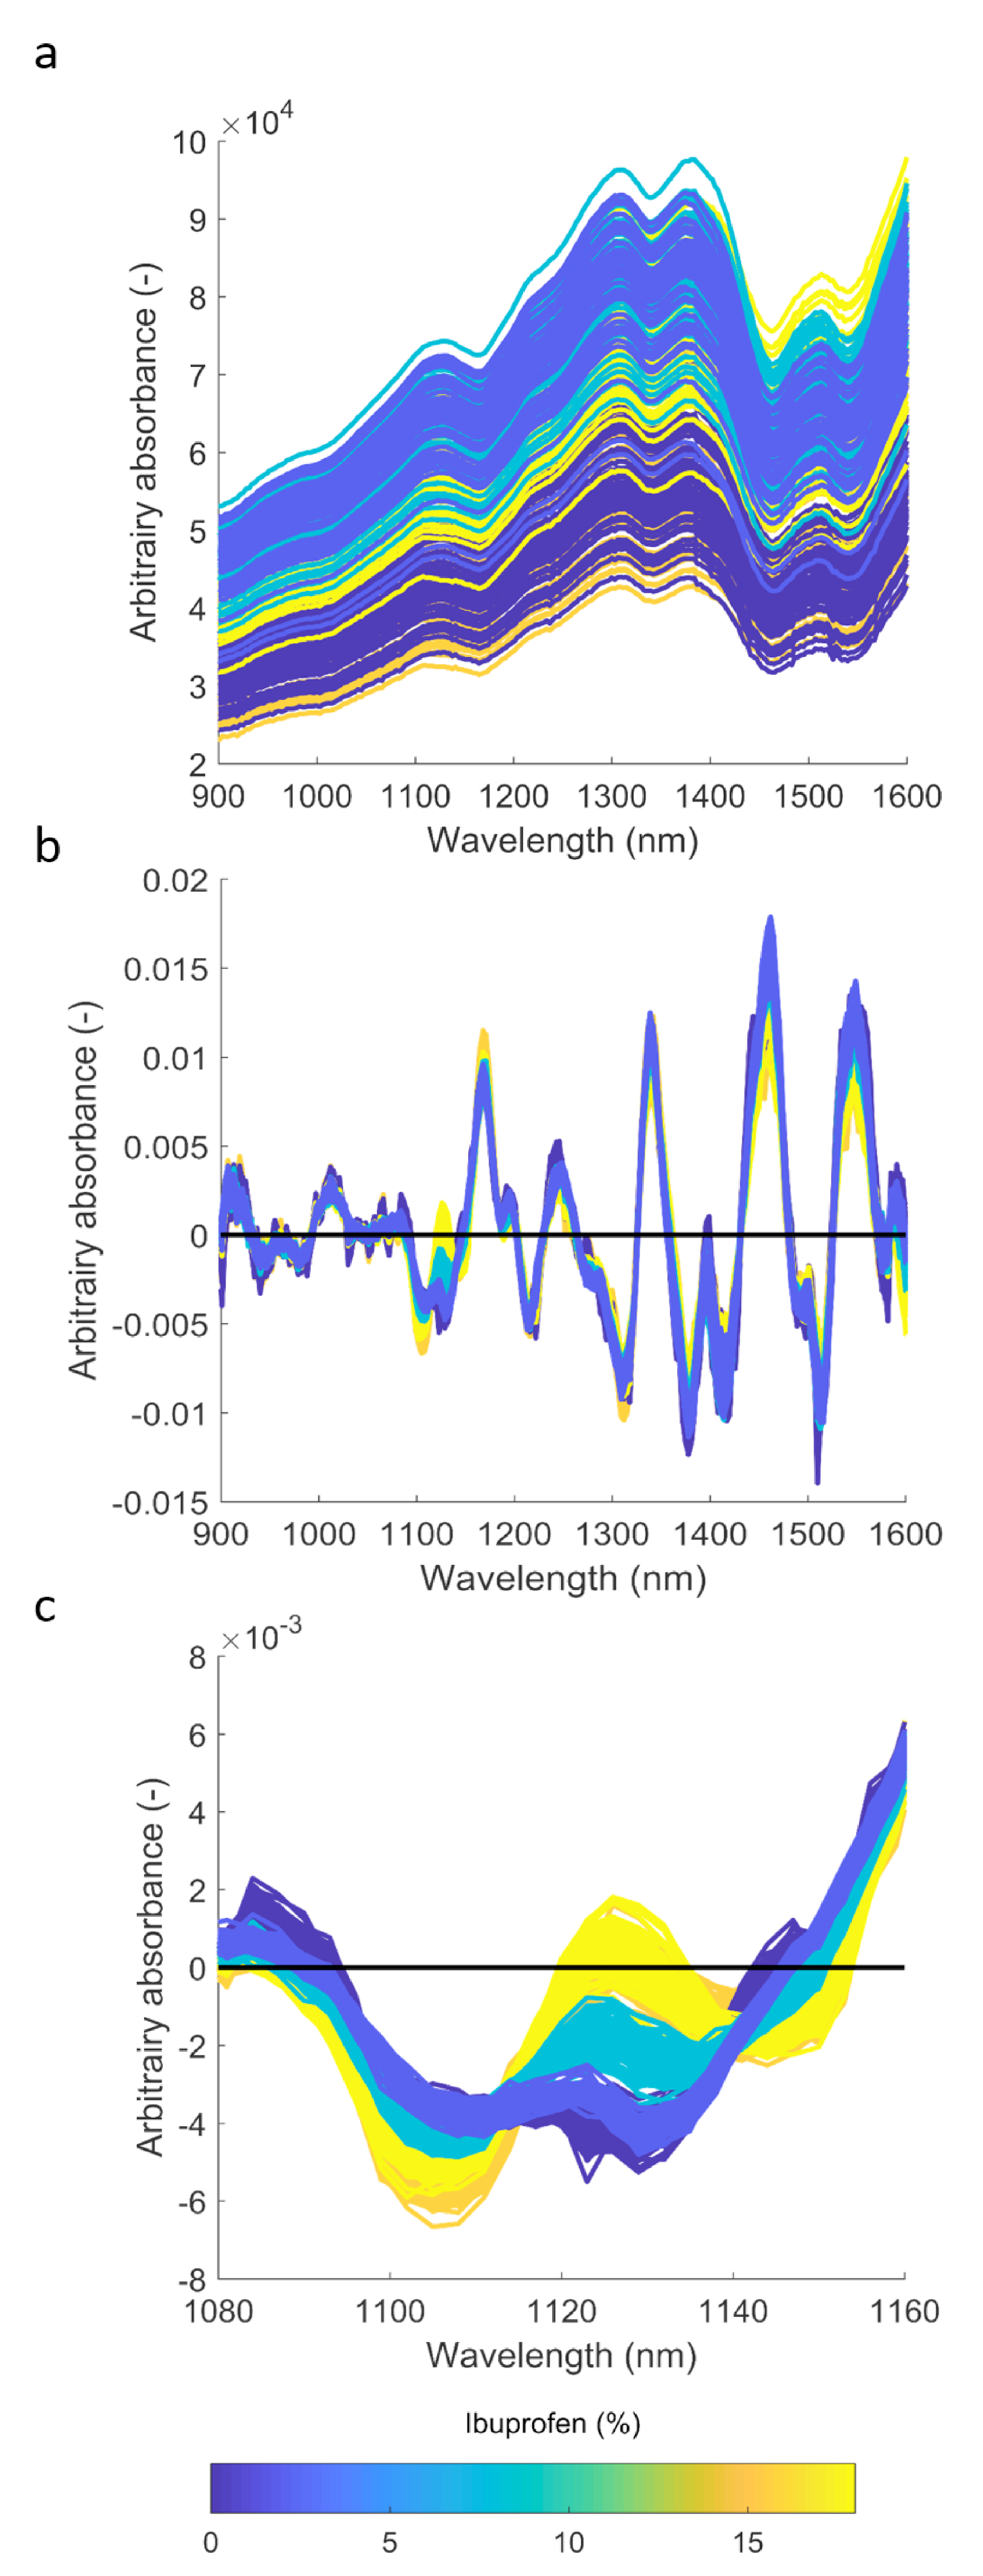
Figure 2: Spectra of the tablets: (a) raw spectra, (b) after SNV and Savitsky-Golay 2nd derivative, and (c) ibuprofen peak around 1130 nm.
The following results are quantified in terms of their R2 and RMSE values. R2 is defined as the strength of a linear relationship between two random variables. It ranges between [0-1] – higher values indicate a better model. Root mean square error (RMSE) measures the difference between predicted and measured response values. Expressed in the same unit as the original response values, it ranges between [0-∞] – lower values indicate a better model. These two indices were used to quantify model performance.
Results and discussion
A PLS model was used to predict the API content of the tablets. The Ibuprofen content of the 312 sub-sampled tablets used to calibrate the model were then predicted via cross-validation. We obtained a R2 equal to 0.93 for cross-validation and a RMSE CV of 1.85% w/w of Ibuprofen. These results mirror those obtained by the UV reference method (Table 2).
Following this, the concentration of all the tablets (51,458) were predicted. For experimental reasons, tablets were gathered in lots of 100 during transition periods (following the step changes) and in lots of 380 during steady state production periods. As temporal information was lost within each lot, we present the average NIR results for each lot in Figure 3. These results show the NIR predicted concentration in which four transitions are clearly shown in response to the concentration step changes applied to the system. Furthermore, these results show a good agreement between the NIR and UV assay results within the steady states: RMSEP of 2.09% w/w Ibuprofen. A small increase in concentration during the transition at 85 minutes matched the UV results, adding credence to the notion that NIR can be used to detect even small variations in tablet contents (possibly as low as 1% as illustrated in Figure 3).
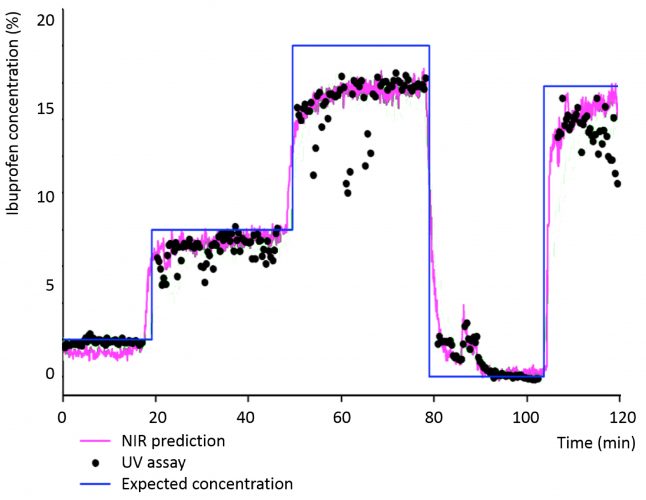
Figure 3: Steady-state and transition Ibuprofen contents for lots of tablets.
While Figure 3 illustrated averaged Ibuprofen results, a prediction was made for each individual tablet. Table 3 presents the maximum and minimum concentrations predicted for individual tablets within each of the five steady states.
These results show significant tablet-to-tablet variations throughout the run. This variability may be attributed to several factors:
- Tablet presentation. Variability in the presentation of the oblong tablets to the probe may be present (Figure 1). This is specific to the scanning system employed and may be addressed by optimising the operation parameters and system geometry (eg, shape of the feeder wheel).
- NIR scanning. The NIR spectra are acquired in reflectance from a portion of the tablet. Any segregation in tablet composition will lead to a biased estimation of that tablet’s composition. This may be addressed with a larger spot size, working with multiple NIR probes located around the tablets, or by acquiring transmitted NIR light.
- The tablet-to-tablet variability observed in the NIR results may simply be caused by the fact that the tablets actually present such a large individual variability. This appears to be supported by large variability also present in the UV assay results (Table 3). Such a fact clearly underlines the need for 100% tablet inspection.
Conclusion
This study is a proof of concept for using online NIR spectroscopy to monitor the Ibuprofen concentration changes in uncoated tablets. Content differences as low as 2% ibuprofen, as well as minor Ibuprofen quantity variations during transition, were successfully captured. However, RMSE of 1.85% and 2.09% for cross-validation and prediction indicate the limitations of this method. In the case of discriminating similar products, it is necessary to make a preliminary analysis to define the risk, depending on the type of active ingredient as well as its concentration in the blend.
An inspection of 100% of the batch is possible, avoiding time and money losses for the company. This type of analysis may eventually be added to the current visual, or cosmetic, inspections. In doing so, products with surface defects and/or out-of-specification API content may be identified and discarded.
Table 1: Tablet formulation
Blend | A | B | C | D | E |
Ingredients | % w/w concentration | ||||
Ibuprofen | 0.00 | 2.00 | 8.00 | 15.80 | 18.00 |
Excipient 1 | 82.37 | 80.40 | 75.66 | 69.12 | 67.40 |
Excipient 2 | 11.85 | 11.80 | 10.96 | 10.06 | 9.70 |
Excipient 3 | 2.39 | 2.40 | 2.19 | 2.01 | 1.95 |
Excipient 4 | 2.39 | 2.40 | 2.19 | 2.01 | 1.95 |
Excipient 5 | 1.00 | 1.00 | 1.00 | 1.00 | 1.00 |
Table 2: Assay results of the sub-sampled tablets. Values in parenthesis are standard deviations.
Ipubrofen concentration (% w/w) | Blend | ||||
A | B | C | D | E | |
Expected | 0 | 2 | 8 | 15.8 | 18 |
UV-assay | 0.7 (0.9) | 1.9 (0.1) | 7.0 (0.7) | 13.8 (1.3) | 17.2 (1.5) |
NIR | 1.0 (1.3) | 1.7 (0.7) | 7.7 (1.5) | 14.7 (1.6) | 15.8 (1.6) |
Table 3: Steady-state Ibuprofen content for individual tablets. Values in parenthesis are standard deviations.
Blend | UV assay (% w/w) | NIR predicted Ibuprofen (% w/w) | ||
Minimum | Maximum | Average | ||
A | 0.7 (0.9) | -0.7 | 2.6 | -0.2 |
B | 1.9 (0.1) | 0.2 | 2.9 | 2.0 |
C | 7.0 (0.7) | 4.5 | 9.3 | 8.0 |
D | 13.8 (1.3) | 11.5 | 17.5 | 13.2 |
E | 17.2 (1.5) | 12.6 | 18.5 | 15.9 |
References
- Kieffer R. The impact of waste on the cost of quality in the pharmaceutical industry, PDA letter, February 8th 2016.
- Uniformity of dosage units (2016), USP 905.
- Blanco M, Coello J, Iturriage H, Maspoch N. (2001). Influence of the procedure used to prepare the calibration sample set on the performance of near infrared spectroscopy in quantitative pharmaceutical analyses. The Analyst 126, p.1129-1134.
- Karande AD, Heng PW, Liew CV. (2010). In-line quantification of micronized drug and excipients in tablets by near infrared (NIR) spectroscopy: Real time monitoring of tabletting process. International Journal of Pharmaceutics. 396(1-2), p.63-74.
- https://discover.asdi.com/bid/99700/Near-infrared-Absorption-Bands-Chart-Free-Download
- http://proditec.com/pharma-products/teonys/
- Romañach RJ, Hernández Torres E, Roman Ospino A, Pastrana Otero I, Semidei Ortiz FM. (2014). NIR and Raman Spectroscopic Experiments to Train the Next Generation of PAT Scientists. American Pharmaceutical Review. November 27.
Biographies
ALYSSA LANGLET is project leader for the development of a high-speed systematic tablet analysis tool for Pfizer and the University of Sherbrooke. With a masters’ in chemical engineering in Canada and two industrial engineering degrees in France and Spain, Ms. Langlet spent several years in both the railway and aerospace industries before joining the Pfizer Chair on process analytical technologies in pharmaceutical engineering.
HIMMAT DALVI received his PhD in chemical engineering from University of Sherbrooke, working with the Pfizer research chair in process analytical technologies. His research interests include pharmaceutical pre-formulation studies, formulation development, technology transfer and development of PAT tools for process understanding as well as continuous process monitoring. He has more than eight years of experience in pharmaceutical formulation research and development. He played a key role in the development of multiple drug formulations for new chemical entities as well as generic formulations and technology transfers at commercial scale.
JEAN-MAXIME GUAY is a Senior Scientist leading PAT development and implementation initiatives at Pfizer. He joined Pfizer’s Manufact`1uring Process Analytics and Control group (MPAC) in 2012. Jean-Maxime previously earned BA degrees in bioinformatics and biotechnological engineering. He is currently responsible for the technical support and implementation of Rapid Analytics in manufacturing sites within the Consumer Healthcare and Sterile Injectable operating units. He is also part of the Automated Quality Verification Technologies (AQVT) team involved in supporting PGS sites on automated inspection technology projects.
ANTOINE COURNOYER is Manager at Pfizer – PAT Projects within the MPAC (Manufacturing Process Analytic and Control) Team in GTS. In his role, he currently supports PAT and Process Analytics development and implementation projects for Consumer, Local Market and Sterile injectable sites, mainly across North America, Europe and Asia. Antoine joined Pfizer in 2003 working in Technical Services at the Montréal manufacturing site. He then became PAT Scientist and worked in a global PAT development and implementation role as part of the Montréal team. Antoine holds an MBA, a Master in Pharmaceutical sciences, and a Bachelor in Chemical Engineering.
RYAN GOSSELIN is an associate professor in the Department of Chemical Engineering and Biotechnological Engineering at University of Sherbrooke, Canada. He specialises in process engineering and on-line quality monitoring through the use of multivariate data analysis, chemometrics and data mining. His work mainly focuses on industrial process optimisation through the use of spectral and imaging probes. He co-chairs the Pfizer Industrial Research Chair on Process Analytical Technologies (PAT) in pharmaceutical engineering.
The rest of this content is restricted - login or subscribe free to access
 Thank you for visiting our website. To access this content in full you'll need to login. It's completely free to subscribe, and in less than a minute you can continue reading. If you've already subscribed, great - just login.
Why subscribe? Join our growing community of thousands of industry professionals and gain access to:
- bi-monthly issues in print and/or digital format
- case studies, whitepapers, webinars and industry-leading content
- breaking news and features
- our extensive online archive of thousands of articles and years of past issues
- ...And it's all free!
Click here to Subscribe today Login here
Issue
Related topics
Analytical techniques, Manufacturing, Research & Development (R&D)