High content screening as improved lead finding strategy
Posted: 19 March 2008 | Dr. Marjo Simonen and Dr. Daniela Gabriel, Novartis Institutes for Biomedical Research, Basel | No comments yet
High content screening (HCS) is based on subcellular imaging using automated microscopy, in combination with automated image analysis. High content screening was first introduced over a decade ago as one of the promising new technologies, intended to address the bottleneck of secondary assays in the development of new drugs. Since then, the application has rapidly expanded throughout the entire drug discovery process, from target identification and validation, through to lead optimisation and detailed investigation of the mode of action.[1,2,3]
High content screening (HCS) is based on subcellular imaging using automated microscopy, in combination with automated image analysis. High content screening was first introduced over a decade ago as one of the promising new technologies, intended to address the bottleneck of secondary assays in the development of new drugs. Since then, the application has rapidly expanded throughout the entire drug discovery process, from target identification and validation, through to lead optimisation and detailed investigation of the mode of action.[1,2,3]
High content screening (HCS) is based on subcellular imaging using automated microscopy, in combination with automated image analysis. High content screening was first introduced over a decade ago as one of the promising new technologies, intended to address the bottleneck of secondary assays in the development of new drugs. Since then, the application has rapidly expanded throughout the entire drug discovery process, from target identification and validation, through to lead optimisation and detailed investigation of the mode of action.[1,2,3]
One main characteristic of HCS is its capability of multiplexing, meaning not only several additional reagents creating several read outs, but also gives the ability to analyse different parameters of each individual cell, within an array of cells. Temporary cellular events which can be analysed via live cell and population analysis deliver sensitive results of rare events within the cell population.
An area where HCS shows its benefits is in the high throughput screening of small molecules for lead finding. Increasingly, pharmaceutical companies successfully screen their full collection; however, the throughput is limited by the assay procedure, including washing and fixation steps4,5. Image collection and data analysis time can be another throughput limiting factor, depending on instrument setup and complexity of the biology to be analysed.
Using high content screening as a primary screening read out offers the ability to address pathway interferences in a cellular environment and to eliminate cytotoxic compounds which are manifested as a reduced cell number. Sorting out hits based on low cell number and those with fluorescent properties assists in hit list triaging, in order to streamline follow up activities to true cellular active hits.
At the Lead Finding Platform of Novartis Institutes for Biomedical Research (NIBR) based in Basel, we have utilised high content screens since May 2005, starting with a group of six people using a laser scanning instrument (IN Cell Analyzer 3000™, GE). In several other departments within NIBR, high content analysis is implemented for low throughput applications, specific for the disease area, toxicity profiling or pathway elucidation.
In order to expand the use of higher throughput of the Lead Finding Platform in Cambridge, they have recently introduced a plate cytometer (Acumen Explorer™) for high throughput subcellular imaging campaigns. These instruments complement each other well: the former having confocal resolution to detect subtle intracellular changes but limited throughput and the latter regarded as a low resolution instrument, but with the ability to quantify changes of nuclear translocation events with a higher throughput.
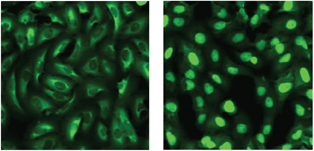
In order to choose the best strategy for primary screening campaigns, we investigated how HCS compares to non image based read outs, in terms of variability and sensitivity. We performed a study to determine the interday variability of two assay setups: a subcellular imaging assay based on the translocation of the transcription factor FOXO3a fused to GFP from the cytoplasm to the nucleus (Figure 1), as well as a reporter gene assay based on transcription of luciferase induced by FOXO3a. A focused set of 3,000 compounds mainly including known kinase scaffolds were screened in order to enhance the chance of positive hits. We found that subcellular imaging has a reliable reproducibility comparable with more established techniques like reporter gene assays (RGA) and FLIPR. In addition, the sensitivity of the subcellular imaging assay, based on IC50 data, was four-fold higher compared to IC50 data determined with RGA. We concluded that subcellular imaging is a sensitive technique for lead discovery, with the ability to multiplex and derive spatial information6.


Figure 1: Osteosarcoma cells stably transfected with FOXO3a-GFP. After inhibitor treatment the FOXO3a-GFP translocates from the cytoplasm (A: DMSO control) to the nucleus (B: LY294002, PI3K inhibitor). By analysing the fluorescence within the nucleus and the cytoplasm a quantitative measure of inhibitor activity can be derived.
With our high content instrumentation, we support assays for multiple disease areas of NIBR: oncology, neuroscience, respiratory diseases, immunology, cardiovascular and infectious diseases. Assay formats and read outs are therefore variable, including: nuclear translocation, protein phosphorylation, receptor internalisation, intracellular trafficking of proteins, virus infection, neurite outgrowth and neurotoxicity assays with primary cells. Due to the specificity of targets and required cell lines, we rarely use commercially available assay kits.
The majority of the assays are developed in-house, mostly in collaboration of the disease area with the lead finding platform.
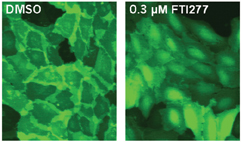
An assay that has been developed recently to specifically study the mevalonate pathway and protein prenylation, for example, is considered to be a complex assay development project7 (Figure 2).


Figure 2: U-2 OS cells expressing a GFP reporter for protein prenylation. The cells were treated either with DMSO as a control (A) or 0.3 µM FTI277, a farnesyltransferase inhibitor (B). The GFP reporter localised mainly in the plasma membrane in untreated cells. FTI277 prevents prenylation of the reporter and thereby causes a cytosolic localisation of the reporter. The image analysis software quantifies the localisation of GFP, by measuring the distance of the peak intensity of GFP from the nucleus.
Generally, in compound screening the fixation of cells instead of live cell imaging is preferred, due to the fact that fixation allows decoupling of sample preparation and image recording, thereby cumbersome logistics to ensure imaging of every sample exactly after the same incubation time can be avoided.
In some assays, fluorescent proteins like GFP fusion proteins are used. However, the majority of projects require antibody staining.
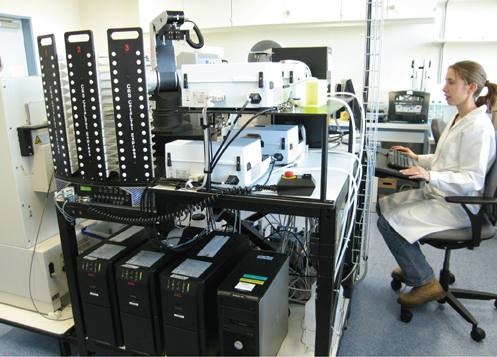
We integrated an automated plate preparation platform for the staining procedure combining four reagent dispensers, two plate washers, two storage units and one plate sealer via a robotic arm which automatically loads the imaging ready plates to the 4°C incubator (Figure 3). We decoupled the plate preparation on purpose from imaging to account for longer imaging times and to have flexibility in fitting in both large screens and experiments for assay development.


Figure 3: The automated plate preparation platform for HCS at the Lead Finding Platform, Basel comprised of four reagent pipettors, two plate washers, two incubators, one plate sealer, one 4°C incubator, one 37°C incubator and one robotic arm.
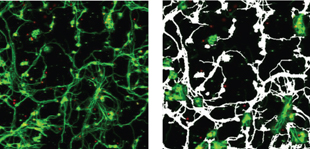
Although the automation allows a certain throughput, the number of plates per screen varies as much as their scope. Assays with certain primary cells need 96-well capabilities resulting in a small amount of compounds which can be analysed. For instance, we developed a neurite outgrowth assay, using isolated primary cerebellar granule neurons having a current maximum throughput of 20 plates per day is limited by the cell preparation (Figure 4). In contrast, we were able to obtain a throughput of 60 plates (384 well) per day by using a stably transfected cell line with a FOXO3a-GFP fusion protein, enabling us to screen a total number of 250,000 compounds in a multiplexed fashion combined with antibody staining to study phosphorylation of protein related to another pathway. Here, the limiting factor for throughput was the imaging time, which took approximately 20 minutes for each 384-well plate with our setup (three colors, no binning, and one image/well). A counterscreen was performed by assaying the translocation of an unrelated transcription factor from the cytoplasm to the nucleus. This enabled us to deselect compounds that un-specifically induced nuclear translocation. Finally, several compounds were identified which proved to be selective for the FOXO3a translocation. Based on the scaffolds that were found active and specific in the FOXO3a translocation screen, hit list expansion was performed towards the rest of the library and follow up studies are ongoing.


Figure 4: Rat cerebellar granule neurons labeled with anti ‚-tubulin III antibody (green) and nuclear label DRAQ5™ (red). The image analysis software is able to analyse several read out parameters e.g. cell number, neuronal number, number, length and area of neurites.
Image analysis is a critical step in high content screening and vendors of HCS instruments typically provide analysis tools for various applications. Since the format of the images is normally proprietary to the instrument, image analysis is first performed with the software provided by the instrument vendor. The IN Cell 3000 Investigator™ software is fast by allowing image acquisition and image analysis simultaneously. However, for some applications we need to analyse images with software from other vendors which requires image reformatting. Neurite outgrowth applications are provided by several vendors with different options of read out parameters making it worthwhile to compare them according to the specific needs. To facilitate the use of third party image analysis software, harmonisation of the image formats would be very welcome by the HCS user community. Embedded in a high throughput environment, the image analysis results are visualised with a Novartis own solution for quality assessment of screening plates and automated curve fitting. From this software, we are able to publish screening results based on the mean well value normalised to the controls together with IC50 curves to an in-house database accessible for all colleagues within Novartis. In this process, the link of the images to data with concentration-response curves (CRC) and compound number is currently not established. Performing a search for a compound should finally provide all data generated linked to the images from all assays where the compound was analysed. Software tools to allow data visualisation together with CRC and the original images for a compound are becoming more important with the large amount of data generated, and HCS instrument providers start investigating in these solutions more and more.
In our current image based assays we usually collect a small number of read out parameters (<10) selected according to the project specific needs. By analysing subpopulations to build profiles based on diverse parameters, including measures of cell morphology, cell cycle progression and even cell motility, an unbiased approach allowing for unexpected features could add to the drug discovery process8, 9, 10. Available methods for data analysis often assume a Gaussian distribution of the data. However, there is increasing evidence that biological data sets do not always follow such behavior when analysing subtle parameter changes in heterogeneous cell populations. Calculation of means and standard deviations as a basis for determining statistical significance between treated and untreated wells is not suitable for these data sets. Kolmogorov-Smirnov (KS) statistics might be one solution to compare subpopulation data sets as successfully developed and applied by Perlman et al8. But it should be mentioned that this type of analysis will only allow discrimination between two populations differing by one variable. Alternative methods for comparing the distribution of results that have not been explored for such data sets would include multidimensional versions for the KS11 and Anderson-Darling analysis12. Handling and analysis of huge multi parametric data sets in an automated fashion remains still one of the challenges of HCS.
High content screening has proven to be a useful tool for compound confirmation in secondary assays. Its potential in the primary lead finding area lies within the possibility to perform phenotypic screening of compound effects without knowing the target ‘per se’. Morphology changes, cell cycle regulators, apoptosis inducer and neurite outgrowth enhancers are some examples where active compounds could be identified first by phenotypic screening followed by target identification. The classical approach by screening a defined target with biochemical assays first and thereafter confirming the activity in secondary cellular assays might be reversed in future by choosing a phenotypic screen as the primary step followed by identification of the target by biochemical specificity testing.
Acknowledgements
We would like to thank G. Hofmann, Y. Ibig-Rehm, D. Siebert and V. Unterreiner for their excellent technical assistance, also M. Schröder, E. Althof, G. Herr, not forgetting S. Capretta for IT and automation, lastly P. Fürst for his managerial support.
References
- DL Taylor, ES Woo, KA Guiliano. Real-time molecular and cellular analysis: the new frontier of drug discovery. (2001) Curr. Opin. Biotech. 12, 75-81
- BR Conway, LK Minor, JZ Xu, JW Gunnet, R DeBiasio, MR D’Andrea, R Rubin, RDe Biasio, K Guiliano, L Zhou, KT Demarest. Quantification of G-Protein Coupled Receptor internalization using G-Protein Coupled Receptor-Green Fluorescent Protein Conjugates with the ArrayScantrade mark high content screening system. (1999) J. Biomol. Screen. 4, 75-86
- DL Taylor, KA Guiliano. Multiplexed high content screening assays create a systems cell biology approach to drug discovery. (2005) Drug Disc. Today, 2, 149-154
- Z Li, Y Yan, EA Powers, X Jing, K Janjua, T Garyantes, B Baron. Identification of Gap Junction Blockers using Automated Fluorescence Microscopy Imaging. (2003) J. Biomol. Screen. 8 (5), 489-499
- KM Borchert, RJ Sells Galvin, CA Frolik, LV Hale, DL Halladay, RJ Gonyier, OJ Trask, DR Nickischer, KA Houck. High content screening assay for activators of the Wnt/Fzd pathway in primary human cells. (2005) Assay Drug Dev Tech, 3(2), 133-141
- Unterreiner V, Ibig-Rehm Y, Simonen M, Gubler HP, Gabriel D, Inter-day variability comparison of nuclear translocation and luciferase reporter gene assay formats, in preparation
- M Simonen, Y Ibig-Rehm, G Hofmann, J Zimmermann, G Albrecht, M Magnier, V Heidinger, D Gabriel. High content assay to screen for inhibitors of protein prenylation submitted.
- ZE Perlman, MD Slack, Y Feng, TJ Mitchison, LF Wu, SJ Altschuler. Multidimensional drug profiling by automated microscopy. (2004) Science, 306, 1194-1198
- L-H Loo, LF Wu, S Altschuler. Image based multivariate profiling of drug responses from single cells. (2007) Nature Methods, 4(5), 445-453
- DW Young, A Bender, J Hoyt, E McWhinnie, G-W Chirn, CY Tao, JA Tallarico, M Labow, JL Jenkins, TJ Mitchison, Y Feng. Integrating high content screening and ligand-target prediction to identify mechanism of action. (2008) Nature Chem. Biol., 4 (1) 59-68
- G Fasano, A Franceschini. A multidimensional version of the Kolmogorov-Smirnov test. (1987) Monthly Notices R Astron Soc., 225, 155-170
- MA Stephens. EDF Statistics for Goodness of Fit and Some Comparisons. (1974) J. Am. Stats. Ass., 69, 730-737
Dr. Marjo Simonen
Novartis Institutes for Biomedical Research, Basel
Dr. Marjo Simonen is a laboratory head for the Medium Throughput Screening group in the Centre of Proteomic Chemistry at Novartis Institutes for Biomedical Research in Basel, Switzerland. Her laboratory focuses on assay development and lead discovery by small molecule screening using HCS. She received her Ph.D. in molecular biology 1994 at the University of Helsinki, Finland, studying secretion of heterologous proteins in ‘Bacillus’ bacteria and in yeast. During her postdoctoral training at Ciba-Geigy / Novartis she studied interactions between members of the Bcl-2 family using yeast two-hybrid technology. Thereafter she worked as a Senior Scientist in the Brain Research Institute, Zurich, studying molecular biology of neuronal regeneration. Since 2001 she has been working as a laboratory head at Novartis Institutes for BioMedical Research, and since 2005 the work has focused on high content screening.
Dr. Daniela Gabriel
Novartis Institutes for Biomedical Research, Basel
Dr. Daniela Gabriel is Group Leader of the Medium Throughput Screening Group in the Center of Proteomic Chemistry at Novartis Institutes for Biomedical Research in Basel, Switzerland. Her group focuses on lead discovery by small molecule screening of cell based assays in medium throughput format, with the emphasis on high content screening. She received her Ph.D. in Biochemistry 1998 at the Max Planck Institute of Biochemistry in Martinsried, Germany, developing detection technologies for protein-protein interactions. During her postdoctoral training in the Biotechnology department at Novartis she developed bioassays using a biosensor. Since 2001 she has been working in the Lead Discovery Field at Novartis Institutes for BioMedical Research.


