From data to knowledge through smart Process Analytical Technologies (PAT) and process systems engineering
Posted: 3 December 2008 | Julian Morris, Professor of Process Control and Technical Director at the Centre for Process Analytics and Control Technology (CPACT) and Dr Zengping Chen, Chemical Engineering and Advanced Materials, Newcastle University, UK | 2 comments
Pharma-Chem and bio-pharma development and production are now being profoundly influenced by the FDA PAT1 initiative with spectroscopic instrumentation being increasingly applied, or at the very least explored in product and process development and for on-line real-time process applications. The issues related to robust spectroscopic data analysis and calibration modelling and maintenance becomes even more important if PAT is to be widely accepted and applied, especially for the large number of SMEs involved in supplying intermediates and APIs, and in pharmaceuticals manufacturing2.
Pharma-Chem and bio-pharma development and production are now being profoundly influenced by the FDA PAT1 initiative with spectroscopic instrumentation being increasingly applied, or at the very least explored in product and process development and for on-line real-time process applications. The issues related to robust spectroscopic data analysis and calibration modelling and maintenance becomes even more important if PAT is to be widely accepted and applied, especially for the large number of SMEs involved in supplying intermediates and APIs, and in pharmaceuticals manufacturing2.
Pharma-Chem and bio-pharma development and production are now being profoundly influenced by the FDA PAT1 initiative with spectroscopic instrumentation being increasingly applied, or at the very least explored in product and process development and for on-line real-time process applications. The issues related to robust spectroscopic data analysis and calibration modelling and maintenance becomes even more important if PAT is to be widely accepted and applied, especially for the large number of SMEs involved in supplying intermediates and APIs, and in pharmaceuticals manufacturing2.
The routine application of PAT within a process control environment requires that the building of calibration models becomes a routine, non-expert, application embedded within a process systems engineering context. However, unlike in off-line assays, the spectroscopic measurements in industrial on-line and in-line applications are almost inevitably subjected to fluctuations in external process variables (e.g. temperature) as well as sample’s physical properties (e.g. sample compactness, sample’s particle size and shape), which makes the task of building a multivariate calibration model far beyond a routine job. Chemometrics can provide sophisticated methodologies and algorithms for advanced spectral data analysis which is a corner stone of PAT and hence of significant importance to the process systems engineering community in the wide routine application of PAT. A number of methodologies3 are available for addressing, in one way or another, such challenges.
Correction of temperature induced spectral variations
Fluctuations in temperature provoke non-linear shifts and broadening in spectral bands of absorptivity spectra of constituents in mixture samples via the changes in intermolecular forces. If process temperature variations have not been taken into account during the data collection phase of the calibration task, the calibration model built on the spectral data measured at particular temperatures can only provide accurate predictions for reactions operating at the same temperatures. Temperature is a continuous variable in process analytical control applications. It is not possible to build calibration models for every possible temperature that will be encountered during process manufacturing. In order to apply the calibration models established at training temperatures to future on-line measurements under different temperature profiles it is necessary to model the temperature effects on spectroscopic measurements. Due to the nonlinear characteristic of temperature effects, neither implicit modelling through the inclusion of temperature into the calibration experimental design nor explicit inclusion of temperature into the calibration model (such as treating the temperature of samples as an extra independent variable appended to the spectra or as another dependent variable)4 can successfully eliminate the temperature influence on the predictions of calibration models. There are a large number of methods contributing towards attempting to resolve these and related calibration issues e.g. calibration based on robust variable selection; Synthetic model; Piecewise Direct Standardisation (PDS)5,6, continuous piecewise direct standardisation (CPDS)7 for compensation of temperature effects on spectra; and extended penaliSed signal regression8. Individual contribution standardisation (ICS) was first proposed by Chen et al9 to eliminate temperature effects on the predictive abilities of calibration models for white chemical systems (or fully characteriSed chemical systems)10. ICS has the advantages of good performance and straightforward implementation. Furthermore, it does not require the same training samples to be measured at all training temperatures, and was specifically designed for white chemical systems and could not be applied to grey chemical systems (or incompletely characterised chemical systems). The basic assumption behind LSS is that the absorbance of each chemical species in every wavelength follows simple polynomials with respect to temperature. From this basis, it can be deduced that the corresponding elements of the loading vectors for spectral data measured at different temperatures can also be described by simple polynomials. The polynomials estimated from the training samples measured at specific training temperatures can then be used to predict the loading vectors at the test temperature, which play an important role in correcting spectral variations caused by temperature differences between calibration models and measurements made during production process control.
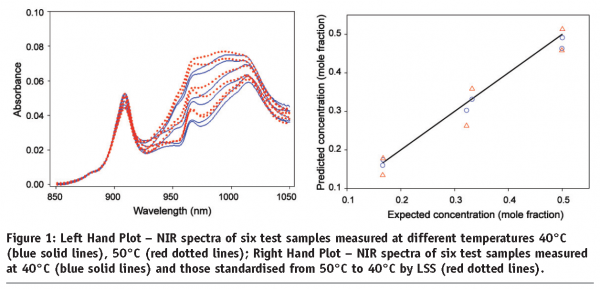
An application of LSS to Near-IR Spectral Data11 is set out below. The data comprises 95 Near-IR spectra of 19 ternary mixtures of ethanol, water and 2-propanol, measured at five different temperature levels (30°C, 40°C, 50°C, 60°C and 70°C). The 19 samples at each temperature were divided into 13 training samples and 6 test samples. Figure 1 (left hand plot) shows the spectra of 6 test ternary mixture samples measured at both 40°C and 50°C. Significant temperature effects can be readily observed. A PLS calibration model with four underlying components was built on the NIR spectra from 13 training mixture samples measured at 40°C. It was used to predict the concentrations of ethanol in six test mixture samples from their spectra measured at both 40°C and 50°C (Figure 1 right hand plot). It can be observed that as expected the temperature-induced spectral variations caused large errors in the predictions for ethanol concentrations in the six test samples from their spectra measured at 50°C.

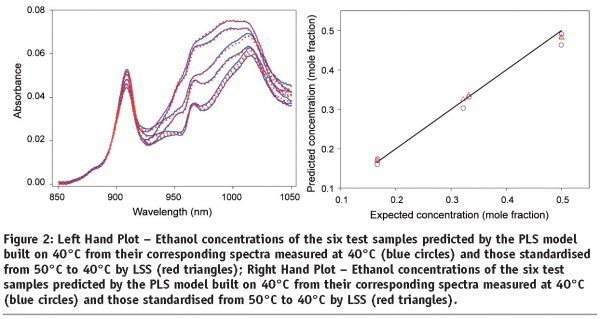
Loading Space Standardisation (LSS) was then applied to remove the temperature-induced spectral variations with a view to correcting the temperature effects on the predictions of PLS model built on 40°C and its application to the spectra measured at temperatures other than 40°C. Figure 2 (left hand plot) shows the results of applying Loading Space Standardisation. It can be seen that the temperature effects on the spectral measurements has been effectively removed by the application of LSS. The LSS based PLS model built on 40°C is observed to be able to provide accurate predictions for the ethanol concentrations of the six test samples from the spectra standardised from 50°C to 40°C using LSS (Figure 2 right hand plot on page 84).

Variations in optical path length due to materials physical differences
Another additional issue of concern with the wide implementation of PAT is that when analysing more or less intact complex reactions and materials by spectroscopic instruments, the uncontrolled variations in optical path length due to the physical variations of materials such as particle size and shape, micro-organism growth, sample packing and sample surface may cause dominant multiplicative light scattering perturbations which will mask the spectral variations related to the content differences of chemical compounds in samples. A number of chemometric pre-processing methods3 such as Multiplicative Signal Correction (MSC) and its modification versions, Inverted Signal Correction (ISC), Extended Inverted Signal Correction (EISC) and extended MSC (EMSC) have been proposed to explicitly model the multiplicative effects caused by the variations in samples’ physical properties. However MSC, ISC and EISC can only be applied to the spectrum that has wavelength regions containing no chemical information, i.e. influenced only by the multiplicative effects. Otherwise, it will produce dramatically bad results. The application of EMSC is strongly dependent on the availability of the pure spectra for all the chemical components present in the samples and the consistency of the spectral contributions from the components in the mixtures with the components isolated in the pure state. In practice, the applicability of EMSC is limited as a consequence of the difficulties in satisfying these two requirements.
A novel multiplicative light scattering correction method ‘Optical Path Length Estimation and Correction [OPLEC]’12 has been developed which does not place any requirement on prior chemical knowledge and can be generally applied in critical unit operations in pharmaceuticals in order as well as in specialty chemicals and polymers manufacturing. The development of Optical Path Length Estimation and Correction method (OPLEC) provided a major contribution to the solution to multiplicative light scattering problem. Without using any prior spectroscopic knowledge, OPLEC was shown to be able to accurately estimate the multiplicative parameter, efficiently separate the multiplicative effects of samples’ physical properties from the spectral variations related to the chemical components and hence significantly enhance the prediction accuracy of the calibration models. Compared with other existing multiplicative effects correction methods, there are no additional information requirements with respect to the spectral data for the application of OPLEC. Consequently OPLEC potentially has wider applicability than other methods reported in the literature. The effectiveness of the OPLEC algorithm with respect to its ability to remove the spectral variations related to multiplicative light scattering was evaluated illustrated through its application to a near infrared spectroscopic data of mixtures of wheat gluten and starch powder12. The powder mixture data set consists of 100 near-infrared transmittance spectra of five mixtures of gluten and starch powder with different weight ratios (1:0, 0.75:0.25, 0.5:0.5, 0.25:0.75 and 0:1) measured in 20 replicates. 60 spectra from the three mixtures with the ratio of gluten/starch equal to 1:0, 0.5:0.5 and 0:1 formed the calibration data set. The test set comprised the remaining 40 spectra from the other two mixtures.
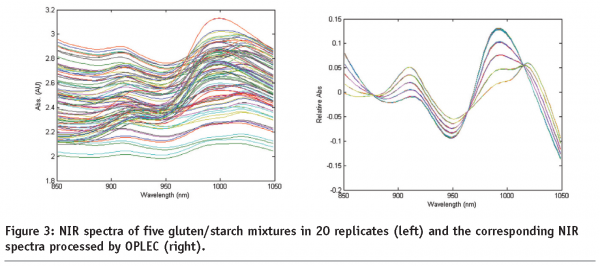

Figure 3 on page85 (left hand plot) shows the 100 NIR spectra of five gluten/starch mixtures. Since there are only five mixtures, it is expected to see five bunches of spectra. But, due to the light scattering effects caused by changes in optical path length during each measurement, all the 100 spectra are quite different from each other. With the application of OPLEC, the pre-processed spectra of the five mixtures are seen as five distinct spectral patterns (Figure 3 right hand plot on page 85). The 20 replicates for each mixture appear superimposed and almost indistinguishable.
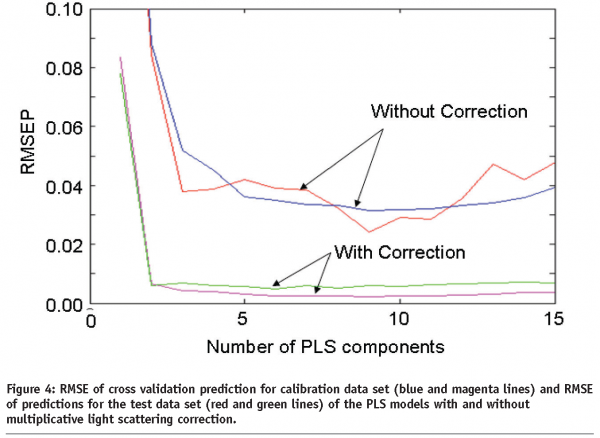

Figure 4 compares the predictive performance of the two PLS calibration models built on the raw NIR spectra and the OPLEC processed spectra, respectively. It is particularly noticeable that the application of OPLEC results in a significant decease in the root mean square error values for both calibration and test data set.
Although OPLEC was originally designed to correct for multiplicative light scattering caused by changes in optical path length due to variations in samples’ physical properties, it can be applied to other problems with multiplicative nature such as the calibration of Raman spectra of suspension samples. Recently, there has been an increasing interest in using FT-Raman spectroscopy in on-line real time applications to identify polymorphic forms and monitor solvent-mediated polymorphic form transformation for quality control in pharmaceutical and specialty chemicals products. However, there are issues related to suspension samples where Raman intensities depend on the analyte concentrations as well as particle size, density and homogeneity of the solid phases in the mixtures which can make quantitative Raman analysis rather difficult. Based on OPLEC, recent research has developed a new calibration strategy, Multiplicative Effects Correction (MEC), to explicitly account for the confounding effects of samples’ physical properties on Raman intensities13. MEC can separate the Raman contributions due to the changes of analyte concentration from those caused by the multiplicative confounding effects of samples’ physical. Space precludes a detailed discussion of the new algorithm which is available in Chen et al13. Experimental results show MEC can effectively correct for the confounding effects of particle size and density on Raman intensities methods properties.
Correction of combined temperature and multiplicative effects
In practice, variations in temperature and samples physical properties are always intermingled together and jointly affect the spectral measurements. Therefore, methods that can simultaneously address both kinds of non-linear effects are highly desirable. A new chemometric method, termed Extended Loading Space Standardisation (ELSS) has been developed to correct both the temperature-induced spectral variations and multiplicative effects caused by changes in optical path length due to samples’ physical differences14. ELSS can efficiently model the external nonlinear effects in both data sets and greatly improve the accuracy of predictions with the mean square error of prediction for test samples being two to three times smaller than those of LSS and global PLS. ELSS has been successfully applied to the on-line supersaturation monitoring and control of the crystallisation processes of Monosodium Glutamate and L-glutamic acid using ATR-FTIR spectroscopy15.
Improving the signal-to-noise ration through smoothed principal components analysis and XRD for on-line monitoring of crystal morphology
X-ray diffraction spectroscopy is one of the most widely used methodologies for the in-situ analysis of kinetic processes involving crystalline solids. However, due to its relatively high detection limit, it has only limited application in liquid crystallisations. In a crystallisation process, it is essential that the formation of undesirable morphologic forms is detected as early as possible. Consequently methods that can lower the detection limit (or enhance the signal to noise ratio) of X-ray diffraction spectroscopy are highly sought after. One way to enhance the signal to noise ratio of X-ray diffraction spectra, measured in a crystallisation process, is to pre-process the spectra using statistical or chemometric methods such as the maximum likelihood approach, stochastic resonance based method, Wavelet transforms, Fourier transforms, Savitzky-Golay and orthogonal signal correction. To address the limitations of these approaches mitation, smoothed principal component analysis (SPCA) which takes the advantage of both the frequency information and the common variation within a set of spectra, is proposed to pre-process noisy X-ray diffraction spectra measured during a crystallization process16.
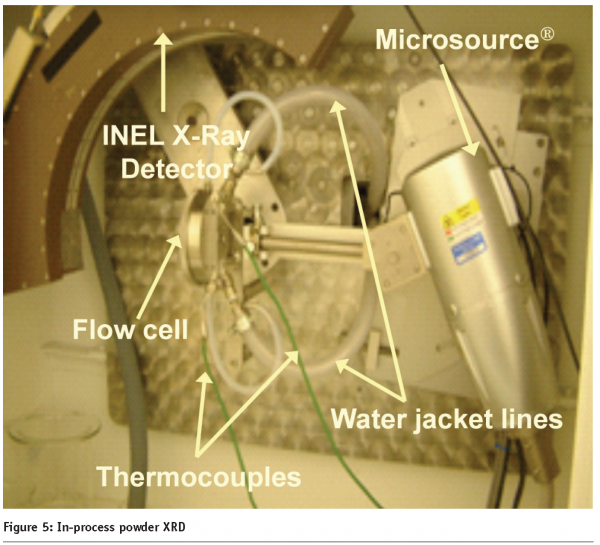

Figure 5 on page87 shows the in-process INEL CPS120 X-Ray detector X-Ray provided by Bede Scientific monitoring a L-Glutamic Acid (LGA) cooling crystallization process.
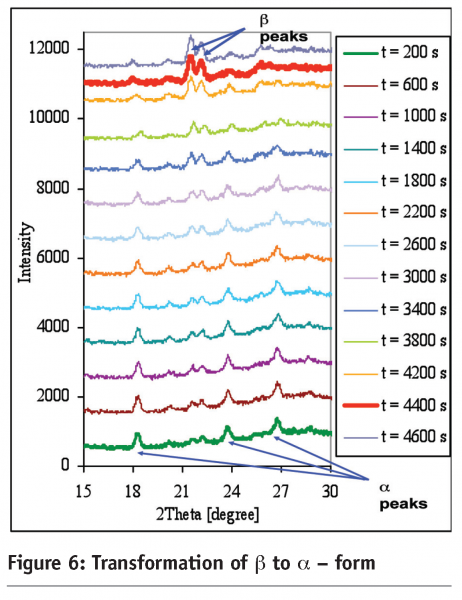

Figure 6 shows the polymorphic data as the form changes from the α- to the β-form where the XRD data is processed by SPCA.
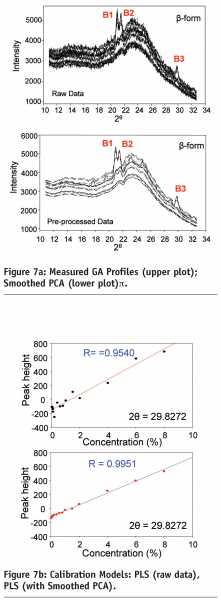

Figure 7a shows that the raw XRD profiles are quite noisy. The relationship between the β-form GA concentrations and the peak heights at peak B3 of the raw XRD profiles (upper plot in Figure 7a) significantly deviates from a linear model, especially for the samples with lower β-form GA concentrations. The SPCA processed XRD profiles are shown in the lower plot of Figure 7a. Compared with the raw XRD profiles, the SPCA processed profiles have much higher signal-to-noise ratio.
Figure 7b (upper plot) shows the PLS relationship based on the original XRD data monitored from the LGA slurries whist the lower plot shows the improvements gained after using smoothed PCA. Compared with other signal processing methods such as the wavelet transformation, SPCA achieves lower detection limit of the β-form of GA with concentrations as low as 0.4% by weight being detected from GA-methanol slurries comprising mixtures of both a and β forms10.


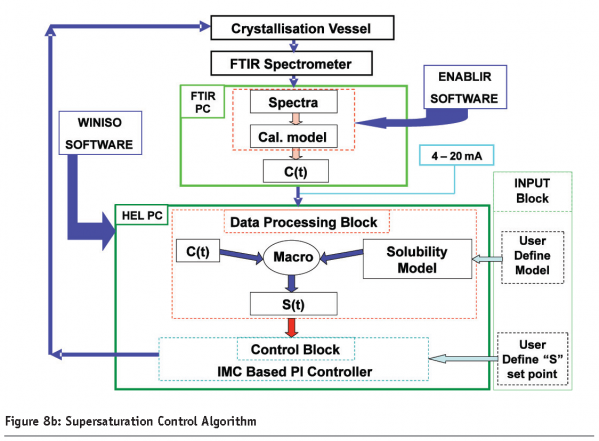

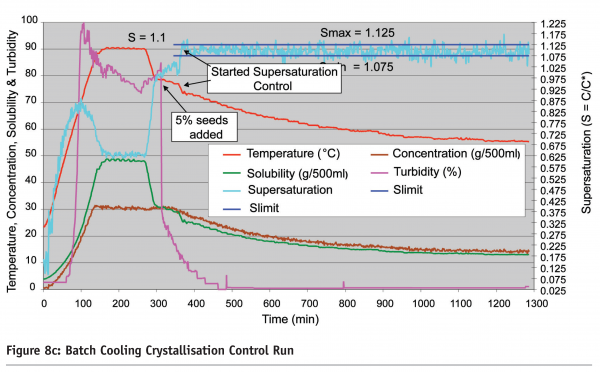

An industrial pilot plant application16 of supersaturation monitoring and control using ATR-FTIR spectroscopy coupled with smoothed principal components analysis is shown in Figure 8 on page 90 where an ATR-FTIR based supersaturation control system was applied to a 250 Ll pilot cooling crystallization process. Figure 8a shows the PAT instrumentation installed on the pilot pant which included the ATR- FTIR spectroscopic sensor, turbidity, pH and temperature measurement, XRD and on-line crystal size distribution using a Malvern alpha-sizer. Figure 8b on page 90 shows the supersaturation model-based PI control strategy based on on-line real time FTIR measurements and Figure 8c on page 91 shows a typical supersaturation control run.
Challenges for PAT in Closed Loop Process Control
There are some major challenges in taking PAT into closed loop process control. For example, real-time management of process and spectroscopic data and real time robust fit-for-purpose ‘transferable’ calibration models. What is the impact of process control variables, e.g. temperature on spectroscopic calibrations on control loop performance; no control system is going to control a spectrum of several hundred simultaneous values and it may be that groups of individual wavelengths may provide particular chemical or biological information for reaction monitoring and closed loop process control, so what is important? Is there is a robust fit-for-purpose calibration model to infer specific product properties? What is the impact of process conditions on optical light scattering and hence spectroscopic calibrations on control loop performance? What data quality monitoring approaches are needed to strengthen the integrity and robustness of on-line models? How will real-time data be managed including pre-processing, outlier detection, and outlier isolation, the recording of uncertainty associated with data to ensure complete traceability of all actions deployed by either a closed loop control system or by an operator – all within a validated environment? Such procedures will be essential to underpin the credibility for any algorithms and software used for PAT applications and “real time release”.
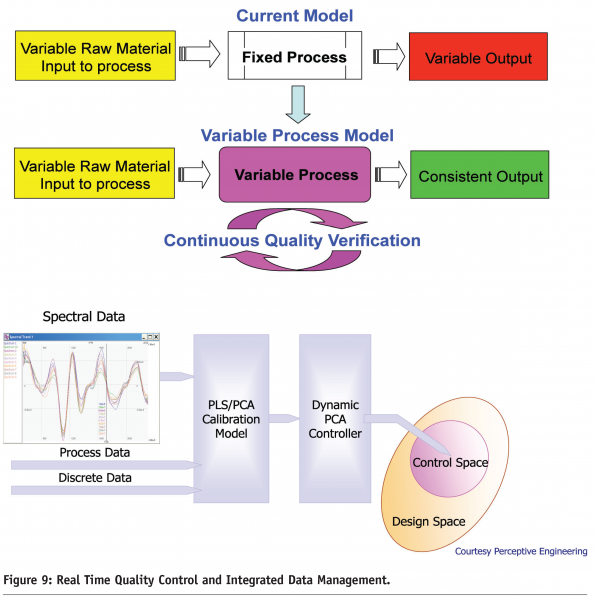

PAT is part of a tool box to optimise the way pharmaceuticals are manufactured, provide greater understanding of the process and what to control and potentially provide a means to control critical attributes by monitoring and adjusting critical parameters in real time. All this will help to provide some of the ability to reduce the risk of process variability effecting process capability and product quality. Figure 9 on page 91 shows one approach to meeting the demands of PAT based closed loop control. The upper plot shows the present approach to process manufacturing ‘fixed process model’, where the final product quality is highly subject to process variability across a large range of unit operations, all with variability issues. This can be compared with a future view where the ‘variable process model’ is PAT monitored and controlled in order to consistently meet the desired quality output. The lower plot shows a schematic industrial view of PAT based control loop and its relationship to the design space and the process control space.
Conclusions
Real time chemometrics and the incorporation of PAT Sensors into real time process control with PAT devices capable of 1-2 second or sub-second measurement rates and real-time control based on a PAT measurements is becoming a reality with increasing richness of measurements, not just a single data point per sample or a single calibration, but a vector of data per sample. In real time applications, no control system is going to control a spectrum of several hundred simultaneous values. So what is important? Are there particular features/segments of the spectrum of interest? Should the scores of the PCA/PLS calibration model be controlled? Sensor calibration models can give real time inference of final product property through the production process; can or should the scores of a PCA/PLS model be used for closed loop control? Can we integrate – combine, through data fusion, spectroscopic wavelengths and process data, e.g. Wong et al, 200818 etc. On-line spectroscopic methods coupled with closed loop process control will be both critical and useful tools for enhanced process understading, process transfer and comparability – process systems engineering has much to offer the PAT initiative.
Acknowledgements
The authors acknowledge the financial support of the EPSRC grant GR/R19366/01 (KNOW-HOW) and GR/R43853/01 (Chemicals Behaving Badly II). The authors also gratefully acknowledge the permission from the Journals of Analytical Chemistry (References 11, 12, and 16) and The Analyst (Reference 14) for allowing reproduction of selected figures and related text. An earlier version of this paper was previously presented at the 18th European Symposium on Computer Aided Process Engineering – ESCAPE 18 (Reference 19).
References
- FDA, PAT – A Framework for Innovative Pharmaceutical Development, Manufacturing, and Quality Assurance, 2004 http://www.fda.gov/cder/guidance
- The EU provides 32% of the worlds chemicals manufacturing through some 25,000 enterprises of which 98% are SMEs which account for 45% of the sectors ‘added value’ and 46% of all employees are in SMEs. Refs: [i] A European Technology Platform for Sustainable Chemistry – The Vision for 2025 and beyond, SUSCHEM report, February 2005. [ii] Horizon 2015: Perspectives of the European Chemical Industry, CEFIC Report, March 2004. [iii] Profile of Chemical Industry, CEFIC Report, December 2006.
- FT: Fourier Transform; WT: Wavelet Transform; CPDS: Continuous Piecewise Direct Standardization;: PSR: Penalized Signal Regression; ICS: Individual Contribution Standardization; DS: Direct Standardization; PDS: Piecewise DS; MSC: Multiplicative Signal Correction; ISC: Inverted Signal Correction; EMSC: Extended MSC; EISC: Extended ISC; LSS: Loading Space Standardization; OPLEC: Optical Path Length Estimation and Correction
- Wülfert, F, W. Th. Kok; O . E. de Noord; A. K. Smilde, (2000) Linear techniques to correct for temperature-induced spectral variation in multivariate calibration. Chemom. Intell. Lab. Syst. 51, 189-200.
- Wang, Y, D. Veltkamp, D. J.; Kowalski, B. R. Anal. Chem. (1991), Multivariate instrument standardization, 63, 2750-2756.
- Wang, Y, Y., B. R. Kowalski, (1993) Temperature-compensating calibration transfer for near-infrared filter instruments. Anal. Chem. 65, 1301-1303.
- Wülfert, F, Kok, W.T.; Noord, O.E. de; Smilde A.K., (2000) Correction of Temperature-induced Spectral Variation by Continuous Piecewise Direct Standardization, Anal. Chem. 72, 1639-1644.
- Eilers, P. H. C.; Marx, B. D. (2003) Multivariate Calibration with Temperature Interaction Using Two-dimensional Penalized Signal Regression, Chemom. Intell. Lab. Syst. 66, 159-174.
- Chen, Z.P, Morris, J.; Martin, E., (2004),Modeling temperature-induced spectral variations in chemical process monitoring, IFAC Dycops.
- Liang, Y, Kvalheim, O. M.; Manne, R. (1993), Chemom. Intell. Lab. Syst., White, grey and black multicomponent systems – A classification of mixture problems and methods for their quantitative analysis, 18, 235-250.
- Chen, Z.P, Morris, J.; Martin, E., (2005), Correction of temperature-induced spectral variations by loading space standardization, Anal. Chem. 77, 1376-1384
- Chen, Z.P, Morris, J.; Martin, E., (2006), Extracting chemical information from spectral data with multiplicative light scattering effects by optical path-length estimation and correction, Anal. Chem., 78, 7674-7681.
- Chen, Z.P.; Fevotte, G.; Caillet, A. Littlejohn, D.; Morris, J. (2008), An advanced calibration strategy for in-situ quantitative monitoring of solvent-mediated phase transition processes using FT-Raman spectroscopy, Anal. Chem., 80, 6658–6665
- Chen, Z.P. and Morris, J., (2008), Improving the linearity of spectroscopic data subjected to fluctuations in external variables by the extended loading space standardization, The Analyst, 133, 914-922
- Chen, Z.P.; Morris, J.; Borissova, A.; Khan, S.; Mahmud, T.; Penchev, R.; Roberts, K.J., (2008) On-line Monitoring of Batch Cooling Crystallisation of Organic Compounds using ATR-FTIR Spectroscopy Coupled with an Advanced Calibration Method, Chemom. Intell. Lab. Syst., revised
- Chen, Z.P, Morris, J.; Martin, E.; Hammond, R.B.; Lai, X.J.; Ma, C.Y.; Purba, E.; Roberts, K.J.; Bytheway, R., (2005), Enhancing the signal to noise ratio of x-ray diffraction spectra by smoothed principal component analysis, Anal. Chem. 77, 6563-6570
- Chen, Z.P, J. Morris, A. Borissova, S. Khan, T. Mahmud, R. Penchev and K.J. Roberts, (2008), On-line Monitoring of Batch Cooling Crystallisation of Organic Compounds using ATR-FTIR Spectroscopy Coupled with an Advanced Calibration Method, under review Crystal Growth & Design.
- Wong, C.W, R. Escott, E. Martin and J. Morris, (2008), The Integration of Spectroscopic and Process Data for Enhanced Process Performance Monitoring, Can. J. Chem. Eng. 86:905–923.
- Chen, Z.P., D. Lovett and J. Morris, (2008), Process Analytical Technologies (PAT) – the Impact for Process Systems Engineering, 18th European Symposium on Computer Aided Process Engineering – ESCAPE 18, June, Lyon, Eds. Bertrand Braunschweig and Xavier Joulia.


