

Lyophilization: cycle robustness and process tolerances, transfer and scale up
Posted: 19 June 2008 | | 2 comments
During the past 10-15 years, close attention has been paid to the development of optimal lyophilization cycles for different types of pharmaceuticals1-4. Recent advances in process control, such as the Smart Freeze-DryerTM technology or similar approaches, [5-7] make cycle development a routine procedure. The attention of many researchers has shifted to the aspects of cycle transfer and scale up that still require significant investment in understanding the differences in lyophilization processes between laboratory and commercial dryers [8-14].
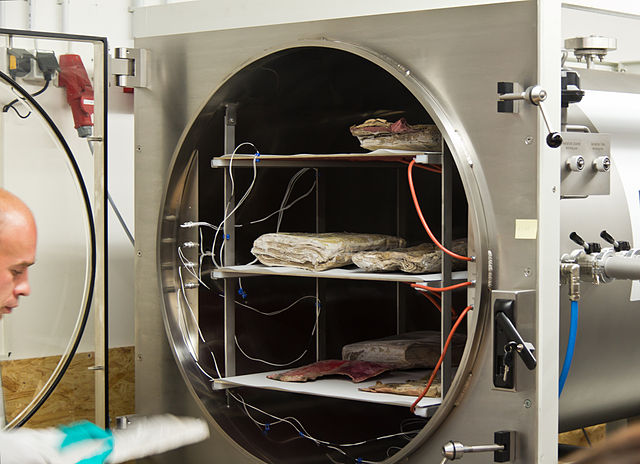
Lyophilisation freeze drying (© Raimond Spekking / CC BY-SA 3.0 via Wikimedia Commons)
Conducting numerous experiments in an attempt to demonstrate that a laboratory cycle is not only optimal but also robust, requires significant material and time investment. Mathematical modelling of lyophilization processes proved to be a very useful tool, not only for cycle development[15-19] but also for cycle transfer and scale up[11,14]. The same mathematical approach (as discussed in experiment[14]) was applied to the process tolerances design and estimation of cycle robustness in regard to the product temperature.
Primary drying model
A simple steady state model was utilised in a primary drying stage evaluation. Calculations were made for the single glass container (vial) similar to the process described in the following paper20. The model is based on the assumption that all transferred heat is used for the sublimation. Heat and mass balance at the sublimation surface for each primary drying segment are described by Equation 1.
Equation 1
Where Sin and Sout are inner and outer surface areas of the vials; ΔHS is a latent heat of sublimation of water; PSubl and PChamber are pressure over the sublimation front and chamber pressure respectively; TShelf and Tproduct are the shelf and product temperatures respectively; R(h)i is the cake resistance at dry layer height hi. Tproduct is the product temperature at the bottom of the vial (presumably the highest temperature in the frozen layer). Equation 2 is used to estimate the product temperature at the sublimation surface for each given time segment i.
Equation 2
Where hi is the height of frozen and dry layers and λfrozen is a heat conduction coefficient.
Microsoft® Excel Solver was used to calculate the product temperature at each time segment balancing Equation 1. Vials heat transfer coefficients KV(P) for laboratory and large-scale dryers were measured in experiment14. Product cake resistance R(h)i was estimated for the different products using the same model and known product temperature profiles. The calculations (using the model based on Equations 1 and 2) result in a product temperature profile as a function of shelf temperature and chamber pressure. The model was validated on laboratory and pilot scale dryers14.
Factors that affect cycle transfer and scale up
One would hope that a lyophilization cycle would be as well controlled at commercial scale as it is currently performed on most advanced laboratory dryers. From our experience, the variability of process parameters on laboratory dryers is very low and product temperature profiles using the same cycle are normally very reproducible. It is interesting that with an increased number of protein-based molecules entering product development, the variability of product properties is reduced due to better primary molecule design. This is true for the most popular protein therapeutics currently developed in biotechnology industry: antibodies. Therefore, it is not surprising that the similar primary molecule properties (in regard to a lyophilized dosage form), in many cases results in similar formulations. Thus, lyophilization process design and formulation is increasingly becoming a platform approach exercise.
However, lyophilization process transfer and scale up is very difficult to platform. In most cases, this is due to the fact that in large pharmaceutical and biotechnology companies, commercial manufacturing is often performed in multiple locations in collaboration with numerous contract manufacturing organisations. Process transfer remains very complicated, in part due to differences in scale up factors. There are numerous factors that effect lyophilization process transfer; many have been identified and discussed in the literature8-14. We believe that among the most important factors are the differences in heat transfer between laboratory and commercial dryers, differences in resistance to mass flow during sublimation, cake resistance inequality between laboratory and commercial freeze-dried materials and variability in process control.
Differences in heat transfer between commercial and laboratory dryers
It has been known for years that edge effect is rather significant for laboratory scale dryers, especially those with a Plexiglas door. Very elegant studies have demonstrated that this is mostly due to heat radiation effects from the door21. The authors21 also showed that radiation effects contribute more to the total heat flux with a decrease in shelf temperature.
One can reasonably assume that an edge effect is more pronounced in the laboratory dryers since the commercial dryers are better insulated. Therefore, the edge vials in laboratory dryers should, at least in theory, represent a ‘worst case condition’. There are no general guidelines on the impact of the edge effect on laboratory dryers in comparison to commercial lyophilizers. This is due to the fact that laboratory dryers generally operate in non-controlled conditions; therefore, radiation contribution to the total heat flux varies significantly from dryer to dryer and could also depend on environmental conditions (season, day time etc). With respect to the centre vials, there is a general consensus that the heat transfer coefficient for the centre vials should be similar to that within commercial dryers. Good correlation between sublimation rates in laboratory (Lyostar™) and commercial (Edwards) dryers has been shown for the vials positioned on the centre of shelf22. However, there are some exceptions to this general rule. We have found for a relatively old pilot lyophilizer that vial heat transfer coefficients are 20-30 % lower than for the laboratory dryer including the centre vials14. Sublimation tests performed with bottomless trays, (similar to those in tests23), have shown that heat transfer through the shelf is less efficient for the pilot dryer in comparison to the laboratory dryer (Figure1).

A slope of the line in Figure 1 is proportional to the shelf heat transfer coefficient and is indicative of effectiveness of heat transfer through the shelf itself. Since the shelf surface temperature, not the inlet temperature normally referred to as the shelf temperature, determines the heat transfer to the product. Data in Figure 1 suggests that cycle set points for this particular pilot dryer need to be adjusted to provide the same product temperature profile as was created in the development dryer. It should be mentioned that data shown in Figure 1 is unique rather than common. Two recently examined commercial scale dryers from two different companies exhibited a similar heat transfer coefficient as laboratory dryers (data not shown). However, one should be aware about possible differences in heat transfer if a lyophilization cycle developed at laboratory scale is planned be transferred to the contractor site which utilises relatively old lyophilization chambers.
Differences in resistance to the mass flux during sublimation
Scientists and engineers involved in lyophilization process transfer are well aware of the differences in mass transfer between laboratory and commercial dryers. Sometimes, a lyophilization cycle developed on a laboratory dryer needs to be ‘fitted’ to the commercial dryer due to problems with the pressure or condenser temperature control. This is especially true for old commercial dryers designed with a small, long pipe between the condenser and chamber. In some cases, commercial lyophilizers perform well at sub maximum dryer load but fail to operate according to the validated protocol if batch size was significantly increased. Sublimation tests14,23 could provide insights in the capability of a particular dryer to withstand a certain sublimation rate. They can also aid in identification of the maximum sublimation rates that produce so called ‘chocked flow’24.
Differences in cake resistance between materials lyophilized in laboratory and commercial product
It is well recognised that a higher degree of supercooling due to the low particulate manufacturing environment may increase dry product resistance by decreasing mean pore size9,10. For example, a ten degree difference in ice nucleation temperature could result in a two-fold difference in specific surface area25 that translates into two-fold higher resistance. It has been shown that annealing could minimise the differences in cake resistance caused by variability in ice nucleation temperature26.
For highly viscous solutions however, a comparable product temperature profile during initial freezing and following the annealing step does not ensure a similar cake resistance in commercial scale conditions as compared to laboratory conditions. Figure 2 demonstrates the differences in cake resistance for material lyophilized in laboratory dryer (blue) and material manufactured in a pilot dryer (pink).

The data in Figure 2 suggests that for highly viscous solutions (proteins are among them) additional annealing time on a commercial scale might be required to match the resistance of material made in a laboratory scale freeze dryer. Therefore, low particulates GMP conditions could lead to formation of unique dry product structure that needs to be accounted for during lyophilization process scale up.
Differences in process control
The most common and probably most important difference between commercial and laboratory dryers is the difference in pressure control. Usually, commercial dryers are programmed for larger pressure tolerances than laboratory dryers to accommodate possible deviations during manufacturing. Therefore, commercial processes could be performed at notably different pressures than laboratory processes even though the limits are within the validated range. Some dryers (commercial or laboratory) use Pirani pressure sensors to control the chamber pressure. Therefore, the correction to the absolute pressure should be made during the process transfer activities. Some dryers do not have a PID (Proportional Integral Derivative) pressure control or any pressure control. This complicates the cycle transfer especially if a similar product temperature profile is desired for both laboratory and commercial samples. Another common difference in process control is the condenser temperature, which is normally much lower in laboratory dryers, even at no load conditions. Lower condenser temperature usually results in lower moisture content of the final lyophilized products. This may be a reason why commercial products normally have slightly higher water content compared to the material produced on laboratory dryer even when the same process parameters are used. Another common difference between commercial and laboratory processes is the lyophilizer load. Larger loads in commercial dryers result in higher condenser temperature, which contributes to the higher moisture content in the final lyophilized product. We have not observed significant differences in shelf temperature control between commercial and laboratory lyophilizers, but it is a common observation that shelf temperature variability from the set point is larger in commercial dryers when compared to those in a laboratory dryer.
The number of differences between commercial and laboratory scale processes dictates the development of some sort of strategy for transfer and scale up activities. This strategy can be summarised as a set of ‘principles’ we have recently developed and began to follow in order to minimise time and resources for implementation of lyophilization cycle on a commercial scale.
Principles of lyophilization cycle scale up
- Perform thorough lyophilizer characterisation in addition to the common IQ/OQ on the ‘dry and empty dryer’ 14,23. Establish the relationship or ‘link’ between laboratory, pilot and commercial lyophilizers, so that any cycle could be easily transferred from location to location giving flexibility from the commercial perspective
- During scale up activities, keep the product temperature profile in the commercial lyophilizer similar to that in the development dryer. A similar product temperature profile with the same thermal history should, at least in theory, provide the same product characteristics and, presumably, the same stability profile9,10,12. Utilise a mathematical model to design the most economical cycle taking into account process variability (allowed parameters tolerances) and lyophilizer capacity
- Perform a lyophilization cycle robustness study to support cycle deviations during manufacturing. The product can be stressed well above the critical temperatures to cover unexpected and unpredictable process deviations. We found that robustness experiments can be performed sufficiently at laboratory scale. The laboratory scale robustness study can be used to assess the effect of process deviations on product quality if the link between two lyophilizers is firmly established
Lyophilization cycle tolerances choice
When a lyophilization cycle on a development dryer has been finalised and the manufacturing site has been chosen, a tech transfer team performs a gap analysis and plans scale up activities. Typically, several test runs have been performed at commercial scale in order to fit the development cycle to the given production dryer. Buffers, some sort of surrogate materials or a limited amount of active material (‘seeded runs’), are normally used during the engineering runs. Such transfer activities are very expensive and also time-consuming. Moreover, the number of test runs at commercial scale could significantly increase if one decided to establish reasonable process tolerances or, following modern terminology, design space27. The amount of experimental work, however, could be significantly decreased if:
- The characteristics of the commercial dryer are known (minimum controllable pressure as function of sublimation rate, condenser capacity, vial heat transfer coefficients, statistical information on pressure and shelf temperature deviations, etc)
- Product properties at commercial-scale are also known (degree of supercooling and cake resistance).
Using mathematical modelling and lyophilizer/product characteristics, one can evaluate and fit the development cycle to the given commercial or clinical dryer. As an example, we performed such an analysis for 5% sucrose, a formulation component commonly used in protein stabilisation.
The calculations were made for 2/4ml Schott tubing vials, of which the vial heat transfer coefficient KV(P) was directly measured in a pilot dryer for the centre and edge vials. Similarly to the 5-ml vials14, vials KV in a pilot dryer were 20-30% lower than in laboratory dryer due to insufficient heat transfer through the shelf (Figure1 on page 70). The edge vials, especially those that were in contact with the tray band and face the lyophilizer door, received up to two-fold more heat than the centre vials. The average cake resistance of pilot samples in GMP environment is 75% higher than that in laboratory as was determined from the product temperature profiles using the primary drying model. The model was validated on both laboratory and pilot scale showing good agreement between calculated and actual temperature profiles14. For the laboratory dryer, calculations performed for 5% sucrose show that product temperature at the end of primary drying should still be 1.8°C below the collapse temperature if the chamber pressure could be controlled at 50mT and the shelf temperature is -20°C (data not shown). The calculated duration of the primary drying step in a laboratory dryer is approximately 22 hours (for the 7mm cake height).
When the same process set point will be used in a pilot dryer, product temperature in the centre vials could exceed the collapse temperature for one hour (light blue, Figure 3). This is due to the fact that product cake resistance in GMP conditions is higher than at laboratory scale. Further, the collapse in the centre vials might not be as dramatic as for the edge vials. The pink line in Figure 3 shows that the temperature in the edge vials that face a lyophilizer door could quickly reach the collapse temperature and remain above that temperature for almost 14 hours. This is not an unusual situation during lyophilization cycle scale up. The most common solution to this problem is to decrease the shelf temperature (or pressure) to a safe level in order to keep the product temperature below the collapse temperature for both centre and edge vials. In our particular case, decreasing the shelf temperature to -27°C (keeping pressure at 50mT) should satisfy these conditions, even though the primary drying step becomes 42 hours long.
The reader should note that calculations were based on the assumption that process parameters (pressure and shelf temperature) are well controlled with almost zero tolerance. In manufacturing environments, however, this is not always the case, due to certain variations of shelf temperature and pressure around the set points. Process variability depends on many factors (type of control, reliability of dryer units, load etc) and is specific for each lyophilizer.

From our experience, each commercial or clinical site has its own acceptance criteria for lyophilization process parameters. In relatively old lyophilizers, shelf temperature and pressure are allowed to vary from their set point ±5°C and ±20mT, respectively. From the quality prospective, lyophilized material should have similar properties if manufactured within the validated range of process parameters or within the boundaries of design space27. In this particular example with 5% sucrose in a pilot dryer, one could assess a design space in which pressure could be between 30 and 70mT and shelf temperature during primary drying could be within the range from -22 to -32°C. Under extreme conditions during which the average pressure is 70mT and shelf temperature is -22°C, calculations show that both edge and centre vials product temperature will exceed the collapse temperature and will remain at the collapse conditions for 15.3 and 3.7 hours, respectively. In another extreme situation, when the shelf temperature is 5 degree below the set point and pressure is 30mT during primary drying, product temperature in the edge vial will remain well below the collapse temperature (pink line, Figure 4).
However, primary drying would not be complete for the centre vials. If the secondary drying ramp begins at a programmed step duration of 42 hours, the product at the bottom of the vial might collapse (blue line, Figure 4).

Further analysis of the design space extremes shows that the target shelf temperature should be decreased to -32.5°C (while keeping the pressure at 50mT) to produce conditions at which even large deviations from the set points (±5°C for the temperature and ± 20mT for the pressure) will not affect the product. However, the duration of primary drying must be extended to almost 91 hours (for Tsh= -37.5°C and P=30mT).
One can see that implicating wide process tolerances could result in a significant increase in primary drying time (from 42 to 91 hours in this hypothetical case). It should be noted that the variability of process parameters on modern commercial dryers is much less, as discussed in this example. For many recently installed dryers, the ±3°C deviation of shelf temperature and ±10-mT variation of chamber pressure are sustainable. Still, in order to keep the product temperature below the collapse even within a more narrow design space (±3°C /±10-mT), the shelf temperature needs to be lowered to -30°C, thus increasing the primary drying time to 63.6 hours as compared to 42 hours cycle with zero tolerance. The example we discussed above is applicable to all products with the low collapse temperature. For products with a high collapse temperature, the scale up factor as well as process parameter variability have lesser effects on product temperature and drying time. Similar analysis, performed for a 50mg/ml protein formulation, showed that the combination of scale up factors and maximum process variability (±5°C /±20-mT) should result in 45 % increase of primary drying time.
To summarise, scale up and transfer of lyophilization processes are very complicated procedures and require significant experimental and organisational efforts if information about commercial dryers is limited. With additional dryer information, normally gathered through the intensive lyophilizer characterisation, it has become, in part, a computer exercise. Of course, the actual experiments on a commercial scale still need to confirm the scalability of the transferred cycle with regards to the product properties but computer analysis could help to minimise the number of cycles. We believe that moderate process parameter variability (±3°C /±10-mT) could be acceptable for most current commercial dryers. However, the efforts of lyophilizer manufacturers in decreasing the variability of process parameters are certainly very welcome from the economical and quality points of view.
Cycle robustness aspects
Performing a lyophilization cycle within the validated boundaries of design space should ensure the manufacture of a product that meets all acceptance criteria. To prove this, however, one should conduct the robustness study with the material of interest at extreme conditions that are within the acceptable range of process parameter variability (tolerances). Previously, we have conducted lyophilization cycle robustness studies in which each parameter (pressure, shelf temperature, step durations) were changed while keeping the remainder constant.
Numerous robustness experiments proved to be extremely helpful in responding to manufacturing cycle deviations when stability data from the lyophilization cycle robustness study were used as supportive information to assist in assessing the quality of a commercial batch. However, it is nearly impossible to predict all possible deviations during commercial manufacturing. Lets imagine that during commercial lyophilization cycle, some of process parameters (pressure or shelf temperature or both) slightly exceed the design space. We can either reject the batch or perform extensive testing to confirm that product quality is still within specification. Another approach is to characterise the conditions at which the product starts to fail. For completely amorphous products, the point of failure is likely a macroscopic collapse of the lyophilized cake, which has been linked in the literature to higher moisture resulting in product instability, prolonged reconstitution and lack of cake elegance28. It is not clear if macroscopic collapse of amorphous freeze-dried material could directly result in accelerated product degradation, especially when a product is dried to the validated level of residual moisture. However, it is known that collapse phenomenon during lyophilization is a very random process and one would have a difficult time validating the degree of collapse in commercial products.
It is easier, in the case of amorphous material, to simply lyophilize the product at temperatures below the collapse temperature. For partially crystalline/partially amorphous materials, lyophilization above the collapse temperature does not necessarily result in a product failure. It has been shown that, for two different proteins, freeze-drying above the collapse temperature results in an elegant cake with acceptable product stability29,30. How far above the collapse temperature can one freeze-dry until the product begins to fail? We tried to answer this question by conducting a series of experiments in which product was lyophilized at temperatures above and below the collapse temperature (Figure 5).

The most aggressive lyophilization cycle was performed at temperatures close to but still below the melting point of the bulking agent. Since thermocouple placement usually introduces some degree of uncertainty, the calculated product temperature profiles were overlaid in Figure 5 for a better comparison lyophilization cycles. The cake appearance, reconstitution time and residual moisture were similar for the materials from all three runs.
The degradation rates of collapsed samples were lower when compared to the material freeze-dried below the collapse temperature. This finding, along with the data from papers29,30, expands our knowledge in regard to freeze-drying above the critical temperatures. As long as less than 82% of material for the protein in Figure 5 was accidentally collapsed during the process deviation, the stability profile should be similar to the control and product batch can be released. Strictly speaking, process parameters (shelf temperature or pressure) could randomly exceed the range specified in a batch record but the product could have a reduced degree of collapse compared to the most aggressive cycle (the robustness cycle, in our case). The advantage of this robustness approach is that only a limited number of lyophilization cycles (three for the protein in Figure 5) are needed to cover the numerous combinations of unexpected process deviations that might occur during commercial manufacturing. The acceptance criteria in this approach are not the shelf temperature or pressure but attributes of the product itself.
Conclusions
In conclusion, we would like to emphasise that while lyophilization cycle development and optimisation become a more routine operation with the introduction a Smart Freeze-DryerTM technology, process scale up is still a very complicated subject. Extensive mathematical modelling of freeze-drying process that ‘Smart freeze-drying’ is based on this technology in optimise the lyophilization process within a single cycle. Similarly, it should be done during process scale up and transfer. However, in order to apply modelling to the scale up process, extensive lyophilizer characterisation needs to be performed. We demonstrated that the choice of process tolerances is a very important part of process transfer and should not be neglected. It has been shown that accepting a wide range of process parameters results in a long primary drying step. To address unpredicted deviations during commercial manufacturing, the product could be stressed beyond the critical temperature developing the stability profile for the ’worst case scenario’. Using these data as a negative control one can significantly simplify the investigation process.
References
- G.D.J Adams and J.R. Ramsay: Optimizing the lyophilization cycle and the consequences of collapse on the pharmaceutical acceptability of Erwinia L-Asparaginase. Journal of Pharmaceutical Sciences, volume 8606, issue 12, (1996).
- Elena Ronzi, Antonio Capolongo, Giorgio Rovero, Enzo Bucci, Sara Mondini and Anna Falbo: Optimization of a freeze-drying process of high purity Factor VIII and Factor IX concentrates. Chemical Engineering and Processing, volume 42, issue 10, pp. 751-757, (2003).
- Byeong S. Chang and Sugunakar Y. Patro: Freeze-drying process development for protein pharmaceuticals. Biotechnology: Pharmaceutical Aspects, issue 2, pp.113-138, (2004).
- X. Tang and M. Pikal: Design of freeze-drying processes for pharmaceuticals: practical advice, Pharmaceutical research, volume 21, issue 2, (2004).
- X. Tang, S. Nail and M. Pikal: Freeze-drying process design by manometric temperature measurement: design of a Smart freeze-dryer. Pharmaceutical Research, volume 22, issue 4, pp. 685-700, (2005).
- Henning Gieseler, T. Kramer and M. Pikal: Use of manometric temperature measurement (MTM) and SMART freeze dryer technology for development of an optimized freeze-drying cycle. Journal of Pharmaceutical Sciences, volume 96, issue 12, pp. 3402-3418, (2007).
- P. Chouvenc, S. Vessot, J. Andrieu and P. Vacus: Optimization of the freeze-drying cycle: adaptation of the pressure rise analysis model to non-instantaneous isolation valves. Journal of Pharmaceutical Science and Technology, volume 59, issue 5, pp. 298-309, (2005).
- E. Trappler: Scale-up strategy for a lyophilization process. American Pharmaceutical Review, volume 4, pp. 55-60, (2001).
- T. Jennings: Transferring the lyophilization process from one freeze-dryer to another, American Pharmaceutical Review, volume 5, issue 1, pp. 34-42 (2002).
- S. Rambhatla and M. Pikal: Heat and mass transfer issues in freeze-drying process development. Lyophilization of Biopharmaceuticals, edited by H. Constantino and M. Pikal. AAPS press, pp. 75-109, (2004).
- S. Tsinontides, P. Rajniak, D. Pham, W. Hunke, J. Placek and S. Reynolds: Freeze drying-principles and practice for successful scale-up to manufacturing. International Journal of Pharmaceutics, pp. 1-16, (2004).
- F. Jameel and M. Paranandi: Critical considerations in the transfer and validation of a lyophilization process. American Pharmaceutical Review, volume 9, issue 3, pp. 53-55, (2006).
- S. Sane and C. Hsu: Strategies for successful lyophilization process scale up. American Pharmaceutical Review, volume 10, issue 1, pp. 132-136, (2007).
- S. Tchessalov, D. Dixon and N. Warne: Principles of lyophilization cycle scale up. American Pharmaceutical Review, volume 10, issue 3, pp. 88-92, (2007).
- A. Liapis and R. Bruttini: A theory for the primary and secondary drying stages of the freeze drying of pharmaceutical crystalline and amorphous solutes: comparison between experimental data and theory. Sep.Technol, issue 4, pp. 144-155, (1994).
- M.J. Pikal, S. Cardon, Chandan Bhugra, F. Jameel, S. Rambhatla, W.J. Mascarenhas and H.U. Akay: The non steady state modeling of freeze drying: in-process product temperature and moisture content mapping and pharmaceutical product quality applications. Pharmaceutical Development and Technology, volume 10, issue 1, pp. 17-32, (2005).
- K.H. Gan, R. Bruttini, O.K. Crosser and A.I. Liapis: Freeze-drying of pharmaceuticals in vials on trays: effects of drying chamber wall temperature and tray side on lyophilization performance. International Journal of heat and mass transfer, edition 48, pp. 1675-1687, (2005).
- A.I. Liapis and R. Bruttini: Freeze-drying of pharmaceutical crystalline and amorphous solutes in vials: dynamic multi-dimensional models of the primary and secondary drying stages and qualitative features of the moving interface. Drying Technology, volume 13, issues 1 & 2, pp. 43-72, (1995).
- H. Sadikoglu, A.I. Liapis and O.K.Crosser: Optimal control of the primary and secondary drying stages of bulk solution freeze-drying in trays. Drying Technology, volume 16, issues 3-5, pp. 399-431, (1998).
- M. Pikal: Use of laboratory data in freeze-drying process design: heat and mass transfer coefficients and the computer simulation of freeze-drying. Journal of Parenteral Science and Technology, volume 39, issue 3, pp. 115-137, (1985).
- S. Rambhatla and M. Pikal: Heat and mass transfer scale-up issues during freeze – drying, I: A typical radiation and the edge vial effect. AAPS PharmSciTech, volume 4, issue 2, pp. 111-120, (2003).
- W. Kuu, L. Hardwick and M. Akers: Correlation of laboratory and production freeze drying cycles. International Journal of Pharmaceutics, issue 302, pp. 56-67, (2005).
- S. Rambhatla, S. Tchessalov and M. Pikal: Heat and mass transfer scale-up issues during freeze-drying, III: control and characterization of dryer differences via operational qualification tests. AAPS PharmSciTech, volume 7, issue 2, E1-E10, (2006).
- J. Searles: Observation and implication of sonic water vapor flow during freeze-drying. American Pharmaceutical Review, volume 8, issue 2, pp. 58-69, (2004).
- S. Rambhatla, R. Ramot, C. Bhugra and M. Pikal: Heat and mass transfer scale-up issues during freeze drying: II. Control and characterization of the degree of supercooling. AAPS PharmSciTech, volume 5, issue 4, article 58, pp. 1-9, (2004).
- J. Searles, J. Carpenter and T. Randolph: Annealing to optimize the Primary drying rate, Reduce Freezing-Induced Drying rate heterogeneity and determine Tg in Pharmaceutical Lyophilization. J.Pharm.Sci, volume 90, issue 7, pp. 872-8

could you please post this doc.
If you register you’ll be able to read the full article.