Applications of thermally stimulated current spectroscopy in pharmaceutical research
Posted: 10 July 2012 |
Thermally Stimulated Current Spectroscopy (TSC) is a new tool that can be used to analyse pharmaceutically important molecules. TSC studies are usually conducted to provide additional information about molecular mobility in the solid state, and as a result characterise phase transitions that are related to thermal transitions in the crystalline (polymorphic) and amorphous phases. The ability of TSC to probe molecular mobilities, previously undetected in materials, and link them to the stability of different phases has sparked immense scientific interest in this technique.
In the last 10 years, the pharmaceutical market has seen a significant decrease in approved new drug entities. Although many factors may be responsible for this trend, one of them is insufficient information / characterisation of a lead molecule. Consequently, new techniques are often applied in the pharmaceutical field with the simple goal to aid better selection of the drug candidate and dosage form.
Improving the performance of existing drug products is another goal that often requires comprehensive information about the properties of the drug molecules. In recent years, the physical sciences have made great progress towards understanding the properties of pharmaceutically important amorphous and polymorphic materials. The major focus of this work is to utilise the advantages that they may bring to formulated products (e.g. faster solubility of amorphous drugs compared to crystalline counterparts) and at the same time to overcome stability problems (e.g. tendency to recrystallise on storage) that they may demonstrate.
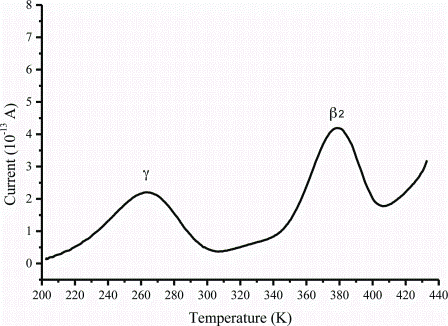

Figure 3: The global TSC spectrum of caffeine Form I
Thermally Stimulated Current Spectroscopy (TSC) is a new tool that can be used to analyse pharmaceutically important molecules. TSC studies are usually conducted to provide additional information about molecular mobility in the solid state, and as a result characterise phase transitions that are related to thermal transitions in the crystalline (polymorphic) and amorphous phases. The ability of TSC to probe molecular mobilities, previously undetected in materials, and link them to the stability of different phases has sparked immense scientific interest in this technique.
In the last 10 years, the pharmaceutical market has seen a significant decrease in approved new drug entities. Although many factors may be responsible for this trend, one of them is insufficient information / characterisation of a lead molecule. Consequently, new techniques are often applied in the pharmaceutical field with the simple goal to aid better selection of the drug candidate and dosage form.
Improving the performance of existing drug products is another goal that often requires comprehensive information about the properties of the drug molecules. In recent years, the physical sciences have made great progress towards understanding the properties of pharmaceutically important amorphous and polymorphic materials. The major focus of this work is to utilise the advantages that they may bring to formulated products (e.g. faster solubility of amorphous drugs compared to crystalline counterparts) and at the same time to overcome stability problems (e.g. tendency to recrystallise on storage) that they may demonstrate. Many techniques such as XRD, NMR, FTIR, Raman Spectroscopy and Thermal Analysis are widely used for the characterisation of molecular arrangements and their interactions. However, other techniques, for example Teraherz Pulsed Spectroscopy and TSC, have recently demon – strated their ability to provide complementary information and expand our current under – standing of drug properties.
Thermally Stimulated Current Spectroscopy belongs to the thermo-analytical group of techniques, implying that the response of the material (in this case an electrical response) is measured as the sample is subjected to a predetermined heating or cooling regime. In general, the TSC experiment consists of heating or cooling a sample to a starting temperature, which is the temperature at which the sample possesses greater molecular mobility. The sample is then subjected to an electric field (usually 0-500 V/mm) for a sufficiently long time period (approximately two minutes) in order to polarise (reorientate) the dipoles in the sample followed by cooling the sample to temperatures well below the starting temperature (usually down to -150°C) while still applying the electric field. At these low temperatures, the reoriented dipoles lack mobility. They have no energy to move so even with the removal of the electric field, the dipoles will remain in the polarised state (frozen in). At this point, the electric field is removed and the sample is heated to a temperature above the initial polarisation temperature. As the dipoles gain thermal energy, they begin to relax back to their original positions. It is during this process that a current is generated and measured using an extremely sensitive detector that can detect currents of 10-16A.
The result of TSC analysis is a global TSC peak(s) which contains information on all the relaxation processes (molecular mobilities) that can be detected. The relaxation processes can be defined as non-cooperative and cooperative wherein the former category denotes inde – pendent mobilities of a part, parts or group of molecules and the later represents domains of species which relax together in a cooperative manner. From a pharmaceutical perspective, cooperative movements that define important phase transitions (polymorphic and amorphous) are of a great interest. Furthermore, non-cooperative movements may indicate the possible mobility of side groups in a sample that may be precursors of the cooperative move – ments and therefore be related to the stability of the sample.
Cooperative relaxation processes can be further analysed (slicing the main transition into a series of simplified relaxation processes – thermal windowing) and relaxation times can be accurately calculated for each process obtained. The relaxation time describes the time that is required for a certain motion / mobility to be completed. Analysis of these peaks gives a temperature dependent relaxation time τ(T) that usually follows an Arrhenius relationship where τ0 is the pre-exponential factor, Ea is the activation energy, k is the Boltzmann constant and T is temperature.
The data analysis, outlined above, provides significant advantages when calculating the activation energy for a relaxation process such as the glass transition since it is much faster than other thermo-analytical methods and compared to other techniques doesn’t require any extrapolation of data and assumptions as the analysis of the sample takes place around the relaxation temperature.
The majority of published work on TSC is in the area of polymer science and semi – conductors, with only limited information being published on pharmaceutical and small organic molecules in general1,2. In the past 10 years, several research groups have been testing TSC as a tool in the pharmaceutical industry and a significant variety of applications have been developed4,5,6.
Polymers that are widely used as excipients in the pharmaceutical industry can be analysed by TSC. Analyses of PEGs3 has shown that TSC is an extremely sensitive technique for the detection of the glass transition (Tg) processes. Modulated temperature differential scanning calorimetry (MTDSC) has been the method of choice for the analysis of the amorphous phases in PEGs. MTDSC results have revealed the revealed the presence of two very weak glass transitions that could not be further investigated. TSC has also been used to examine glass transition phenomena in PEGs and the results clearly indicate the presence of two relaxation processes at the same temperatures as those identified by MTDSC. However, TSC was able to further characterise the relaxation processes and calculate the activation energies associated with both Tg processes. For a series of PEG samples, it has been found that the difference between the two Tg temperatures was 10 – 15 degrees (Table 1).
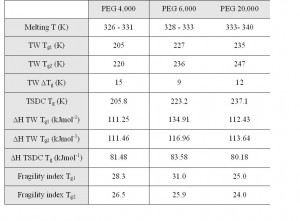

Table 1: Summary of TSC results for PEGs 4,000, 6,000 and 20,000. The results presented are mean values of two subsequent determinations
The lower glass transition (Tg1) was associated with a higher fragility index leading to the conclusion that lower glass transition temperature is due to irregularity in the spatial order of the end groups in molecules and is possibly due to process induced amorphicity. The higher glass transition temperature (Tg2) is due to structurally imbedded amorphous parts that involve the middle parts of the molecules which are therefore more fragile, difficult to age and convert into crystalline phase. These highly stable amorphous regions are responsible for the partially crystalline nature of PEG samples.
Furthermore, when examining the same grade (molecular weight) of PEG obtained from different suppliers it is evident3 that the production process has an important impact upon the ratio between crystalline and amorphous phase in the product. Data analysis has shown that crystallinity has a significant impact upon the glass transition temperature by shifting it to higher values. Highly crystalline PEG samples have small pockets of amorphous material in a predominantly crystalline matrix which leads to a more stable amorphous phase due to its limited mobility (since it is locked inside the crystalline phase). The TSC data thus suggests that the use of excipients without undertaking a thorough analysis and further processing may lead to batchto- batch variations.
As discussed earlier, it is generally accepted within the pharmaceutical field that incorp – oration of an amorphous drug or excipient in a formualtion may lead to product benefits; however, the associated stability problems have prevented their use. Detection, characterisation and quantification of the amorphous phase is one area where TSC may be an important technique. The basis of other techniques that are used to analyse amorphous materials is in the detection and quantification of the crystalline fraction. In TSC, detection and quantification depends upon the behaviour of both phases. It can be intuitively understood that the molecular mobility of the amorphous phase will be significantly higher than that of its crystalline counterpart. Therefore, it can be said that the TSC is a technique that is more sensitive to the presence of the amorphous phase compared to the crystalline. In addition, sensitivity is increased in molecules with a higher concentration of ‘mobile dipoles’. Many small organic molecules have a glass transition in the temperature range between -100 to 200°C, as a result, they may not be formulated easily in the amorphous form and they may demonstrate significant stability issues. TSC data obtained for Indometacin (Figure 1) suggest that even though the Tg value is above room temperature ~ 42°C, significant molecular mobility can be detected well below Tg (20°C) which may encourage crystallisation7. The TSC data demonstrate the significant width of the glass transition signal (20 – 30 degrees) in comparison to data obtained using other techniques.
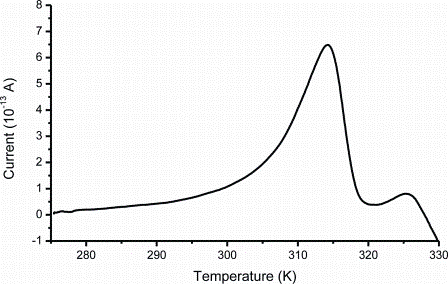

Figure 1: An example of a global TSC spectrum of amorphous Indometacin
For example, the DSC transition width is approximately five degrees which prompts the conclusion that molecular rearrangements involved in the glass transition process are initiated at significantly lower temperatures than those suggested by the DSC experimental data. This finding supports the rule of thumb used in the pharmaceutical industry that amorphous materials must be stored at temperatures at least 50 degrees below their Tg to prevent or reduce their conversion rates. Correlation between pre-exponential factors and activation energies provides information about homogeneity of the amorphous phase. If all the processes involved in the glass transition relaxation show a linear relationship between the pre-exponential factor and activation energy, the system is considered to be homogenous1 otherwise the system is described as non-homogenous.
Although the main use of TSC is to study relaxation processes such glass transition, it can also be used to study first order solid-solid transitions (polymorphic transitions). TSC has been used to distinguish between two different polymorphic forms and an amorphous phase6. In addition, researchers have used TSC to analyse new compounds and have been able to assign one of the relaxation process to the solid-solid transformation between polymorphs8. One comprehensive TSC investigation has been undertaken on polymorphs of caffeine.
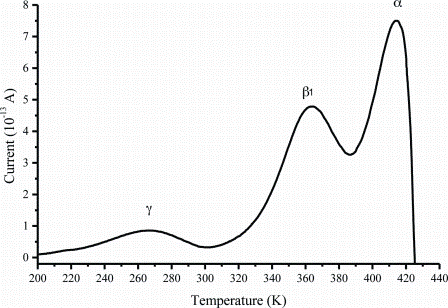

Figure 2: The global TSC spectrum of caffeine Form II
The TSC study revealed new, previously unknown relaxation processes that are responsible for the rearrangements of the molecules in the crystalline structure prior to the main relaxation process2,3. Caffeine exists in two enantiotropic polymorphic forms (form I and form II) implying that there is a clear transition point (temperature) at which one polymorph converts into the other. The TSC data (Figure 2 and Figure 3) indicate clear differences between the two forms.


Figure 3: The global TSC spectrum of caffeine Form I
Form I, which is unstable at room temperature, can be prepared and kept stable below the polymorphic transition for a very long time due to the presence of a high temperature relaxation process at about 107°C which is responsible for the molecular rearrangements underpinning the solid-solid transition. TSC has been further used to study the conversion kinetics of the unstable form of caffeine demonstrating its ability to deliver important kinetic information.
Batch-to-batch quality control has always been an important production factor. It is often the case that requests for batch-to-batch quality assessments are made by manufacturers. Therefore the majority of data obtained in that field of research is normally covered by secrecy agreements hence the data is not always publicly available. However, it has been proven that TSC is an excellent tool to detect batch-tobatch variations1. In some cases variations that could not be detected by any other technique could easily be detected with the TSC leading to the conclusion that small defects which cannot be seen by structural, mechanical and thermal probing are sensitive enough to the electric field to produce significant differences in response. Detailed analysis of some of the detected batch-to- batch variations indicates that microscopic irregularities (typical of a non-homogenous system) are responsible for the macroscopic performance of a material.
Some further examples demonstrate the capability of this technique to analyse process induced stresses in the final product, detect water mobility and therefore the stability of the final product produced under different conditions and most importantly detect, quantify and characterise very low fractions of amorphous content (less than two per cent).
Although significant valuable information can be gathered, sample preparations as well as experimental conditions9 play a vital role in obtaining good quality data. Therefore, considerable experimental care and an experienced researcher are often valuable assets in TSC analysis.
Summary
TSC provides valuable information about samples in the solid state that can promote better understanding of the interactions between materials, the homogeneity of phases and the stability of the analysed material. The great advantage of the TSC is its sensitivity in detecting visco-elastic transformations so that any molecular mobility in the samples can be easily detected. Therefore, in cases where the transition heat capacity change is small and as a result may not be detectable by thermal methods such as DSC, the only viable experi – mental technique would be the analysis of a sample using TSC provided the sample either has permanent or induced dipoles, which is the case for nearly all pharmaceutical molecules. Utilising all the advantages that TSC brings to pharmaceutical research will inexorably lead to better drug selection and enhanced dosage form design.
References
1. Craig, D.Q.M. and Reading, M. (2007) Thermal Analysis of Pharmaceuticals. CRC Press, Taylor and Francis Group, Boca Raton, FL, USA
2. Storey, R.A. and Ymen, I. (2011) Solid State Characterisation of Pharmaceuticals. Wiley, Chichester, West Sussex, UK
3. Antonijevic, M.D. (2005) The use of thermally stimulated current spectroscopy in the physical characterisation of pharmaceutical systems. PhD thesis, Queen’s University Belfast
4. Correia, N.T., Ramos, J.J.M., Descamps, M., Collins, G. (2001) Molecular mobility and fragility in indometacin: a thermally stimulated depolarization current study. Pharm. Res. 18, 1767–1774.
5. Galop, M., and Collins, G.L. (2001) Thermally stimulated currents observed in pharmaceutical products. Thermochim. Acta 367, 37–41.
6. Ikeda, Y., Hirayama, T., Terada, K., (2005) Application of thermally stimulated current measurement to the polymorphic characterization of drug substances. Thermochim. Acta 431, 195–199.
7. Hancock, B.C., Shamblin, S.L., Zografi, G. (1995) Molecular mobility of amorphous pharmaceutical solids below their glass transition temperatures. Pharm. Res. 10 (9): 1262-1267
8. Shmeis, R.A. and Krill, S.L. (2005) Weak solid–solid transitions in pharmaceutical crystalline solids detected via thermally stimulated current. Thermochim. Acta 427, 61–68.
9. Antonijevic, M.D., Craig, D.Q.M., Barker, S.A. (2008) The role of space charge formation in the generation of thermally stimulated current (TSC) spectroscopy data for a model amorphous drug system. International Journal of Pharma – ceutics 353, 8–14
About the author
Milan Antonijevic obtained his BSc (Hons) in Chemistry from the University of Belgrade in 1997. He then joined Hemofarm (STADA) where he worked for about four and a half years as a quality control analyst. He was awarded his PhD by the School of Pharmacy, Queen’s University Belfast, in 2005. Before moving to the University of Greenwich in 2006, he worked at the University of East Anglia.
Issue
Related topics
Research & Development (R&D), Spectroscopy, Thermal Analysis


