

RNA quality matters
Posted: 18 December 2012 |
RNA levels can be measured with very high specificity, sensitivity and accuracy with techniques such as real-time quantitative PCR (qPCR), microarray analysis and next generation sequencing. This makes messenger (m) RNAs and potentially microRNAs and other non-coding RNAs popular as biomarkers. But RNA is less stable and more dynamic than DNA, and assays are not always specific for RNA, so can we trust measured expression values?
A biomarker is a biological molecule found in blood, other body fluids or tissues, and is a sign of a normal or abnormal process, or of a condition or disease1. The biomarker may be used to see how well the body responds to a treatment for a disease or condition. Most popular and common molecular biomarkers are DNA, RNA and proteins. While proteins and in particular DNA are quite stable molecules and can be analysed for many properties such as sequence years after being removed from their natural biological environment, RNA molecules are not (Table 1). The extra 2’-hydroxyl group on the ribose in RNA that is absent in DNA is a nucleophile. It confers catalytic activity to ribozymes, but also makes RNA intrinsically unstable. In aqueous solution, RNA spontaneously degrades through self-cleavage catalysed by metal ions such as Mg2+, high (>9) or low (<2) pH, and temperature. EDTA or citrate is therefore typically added to RNA preserving solutions to chelate Mg2+2. Although RNA is more resistant to ultraviolet (UV) irradiation than DNA, it causes several types of damage including photochemical modification, cross - linking and oxidation.
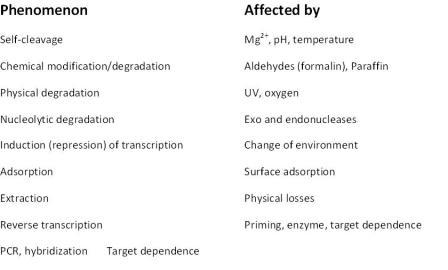
Table 1: Confounding effects influencing measured RNA levels
RNA levels can be measured with very high specificity, sensitivity and accuracy with techniques such as real-time quantitative PCR (qPCR), microarray analysis and next generation sequencing. This makes messenger (m) RNAs and potentially microRNAs and other non-coding RNAs popular as biomarkers. But RNA is less stable and more dynamic than DNA, and assays are not always specific for RNA, so can we trust measured expression values?
A biomarker is a biological molecule found in blood, other body fluids or tissues, and is a sign of a normal or abnormal process, or of a condition or disease1. The biomarker may be used to see how well the body responds to a treatment for a disease or condition. Most popular and common molecular biomarkers are DNA, RNA and proteins. While proteins and in particular DNA are quite stable molecules and can be analysed for many properties such as sequence years after being removed from their natural biological environment, RNA molecules are not (Table 1). The extra 2’-hydroxyl group on the ribose in RNA that is absent in DNA is a nucleophile. It confers catalytic activity to ribozymes, but also makes RNA intrinsically unstable. In aqueous solution, RNA spontaneously degrades through self-cleavage catalysed by metal ions such as Mg2+, high (>9) or low (<2) pH, and temperature. EDTA or citrate is therefore typically added to RNA preserving solutions to chelate Mg2+2. Although RNA is more resistant to ultraviolet (UV) irradiation than DNA, it causes several types of damage including photochemical modification, cross – linking and oxidation. RNA solutions should therefore be stored in dark or in vessels with lids that do not transmit UV light. Spectroscopic measurements with UV light may damage the RNA (and DNA), particularly under extensive illumination. In those cases, damage can be reduced by degassing the solution removing oxygen. RNA is also prone to degradation by RNases.
Table 1: Confounding effects influencing measured RNA levels
There are many types of RNases including 3’ and 5’ exonucleases as well as endonucleases. RNases are incredibly stable enzymes that withstand heat as they rapidly refold upon cooling; they are not even fully destroyed by autoclaving. Chaotropic salts such as guanidinium will temporarily inhibit RNases, but irreversible inhibition requires treatment with beta mercaptoethanol or DEPC (diethylpyrocarbonate), which reacts with the catalytic amino acid in the reactive site of the RNase molecule. Excess DEPC can then be inactivated by incubation at 37°C. It is also possible to inhibit RNases with RNase inhibitors. RNases are highly abundant and doing RNA work precautions should be taken such as using RNase free tips, tubes and solutions (including water), and using gloves that are changed regularly. Benchtop, pipettors and glassware used shall be decontaminated for RNA work. Interestingly, while RNases are a major compli – cation when working with classical bulk samples, it is usually not a problem in single cell expression profiling3, because most RNases are secreted and removed by careful washing of the cell before lysis. For the same reason, RNA in samples that have been freeze-thawed, which bursts the cells, are much more prone to degradation than sample with intact cells. Tissue specimens preserved for molecular analysis are often formalin-fixed and paraffin-embedded (FFPE). This procedure severely damages the RNA by modifying its basis and degrading the strands4. Details of the protocol used and also the length and conditions of storage have a profound effect of the RNA quality, which is often very poor with detrimental conse – quences on the precision of downstream mRNA measurements.
There are some strategies to reduce the effect of poor RNA quality on RT-qPCR analyses, including designing assays that produce short amplicons that are of equal size for the genes that shall be compared5. But the rule is, poor quality in, poor quality out. If RNA quality is poor there is little to do. It is therefore desirable to learn quality is poor before spending resources on analyses that will not be reliable. Novel methods for preservation of biological specimens that preserve morphology as well as RNA/DNA integrity have been developed6, but it will take time before these become routinely used, since most archival material that new samples are compared to is FFPE. The most common method to test RNA quality is by analysing the sample using electrophoresis separating the RNA present by length and analysing the length distribution. The strategy relies on ribosomal RNA, which is the dominant species, and in intact samples, two bands reflecting 18S and 28S RNA are expected. Most often, a microfluidic device is used, such as the Bioanalyzer7, Experion8 and the LabChip9, the more recent TapeStation10 or capillary electro phoresis in the QIAxel11 or the Fragment Analyzer12. The instruments generate an electropherogram, which is a digital repre – sentation of the electrophoretic pattern showing the appearance of fragments over time and can be analysed to calculate an RNA quality score. Best known is the RIN (RNA integrity number) obtained from the Bioanalyzer, which is a number between 1 and 10 calculated by identifying features in the electropherogram and assessing those using an algorithm developed based on a large training set of electropherograms recorded on RNAs of various origins and different degree of degradation13. An RIN of 10 reflects intact RNA and the lower the RIN, the more degraded the RNA is (Figure 1). Other instruments provide similar quality indexes, but because of independent learning algorithms, they are not really convertible. While the RIN or equivalent indexes sensitively reflect minor degradation of RNA, they are less robust for the assessment of highly degraded samples. One reason is that the degradation is not particularly reproducible and the analysed features in the electropherogram become much smaller and less distinct. Furthermore, as mentioned already, the electropherogram reflects the integrity of the dominant ribosomal RNA species that are chemically and structurally different from the mRNAs.

Figure 1A: Assessing RNA integrity. Top: electropherogram (top panel: intact RNA with RIN 10, middle panel: partially degraded RNA with RIN 5; bottom panel: heavily degraded RA with RIN 3). Middle: 3’/5’ strategy to assess mRNA
degradation; Bottom: long/short strategy to assess mRNA integrity
Ribosomal RNAs lack cap as well as A-tail and are folded into tight three dimensional structures, resulting in quite different molecular stability and sensitivity to various degrading agents from mRNAs. Hence, even if we could assess extensive degradation of ribosomal RNAs with high precision using capillary electrophoresis, it would still not reflect the integrity of the relevant mRNA species. Measurements of RIN or equivalent indexes should therefore be taken as a general indicator of sample quality, which is valuable, for example, to compare sampling, transport and storage conditions, rather than assessment of mRNA. mRNA quality for expression analysis is better assessed using molecular methods. The first method described was the 3’/5’ assay (Figure 1a and b)14. The mRNA is supposed to be exclusively reverse transcribed from the 3’-end using oligo(T) primer and the amount of transcript produced is measured by qPCR targeting a sequence close to the mRNA 3’-end and another sequence close to the mRNA 5’-end. Since reverse transcription is initiated at the mRNA 3’-end, amplification of the sequence at its 5’-end will be successful only if the mRNA was intact. Hence, comparing the amounts of the two amplicons produced should reflect the integrity of the targeted mRNA. The idea is excellent and the approach works well under some conditions, but we have found it fails to perform under many conditions where heavily degraded samples are analysed. Presumably, these samples contain fragments of DNA that can act as primers and, since RT is not particularly sensitive to the priming event15, the required exclusive priming at the 3’-end is not achieved.
A more recent approach is the short / long quality assay (Figure 1a and b)16. The cDNA is amplified producing two amplicons of different length using one common primer. If the mRNA was fragmented, higher yield is expected of the shorter amplicon. The cDNA can be produced with any priming strategy and the approach is therefore not sensitive to the presence of fragmented DNA in the sample.

Figure 1B: Assessing RNA integrity. Comparison of RQI from electropherograms measured with the BioRad Experion with 3’/5’ assay and long/short quality assay of TBP on mouse tissue degraded in room temperature
When biological samples are collected, the material is withdrawn from its natural environment and placed in a highly artificial surrounding. Unless the cells are immediately fixed, lysed or otherwise killed they will respond to the altered conditions. The response can be dramatic, with some genes being up or down regulated manifold and the changes can go on for days17. When collecting blood for gene expression analysis, for example, it is critical to immediately preserve the profiles using special collection tubes such as the PAXgene18 rather than in EDTA, which perturbs the expression. Recently, the European project SPIDIA19 performed proficiency ring trial to assess the variation in performance between European routine laboratories and to verify the influence of EDTA on measured mRNA levels20.
Although some technologies such as the northern blot, mRNA microarrays and Nanostring analyse mRNAs directly, the gold standard qPCR and next generation sequencing techniques require mRNA is converted to cDNA for analysis. This is done by reverse transcription, which is a reaction employing primers and reverse trans criptase. Three different priming strategies are used: gene specific primers, random sequence primers and oligothymidine primers, and the reverse transcriptase is typically an engineered variant of either Avian Myeloblastosis Virus (AMV) or Moloney Murine Leukemia Virus (MMLV). The reaction can be performed over a range of conditions including different temperatures15. All these factors influence the reverse transcription yield, which varies up to 200-fold depending on the priming strategy, enzyme, reaction condition and target21. The reverse transcription is also prone to inhibition. Following reverse transcription, qPCR is generally highly efficient reaction and qualified assay suppliers typically guarantee PCR efficiencies of at least 80 per cent in the absence of interference. However, those that compare PCR efficiency of a purified template with that of real samples with template in complex matrixes experience inhibition22. For the same amount of template, Cq’s in pure media are lower than Cq’s in complex matrices due to interference with reaction components. Thus, the presence of substances that interfere with amplification will directly influence the performance of PCR and may also limit sensitivity.
For analysis of complex samples, it is therefore recommended to determine the sensitivity of the assay, preferably expressed as the limit of detection23. Some inhibitors dramatically interfere with amplification, even at very small amounts. For example, PCR mixtures based on the widely used Taq DNA polymerase are totally inhibited in the presence of 0.004 per cent (v/v) human blood24. The PCR inhibitors originate either from the original sample or from sample preparation prior to PCR or from both25,26. Examples of inhibiting substances present in original samples include bile salts and complex polysaccharides in faeces27,28, collagen in food samples29, heme24, immunoglobulin G (IgG)30, and lactoferrin in blood31, humic substances in soil32,33, melanin and myoglobin in tissue34-36, polysaccharides in plants37, proteinases and calcium ions in milk38, indigo dye in denim39, and urea in urine40. Fatty tissues are in general very problematic. Components from sampling and extraction that inhibit PCR include chelators such as EDTA, which complexes Mg2+. Interestingly, trace amounts of phenol inhibit Taq polymerase, while Tth polymerase main – tains both DNA and RNA-dependent DNA polymerase activity in the presence of five per cent (v/v) phenol. Excess of KCl, NaCl and other salts, ionic detergents such as sodium deoxycholate, sarkosyl and sodium dodecyl sulphate (SDS) also inhibit PCR41, as well as alcohols such as ethanol and isopropanol42. Active reverse transcriptase brought over from the reverse transcription reaction can have an inhibitory effect on the PCR43-45, and stimulate primer-dimer formation46. The effect is profound during the first cycles and declines as the reverse transcriptase denatures by the applied heat and as DNA accumulates. Apparent PCR efficiencies of above 100 per cent that are occasionally reported47,48, may be obtained when standard curves are constructed based on serial dilution of cDNA, which also dilutes the contaminating reverse transcriptase49. To achieve the highest possible sensitivity in RT-PCR, it is pertinent to avoid the inhibiting effect of the reverse transcriptase. To test for inhibition, one can spike in internal controls. Adding a DNA spike into the PCR test sample and the same amount into a control sample, comparing the Cq values will reveal any PCR inhibition. For RNA analysis, an RNA spike can be added into the sample for reverse transcription and the same amount into a control. Comparing the Cq values will reveal issues in the RT-PCR process50. Adding the RNA even earlier, into e.g. the lysate or the homogenised sample, a comparison with control will reveal the performance of the entire sample pre-processing procedure. Generally, the earlier the control is spiked in the more of the experimental procedure is validated. The ultimate control is to inject the RNA into the tissue, which then also monitors the extraction yield. To mimic the behaviour of native mRNAs, the control RNA should have a cap and A-tail16. Inspecting the qPCR response curves inhibition of the reverse transcription and of PCR can be distinguished. While (any) inhibition delays the response, shifting Cq to higher values PCR inhibition also reduces the slope of the qPCR response curve (Figure 2).

Figure 2: Test for inhibition using an RNA spike. Left: No inhibition; center: RT inhibition;right: PCR inhibition
Extracted RNA is often contaminated by DNA. Since mRNAs are primary transcripts of the genes with introns removed by splicing, amplification of the genomic copy can usually be avoided by designing PCR assays with primers spanning an intron. If the intron is significant, the genomic amplicon will be too long to be amplified efficiently using normal PCR elongation time. Of course, this design strategy only works if the gene has introns. But also in those cases, intron spanning assays may produce products from genomic DNA. Eukaryotic genomes contain pseudogenes that are either gene duplications or processed mRNAs. While the former maintain the introns of the native genes, the latter are the result of random integration of reverse-transcribed mature RNA molecules and are characterised by lack of introns, and the processed pseudogenes are amplified even with intron spanning primers. Processed pseudogenes are common in mammalian species although they are much less abundant in other animals51. A comprehensive database of pseudogenes is available52. Measuring gene expression in mammals genomic DNA (gDNA) may pose a serious problem due to the presence of the processed pseudogenes. In these studies, it is pertinent to control for the gDNA background. This can be done by performing RT- controls. An RT- control is a parallel reaction where the reverse transcriptase is left out in the reverse transcription. Hence, no cDNA is formed and the RT- control assesses the background contribution from the gDNA. As a rule of thumb, the Cq value of the RT- control shall be at least five cycles above the Cq of the normal RT+ reaction, which indicates DNA contamination is less than five per cent. The approach works well, but is expensive. Recently, the ValidPrime approach was described which is more cost efficient way to assess gDNA background in RT-qPCR53. ValidPrime is an assay that amplifies genomic DNA only, cDNA is not amplified, and is used to measure amount of gDNA present in a cDNA preparation. In addition to testing all samples for gDNA contamination with ValidPrime, all the assays used are tested for sensitivity to gDNA by analysing a gDNA control16. From the combination of the two measurements, gDNA contributions to the Cq values are readily subtracted. When analysing m genes in n samples, the ValidPrime approach requires only m+n+1 control qPCR’s and no additional RT, while regular RT- controls require a parallel RT followed by m*n control qPCRs. With ValidPrime using GenEx it is possible to correct for the signal from up to 50 – 60 per cent gDNA contamination54. Should contamination be more serious the gDNA has to be removed with DNase. Particularly convenient is to use the heat-labile double-strand specific DNase from Arcticzymes55. The DNase, originally extracted from shrimp, cleaves only double-stranded (genomic) DNA and will not degrade primers. It is then heat-inactivated during the PCR and will not degrade the PCR product either.
In summary, we have excellent methods to measure cDNA levels, with RT-qPCR being the golden standard. However, there are many factors that can influence the result of the measurement yielding values that do not correctly reflect the biologically relevant expression levels. A number of tools to control and test the quality of the experimental approaches are appearing and have been summarised here. The tools comply with current MIQE (Minimum Information for Publication of Quantitative Real-Time PCR Experiments) guidelines56. Approaches for the design and optimisation of RT-qPCR studies have been published57, and since recently courses on quality control and assessment of qPCR data are available58.
References
1. Dictionary of Cancer Terms, National Cancer Institute, National Institutes of Heath.
2. Yingfu Li and Ronald R. Breaker. Kinetics of RNA Degradation by Specific Base Catalysis of Transesterification Involving the 2‘-Hydroxyl Group. J. Am. Chem. Soc., 1999, 121 (23), pp 5364–5372
3. Anders Stahlberg, Mikael Kubista and Pierre Aman. Single-cell gene-expression profiling and its potential diagnostic applications. Expert Rev. Mol. Diagn. 11(7), 735–740 (2011)
4. Joon-Yong Chung, Till Braunschweig, Reginald Williams, Natalie Guerrero, Karl M. Hoffmann, Mijung Kwon, Young K. Song, Steven K. Libutti, and Stephen M. Hewitt. Factors in Tissue Handling and Processing That Impact RNA Obtained From Formalin-fixed, Paraffin-embedded Tissue. Journal of Histochemistry & Cytochemistry 56 (11), 1033-1042 (2008)
5. Simone S Fleige, Michael W MW Pfaffl. RNA integrity and the effect on the real-time qRT-PCR performance. Molecular Aspects of Medicine 27, 126–139 (2006)
6. Viertler C, Groelz D, Gündisch S, Kashofer K, Reischauer B, Riegman PH, Winther R, Wyrich R, Becker KF, Oelmüller U, Zatloukal K. A New Technology for Stabilization of Biomolecules in Tissues for Combined Histological and Molecular Analyses. J Mol Diagn. 2012 Sep;14(5):458-66
7. http://www.genomics.agilent.com/Collection Overview.aspx?PageType=Application&SubPageType= ApplicationOverview&PageID=275
8. http://www.biorad. com/evportal/en/US/LSR/Category/9026a8bd- 2711-496d-b2d0-5f7a056cc26f/Experion-Automated- Electrophoresis-System
9. http://www.perkinelmer.com/Catalog/Category/ ID/LabChip%20Separation
10. http://www.genomics.agilent.com/Collection Subpage.aspx?PageType=Product&SubPageType=Pro ductDetail&PageID=2544
11. http://www.qiagen.com/products/qiaxcelsystem.aspx
12. http://www.aati-us.com/instruments/ fragment_analyzer/index.html
13. Andreas Schroeder, Odilo Mueller, Susanne Stocker, Ruediger Salowsky, Michael Leiber, Marcus Gassmann, Samar Lightfoot, Wolfram Menzel, Martin Granzow and Thomas Ragg. The RIN: an RNA integrity number for assigning integrity values to RNA measurements. BMC Molecular Biology 2006, 7:3
14. Tania Nolan, Rebecca E Hands, & Stephen A Bustin. Quantification of mRNA using real-time RT-PCR. NATURE PROTOCOLS, VOL.1 NO.3, 2006, 1559
15. Anders Ståhlberg, Joakim Håkansson, Xiaojie Xian, Henrik Semb, and Mikael Kubista. Properties of the Reverse Transcription Reaction in mRNA Quantification. Clinical Chemistry 50:3, 509–515 (2004)
16. http://www.tataa.com/products-page/quality-control/
17. Andreas Pahl and Kay Brune. Stabilization of Gene Expression Profiles in Blood after Phlebotomy. Clinical Chemistry, December 2002 vol. 48 no. 12 2251-2253
18. http://www.qiagen.com/Products/ RnaStabilizationPurification/DSP/PaxGeneBlood RnaKitIVD.aspx
19. www.spidia.eu
20. Kalle Günther, Francesca Malentacchi, Paolo Verderio, Sara Pizzamiglio, Chiara Maura Ciniselli, Ales Tichopad, Mikael Kubista, Ralf Wyrich, Mario Pazzagli, Stefania Gelmini. Implementation of a proficiency testing for the assessment of the preanalytical phase of blood samples used for RNA based analysis. Clinica Chimica Acta 413 (2012) 779–786
21. Anders Ståhlberg, Mikael Kubista, and Michael Pfaffl. Comparison of Reverse Transcriptases in Gene Expression Analysis. Clinical Chemistry 50, No. 9, 2004
22. A. Ståhlberg, P. Åman, B. Ridell, P. Mostad, M. Kubista. Quantitative Real-Time PCR Method for Detection of BLymphocyte Monoclonality by Comparison of Kappa and Lambda Immunoglobulin Light Chain Expression. Clinical Chemistry, 2003, 49:1, 51-59
23. Burns, M. Valdivia, H. Modelling the limit of detection in real-time quantitative PCR European Food Research and Technology A, Volume 226, Number 6, April 2008 , pp. 1513-1524(12)
24. Akane, A., Matsubara, K., Nakamura, H., Takahashi, S., and Kimura, K. (1994) Identification of the heme compound copurified with deoxyribonucleic acid (DNA) from bloodstains, a major inhibitor of polymerase chain reaction (PCR) amplification. J. Forensic Sci. 39, 362–372
25. Peter Rådström, Rickard Knutsson, Petra Wolffs, Maria Lövenklev, and Charlotta Löfström. Strategies to Generate PCR-Compatible Samples. Mol Biotechnol. 2004 Feb;26(2):133-46
26. Ian G. Wilson. Inhibition and Facilitation of Nucleic Acid Amplification. Appl Environ Microbiol. 63, 3741-51 (1997)
27. Lantz, P.-G., Matsson, M., Wadström, T., and Rådström, P. Removal of PCR inhibitors from human faecal samples through the use of an aqueous two-phase system for sample preparation prior to PCR. J. Microbiol. Methods 28, 159–167 (1997)
28. Monteiro L, Bonnemaison D, Vekris A, Petry KG, Bonnet J, Vidal R, Cabrita J, Mégraud F. Complex polysaccharides as PCR inhibitors in feces: Helicobacter pylori model. J. Clin. Microbiol.35, 995–998 (1997)
29. Kim CH, Khan M, Morin DE, Hurley WL, Tripathy DN, Kehrli M Jr, Oluoch AO, Kakoma I. Optimization of the PCR for detection of Staphylococcus aureus nuc gene in bovine milk. J. Dairy Sci. 84, 74–83 (2001)
30. Abu Al-Soud, W., Jönsson, L. J., and Rådström, P. (2000) Identification and characterization of immunoglobulin G in blood as a major inhibitor of diagnostic PCR. J. Clin. Microbiol. 38, 345–350
31. Abu Al-Soud, W. and Rådström, P. (2001) Purification and characterization of PCR-inhibitory components in blood cells. J. Clin. Microbiol. 39, 485–493
32. Tsai, Y. L. and Olson, B. H. (1992) Rapid method for separation of bacterial DNA from humic substances in sediments for polymerase chain reaction. Appl. Environ. Microbiol. 58, 2292–2295
33. Watson, R.J. and Blackwell, B. (2000) Purification and characterization of a common soil component which inhibits the polymerase chain reaction. Can J. Microbiol. 46, 633–42
34. Eckhart, L., Bach, J., Ban, J., and Tschachler, E. (2000) Melanin binds reversibly to thermostable DNA polymerase and inhibits its activity. Biochem.Biophys. Res. Commun. 271, 726–730
35. Belec, L., Authier, J., Eliezer-Vanerot, M. C., Piedouillet, C., Mohamed, A. S., and Gherardi, R. K. (1998) Myoglobin as a polymerase chain reaction (PCR) inhibitor: a limitation for PCR from skeletal muscle tissue avoided by the use of Thermus thermophilus polymerase. Muscle Nerve 21, 1064–1067
36. Yoshii T, Tamura K, Taniguchi T, Akiyama K, Ishiyama I. (1993) Water-soluble eumelanin as a PCR-inhibitor and a simple method for its removal. Nihon Hoigaku Zasshi 47, 323–9
37. Demeke, T. and Adams, R. P. (1992) The effects of plant polysaccharides and buffer additives on PCR. Biotechniques 12, 332–334
38. Bickley, J., Short, J. K., McDowel, D. G., and Parkes, H. C. (1996) Polymerase chain reaction (PCR) detection of Listeria monocytogenes in diluted milk and reversal of PCR inhibition caused by calcium ions. Lett. Appl. Microbiol. 22, 153–158
39. Shutler GG, Gagnon P, Verret G, Kalyn H, Korkosh S, Johnston E, Halverson J. (1999) Removal of a PCR inhibitor and resolution of DNA STR types in mixed human-canine stains from a five year old case. J. Forensic Sci. 44, 623–6
40. Khan, G., Kangro, H. O., Coates, P. J., and Heath, R. B. (1991) Inhibitory effects of urine on the polymerase chain reaction for cytomegalovirus DNA. J. Clin. Pathol. 44, 360–365
41. Weyant, R.S. et al. (1990) Effect of ionic and nonionic detergents on the Taq polymerase. Biotechniques 9, 308–9
42. D. Loffert, S. Stump, N. Schaffrath, M. Berkenkopf and J. Kang, 1997 PCR: effects of template quality. Qiagen News 1: 8-10
43. Sellner,L.N., Coelen,R.J. and Mackenzie,J.S. (1992) Reverse transcriptase inhibits Taq polymerase activity. Nucleic Acids Res., 20, 1487–1490
44. Fehlmann,C., Krapf,R. and Solioz,M. (1993) Reverse transcriptase can block polymerase chain reaction. Clin. Chem., 39, 368–369
45. Liss,B. (2002) Improved quantitative real-time RT–PCR for expression profiling of individual cells. Nucleic Acids Res., 30, e89
46. Chumakov,K.M. (1994) Reverse transcriptase can inhibit PCR and stimulate primer-dimer formation. PCR Methods Appl., 4, 62–64
47. Deprez,R.H.L., Fijnvandraat,A.C., Ruijter,J.M. and Moorman,A.F.M. (2002) Sensitivity and accuracy of quantitative real-time polymerase chain reaction using SYBR green I depends on cDNA synthesis conditions. Anal. Biochem., 307, 63–69
48. Peters,I.R., Helps,C.R., Hall,E.J. and Day,M.J. (2004) Realtime RT–PCR: considerations for efficient and sensitive assay design. J. Immunol. Methods, 286, 203–217
49. Oleg Suslov and Dennis A. Steindler. PCR inhibition by reverse transcriptase leads to an overestimation of amplification efficiency. Nucleic Acids Research, 2005, Vol. 33, No. 20 e181
50. Use of External RNA Controls in Gene Expression Assays. MM16-A CLSI Approaed guidelines (www.clsi.org)
51. Baikang Pei, Cristina Sisu1, Adam Frankish, Cédric Howald, Lukas Habegger, Xinmeng J Mu, Rachel Harte, Suganthi Balasubramanian, Andrea Tanzer, Mark Diekhans, Alexandre Reymond, Tim J Hubbard3, Jennifer Harrow and Mark B Gerstein. The GENCODE pseudogene resource. Genome Biology 2012, 13:R51
52. http://www.pseudogene.org/
53. Henrik Laurell, Jason S. Iacovoni, Anne Abot, David Svec, Jean-Jose Maoret, Jean-Francois Arnal and Mikael Kubista. Correction of RT–qPCR data for genomic DNAderived signals with ValidPrime. Nucleic Acids Research, 2012, 1–10
54. www.multid.se
55. www.arcticzymes.com
56. Stephen Bustin, Jeremy Garson, Jan Hellemans, Jim Huggett, Mikael Kubista, Reinhold Mueller, Tania Nolan, Michael Pfaffl, Gregory Shipley, Jo Vandesompele, Carl Wittwer. The MIQE Guidelines: Minimum Information for Publication of Quantitative Real-Time PCR Experiments. Clin Chem. 2009 Apr;55(4):611-22
57. Ales Tichopad, Rob Kitchen, Irmgard Riedmaier, Christiane Becker, Anders Ståhlberg, and Mikael Kubista. Design and Optimization of Reverse-Transcription Quantitative PCR Experiments. Clinical Chemistry 55:10 (2009); doi:10.1373/clinchem.2009.126201
58. http://www.tataa.com/courses/
