Raman spectroscopy for the analysis of drug products and drug manufacturing processes
Posted: 9 May 2010 |
This article aims at supplying a concise overview on the application of Raman spectroscopic analysis methods within the pharmaceutical drug product manufacturing world. Firstly, there will be a focus on the rapid and nondestructive off-line analysis feasibility of Raman spectroscopy for final drug products. Herewith, several possible sources of error will be discussed. Secondly, the applicability of Raman spectroscopy for in-process monitoring of drug product production processes will be highlighted. In addition, the tendency within the pharmaceutical industry to move from batch processing towards continuous manufacturing will be envisaged.
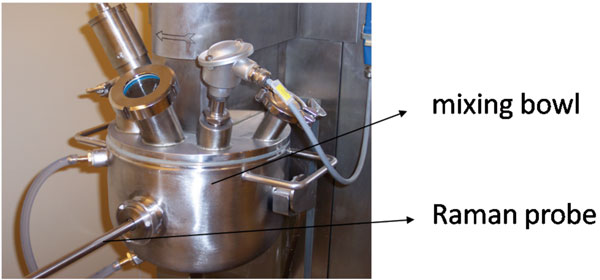
Figure 3
This article aims at supplying a concise overview on the application of Raman spectroscopic analysis methods within the pharmaceutical drug product manufacturing world. Firstly, there will be a focus on the rapid and nondestructive off-line analysis feasibility of Raman spectroscopy for final drug products. Herewith, several possible sources of error will be discussed. Secondly, the applicability of Raman spectroscopy for in-process monitoring of drug product production processes will be highlighted. In addition, the tendency within the pharmaceutical industry to move from batch processing towards continuous manufacturing will be envisaged.
Raman spectroscopy is a molecular vibrational spectroscopic technique studying vibrational transitions in molecules. The wavenumber differences between the incident radiation from the monochromatic Raman laser light source (visible or NIR) and the inelastically scattered radiation from the sample, corresponding to the vibrational energy transitions, are plotted in Raman spectra.
The Raman effect was first observed in 1928 by Sir C.V. Raman1. However, this effect was already predicted in 1923 by Smekal2, based on theoretical calculations. Raman performed his first experiments using the sun as a light source, being the most intense light source at that time. A telescope was focused on the sun and a green filter was used to select green light from the intense sunrays. This green light was led through a chloroform solution, after which a yellow filter was placed. Sir Raman was able to see weak yellow light, indicating that a small part of the green light was scattered inelastic by the chloroform molecules. The energy of the inelastic scattered light (i.e.; Stokes radiation) was moved to the yellow part of the spectrum. This inelastic scattering is called the Raman effect3. Because of the complicated measurement procedures and the very weak Raman effect (only 10-8 of the initial radiation, making the detection sensitivity generally low), Raman spectroscopy was applied only rarely since the discovery of the Raman effect. It took until the end of the 1980s, where several equipment improvements together with the implementation of stable laser light sources, charge coupled device detectors, holographic filters, microelectronics, glass fibres, Fourier-Transform etc. made the application of Raman spectroscopy as a fast and non-destructive analytical tool more easy and popular, including for pharmaceutical analysis purposes. Raman spectra generally show sharp bands, hence supplying very detailed and often easy to interpret spectral information. This is in contrast to NIR spectra, where usually broad and overlapping signals are obtained. The selection rule for Raman activity of molecules is the occurrence of a change in polarisability with the vibrational modes from the irradiated molecules, while for NIR activity, a change in dipole moment with the vibrational modes should occur. These different selection rules can make Raman and NIR spectroscopy complementary: molecular groups producing strong signals in Raman spectra might produce weak signals in NIR spectra and vice versa.
Raman spectroscopy as a drug product analysis tool
Since the instrumental improvements over the last two decades, Raman spectroscopy has been increasingly used as a fast (seconds) and non-destructive tool for the qualitative and quantitative analysis of chemical and physical quality aspects from solid, semi-solid and liquid drug products. The appropriateness of Raman spectro – scopy for drug analysis has mainly been investigated for the qualitative and quantitative determination of active pharmaceutical ingredients in tablets4-9 and capsules10-11, even for low doses (< one per cent)12. Vergote et al. described how diltiazem hydrochloride was quantified in commercial tablets by measuring through the original transparent package (blister)13. The authors also demonstrated that the sharpness of the spectral Raman bands allowed the development of a simple univariate calibration model as all excipient and blister signals were not overlapping the diltiazem hydrochloride signals in the 1550-1650 cm-1 spectral range (Figure 1). Recently, Johansson et al. described the application of transmission Raman spectroscopy for the analysis of pharmaceutical tablets and capsules14. The suitability of Raman spectroscopy for fast and nondestructive qualitative and quantitative tablet analysis also generated important forensic applications, being (1) the fast distinction of counterfeits from genuine drugs15-20 and (2) the fast identification and analysis of illegal drugs21. As water is a very weak Raman scatterer, Raman spectroscopy presented itself as a suitable tool for analyses in aqueous environments. De Beer et al. and Park et al. described fast and non-destructive Raman spectroscopic methods for the quantitative analysis of pharmaceutical suspensions22-23, while Tian et al. studied the conversion of carbamazepine in an aqueous suspension24-25. In numerous studies, Raman spectroscopy has been used for qualitative and quantitative solid-state form analysis since conformation and intermolecular bonding differences may alter Raman scattering and intensity. Strachan et al. supply a thorough overview of applications where Raman spectroscopy has been used for the quantification of polymorphic mixtures, crystalline/amorphous mixtures and hydrate/anhydrate mixtures26. Furthermore, protein conformational changes and co-crystal formation and characterisation have been investigated using Raman spectroscopy by Elkordy et al. and by Allesø et al., respectively27-28. Raman microscopy has shown to be a less suitable tool for quantitative drug analysis. Bell et al. demonstrated that Raman microscopy was not able to quantify bulk components in mixtures, even when a large number of sampling spots was used29. Raman microscopy mainly finds its drug product analysis application in drug distribution (mapping)30-31 and drug migration evaluation (Figure 2)32, drug characterisation25,33, formulation visualisation34 and coating evaluation35-36.

Figure 1

Figure 2
Several possible sources of error and variability should be considered during the development and validation of quantitative Raman spectroscopic analysis methods: intra-day and day-to-day laser power and spectrometer variability, sample homogeneity, sample positioning and particle size37. Studies showed that mixture sub-sampling occurred when a small laser spot size (i.e., a small sampling volume) was used38. Rantanen et al. proved that dynamic mixing and increasing the spot size decreased the prediction errors and improved the calibration models for the quantification of anhydrate/hydrate powder mixtures39. Park et al. proved that a large spot probe (28.3 mm2), enabling the coverage of a representative area during sampling, resulted in a very reliable Raman analysis method for a pharmaceutical suspension23. Moreover, these authors placed a transparent layer of isobutyric anhydride, showing characteristic spectral signals which were not overlapping the suspension signals, in front of the sample vials before each measurement to correct for Raman instrument variations and sample positioning variations. Finally, attention should be drawn to three more phenomena that might disturb the analysis of pharmaceutical drug products: fluorescence, diffuse reflectance and absorption of laser and Raman scattered light26. Fluorescence can be reduced by increasing the laser wavelength (e.g.; NIR lasers). Sources of error by absorption and by laser light diffuse reflectance should be minimised by using consistent sample preparation and sampling26.
Raman spectroscopy as pharmaceutical process analysis tool
Raman spectrometers can be easily connected to different types of probes (e.g.; non-contact, dynisco, immersion, ball) via fibre optic cables. These probes can be implemented into process streams, hence allowing in-process monitoring and continuous collection of Raman spectral process data. Therefore, Raman spectroscopy is considered as a potential process analytical technology (PAT) tool40 for pharmaceutical production processes. Process Analytical Technology plays a crucial role in the design, analysis and control of manufacturing processes based on timely in-line, on-line and at-line measurements (i.e., during processing) of critical quality and performance attributes of raw and in-process materials, with the goal of ensuring final product quality. It is thus aimed to obtain real-time information of all critical process aspects to guide processes towards their desired state, hence ensuring the quality of each end product and possibly allowing real-time release. The ultimate goal of PAT is a better fundamental scientific understanding of manufacturing processes (processes may not be black boxes). Until now, it has been investigated for a wide range of traditionally applied batch processes whether Raman spectroscopy helps to increase process knowledge and understanding by in-line monitoring of several critical process (e.g.; process endpoints) and formulation aspects (e.g.; behaviour of active pharmaceutical ingredients and excipients during processing). Several studies have been published on the in-line Raman spectroscopic monitoring of all batch process steps involved in the production of tablets: blending12,41-42 (Figure 3), granulation43, drying44, tabletting45 and coating46. Concerning the latter, Raman spectroscopy has also been used at-line for the evaluation of tablet-to-tablet coating variability47 and coating thickness48-49.

Figure 3
During in-line process monitoring, attention should be paid on the sampling techniques and the interfacing with moving matter (what, where and how should be measured?), both from the fundamental perspective in relation to interaction of radiation and matter, and from a more practical point of view in relation to the challenging manufacturing environment, such as interfacing sensor with product in GMP environment. Wikström et al., investigated the performance characteristics of Raman spectrometers with different sampling optics in the context of process monitoring, and concluded that large spot non-contact optics provide significant advantages over the standard systems (small spots) both as a result of the enhanced sampling volume and because of the greater robustness of the system to fluctuations in sampling distance50. Besides the process steps involved in the production of tablets, Raman spectroscopy has shown its value for the in-line monitoring of critical process and product aspects during pellet manufacturing51 and freeze-drying52-53 processes.
Within the scope of increased process efficiency and increased production, there is a tendency within the pharmaceutical industry to move from batch processing towards con – tinuous processing54. Continuous production processes are based on the ‘one-in-one-out’ principle, and avoid scale-up issues, reduce cycle times, reduce production costs, ensure faster product release, increase flexibility and efficiency, and improve product quality. It is obvious that the current conventional quality control systems of production processes, based on off-line analysis in analytical laboratories, would annul the advantages of continuous processing, and that continuous real-time quality control is indispensable for continuous production. Based on the experiences and gained knowledge from in-line monitoring of batch processes, Raman spectroscopy will certainly act as a potential process analyser for continuous processes.
Conclusion
Raman spectroscopy currently serves as a fast and non-destructive tool for the qualitative and quantitative analysis of chemical and physical quality aspects in solid, semi-solid and liquid drug products. However, the suitability of Raman spectroscopy for drug analysis is very case dependent and might be limited by low Raman activity of the envisaged analytes and fluorescence problems. The weakness of the Raman effect generally implicates rather low detection sensitivity. Besides its appropriateness for off-line analysis, it has been demonstrated that Raman spectroscopy can be applied for the in-process monitoring and analysis (also leading to increased process understanding) of several critical process and formulation aspects during traditionally applied batch processes. Within the tendency from the pharmaceutical industry to move from batch processing to continuous processing, Raman spectroscopy will certainly occupy a prominent position for the development of indispensable real-time quality control systems.
References
- C.V. Raman, K.S. Krishnan, Nature, 121 (1928) 501.
- A. Smekal, Naturwissenschaften, 11 (1923) 873.
- R.L. McCreery, Raman spectroscopy for Chemical Analysis, Wiley-Interscience, New York, 2000.
- C.G. Kontoyannis, M. Orkoula, Talanta, 41 (1994) 1981-1984.
- R. Szostak, S. Mazurek, The Analyst, 127 (2002) 144-148.
- S.G. Skoulika, C.A. Georgiou, Applied Spectroscopy, 57 (2003) 407-412.
- S. Mazurek, R. Szostak, Journal of Pharma ceutical and Biomedical Analysis, 40 (2006) 1225-1230.
- C.K. Markopoulou, J.E. Koundourellis, M.G. Orkoula, C.G. Kontoyannis, Applied Spectroscopy, 62 (2008) 251-257.
- M. Orkoula, C.G. Kontoyannis, Journal of Pharmaceutical and Biomedical Analysis, 47 (2008) 631-635.
- J. Kim, J. Noh, H. Chung, Y.A. Woo, M.S. Kemper, Y. Lee, Analytica Chimica Acta, 598 (2007) 280-285.
- C. Eliasson, N.A. Macleod, L.C. Jayes, F.C. Clarke, S.V. Hammond, M.R. Smith, P. Matousek, Journal of Pharmaceutical and Biomedical Analysis, 47 (2008) 221-229.
- D.S. Hausman, R.T. Cambron, A. Sakr, Inter national Journal of Pharmaceutics, 298 (2005) 80-90.
- G.J. Vergote, C. Vervaet, J.P. Remon, T. Haemers, F. Verpoort, European Journal of Pharmaceutical Sciences, 16 (2002) 63-67.
- J. Johansson, A. Sparén, O. Svensson, S. Folestad, M. Claybourn, Applied Spectroscopy, 61 (2007) 1211-1218.
- C. Eliasson, P. Matousek, Analytical Chemistry, 79 (2007) 1696-1701.
- R.C. Willis, Analytical Chemistry, 79 (2007) 1773.
- C. Ricci, C. Eliasson, N.A. Macleod, P.N. Newton, P. Matousek, S.G. Kazarian, Analytical and Bioanalytical Chemistry, 389 (2007) 1525-1532.
- M. de Veij, A. Deneckere, P. Vandenabeele, D. de Kaste, L. Moens, Journal of Pharmaceutical and Biomedical Analysis, 46 (2007) 303-309.
- N.A. Macleod, P. Matousek, Pharmaceutical Research, 25 (2008) 2205-2215.
- C. Ricci, L. Nyadong, F. Yang, F.M. Fernandez, C.D. Brown, P.N. Newton, S.G. Kazarian, Analytica Chimica Acta, 623 (2008) 178-186.
- S.E. Bell, D.T. Burns, A.C. Dennis, J.S. Speers, The Analyst, 125 (2000) 541-544.
- T. De Beer, W.R.G. Baeyens, A. Vermeire, D. Broes, J.P. Remon, C. Vervaet, Analytica Chimica Acta, 589 (2007) 192-199.
- S.C. Park, M. Kim, J. Noh, H. Chung, Y. Woo, J. Lee, M.S. Kemper, Analytica Chimica Acta, 593 (2007) 46-53.
- F. Tian, J.A. Zeitler, C.J. Strachan, D.J. Saville, K.C. Gordon, T. Rades, Journal of Pharmaceutical and Biomedical Analysis, 40 (2006) 271-280.
- F. Tian, N. Sandler, K.C. Gordon, C.M. McGoverin, A. Reay, C.J. Strachan, D.J. Saville, T. Rades, European Journal of Pharmaceutics and Biopharmaceutics, 64 (2006) 326-335.
- C.J. Strachan, T. Rades, K.C. Gordon, J. Rantanen, Journal of Pharmacy and Pharmacology, 59 (2007) 179-192.
- A.A. Elkordy, R.T. Forbes, B.W. Barry, European Journal of Pharmaceutical Sciences, 33 (2008) 177-190.
- M. Allesø, S. Velaga, A. Alhalaweh, C. Cornett, M.A. Rasmussen, F. van den Berg, H.L. de Diego, J. Rantanen, Analytical Chemistry, 80 (2008) 7755-7764.
- S.E.J. Bell, J.R. Beattie, J.J. McGarvey, K.L. Peters, N.M.S. Sirimuthu, S.J. Speers, Journal of Raman Spectroscopy, 35 (2004) 409-417.
- Y. Fujimaki, T. Matsubara, T. Sakamoto, D. Sasakura, T. Miura, M.Takekawa, Y. Hiyama, Pharmazie, 64 (2009) 316-322.
- [S. Sasic, M. Whitlock, Applied Spectroscopy, 62 (2008) 916-921.
- B. Gotter, W. Faubel, R.H. Neubert, European Journal of Pharmaceutics and Biopharma – ceutics, 74 (2010) 14-20.
- M.J. Henson, L. Zhang, Applied Spectroscopy, 60 (2006) 1247-1255.
- F.C. Clarke, M.J. Jamieson, D.A. Clark, S.V. Hammond, R.D. Jee, A.C. Moffat, Analytical Chemistry, 2001 (73) 2213-2220.
- A. Ringqvist, L.S. Taylor, K. Ekelund, G. Ragnarsson, S. Engström, A. Axelsson, International Journal of Pharmaceutics, 267 (2003) 35-47.
- A. Belu, C. Mahoney, K. Wormuth, Journal of Controlled Release, 126 (2008) 111-121.
- M.J. Pelletier, Applied Spectroscopy, 57 (2003) 20A-42A.
- J. Johansson, S. Pettersson, S. Folestad, Journal of Pharmaceutical and Biomedical Analysis, 39 (2005) 510-516.
- J. Rantanen, H. Wikström, F.E. Rhea, L.S. Taylor, Applied Spectroscopy, 59 (2005) 942-951.
- http://www.fda.gov/downloads/Drugs/GuidanceCompliance RegulatoryInformation/Guidances/UCM070305.pdf
- G.J. Vergote, T. De Beer, C. Vervaet, J.P. Remon, W.R.G. Baeyens, N. Diericx, F. Verpoort, European Journal of Pharmaceutical Sciences, 21 (2004) 479-485.
- T. De Beer, C. Bodson, B. Dejaegher, B. Walczak, P. Vercruysse, A. Burggraeve, A. Lemos, L. Delattre, Y. Vander Heyden, J.P. Remon, C. Vervaet, W.R.G. Baeyens, Journal of Pharmaceutical and Biomedical Analysis, 48 (2008) 772-779.
- H. Wikström, P.J. Marsac, L.S. Taylor, Journal of Pharmaceutical Sciences, 94 (2005) 209-219.
- K. Kogermann, J. Aaltonen, C.J. Strachan, K. Pöllänen, J. Heinämäki, J. Yliruusi, J. Rantanen, Journal of Pharmaceutical Sciences, 97 (2008) 4983-4999.
- A.C. Williams, V.B. Cooper, L. Thomas, L.J. Griffith, C.R. Petts, S.W. Booth, International Journal of Pharmaceutics, 275 (2004) 29-39.
- J. Müller, K. Knop, J. Thies, C. Uerpmann, P. Kleinebudde, Drug Development and Industrial Pharmacy, 36 (2010) 234-243.
- S. Romero-Torres, J.D. Pérez-Ramos, K.R. Morris, E.R. Grant, Journal of Pharmaceutical and Biomedical Analysis, 38 (2005) 270-274.
- S. Romero-Torres, J.D. Pérez-Ramos, K.R. Morris, E.R. Grant, Journal of Pharmaceutical and Biomedical Analysis, 41 (2006) 811-819.
- J.F. Kauffman, M. Dellibovi, C.R. Cunningham, Journal of Pharmaceutical and Biomedical Analysis, 43 (2007) 39-48.
- H. Wikström, I.R. Lewis, L.S. Taylor, Applied Spectroscopy, 59 (2005) 934-941.
- N. Sandler, J. Rantanen, J. Heinämäki, M. Römer, M. Marvola, J. Yliruusi, AAPS PharmSciTech, 6 (2005) E174-E183.
- S. Romero-Torres, H. Wikström, E.R. Grant, L.S. Taylor, PDA Journal of Pharmaceutical Sciences and Technology, 61 (2007) 131-145.
- T. De Beer, M. Allesø, F. Goethals, A. Coppens, Y. Vander Heyden, H.L. de Diego, J. Rantanen, F. Verpoort, C. Vervaet, J.P. Remon, W.R.G. Baeyens, Analtyical Chemistry, 79 (2007) 7992-8003.
- C. Vervaet, J.P. Remon, Chemical Engineering Science, 60 (2005) 3949-3957.
About the author
Professor Thomas De Beer graduated in pharmaceutical sciences in 2002 from the Ghent University in Belgium. He obtained his PhD at the same university in 2007. For his PhD research, he examined the suitability of Raman spectroscopy as a Process Analytical Technology tool for pharmaceutical production processes. Within his PhD research period, he worked for three months at University of Copenhagen in Denmark, Department of Pharmaceutics and Analytical Chemistry. After his PhD, he was a FWO funded post-doctoral fellow at the Ghent University (2007-2010). Within his post-doc mandate, he worked for eight months at the Department of Pharmacy, Pharmaceutical Technology and Biopharmaceutics at the Ludwig-Maximilians-University in Munich, Germany. In February 2010, he became assistant-professor in Process Analytical Technology at the Faculty of Pharmaceutical Sciences from the University of Ghent. His research goals include the implementation of PAT systems in innovative pharmaceutical production processes.