Process systems engineering (PSE) in the pharmaceutical industry: past and future
Posted: 15 December 2013 | | No comments yet
Process Systems Engineering (PSE) has had a profound impact in the chemical, petroleum and petrochemical industry in the last 30 – 40 years. Even though PSE has already started to make a significant impact on the pharmaceutical industry, there are substantial additional benefits that can be derived. The purpose of this paper is to provide a summary of the current state of the application of PSE tools in the pharmaceutical industry and forecast what additional beneficial contributions might be in the horizon. We present here a very brief summary of what was already presented elsewhere1.
While the industry is regularly using the traditional Design of Experiments approach to identify key parameters and to define control spaces, these approaches result in passive control strategies that do not attempt to compensate for disturbances. Special new approaches are needed for batch processes due to their essential dependence on time-varying conditions. Lastly, we briefly describe a novel data driven modelling approach, called Design of Dynamic Experiments, that enables the optimisation of batch processes with respect to time-varying conditions through an example of a simulated chemical reaction process. Many more approaches of this type are needed for the calculation of the Design and Control Spaces of the process, and the effective design of feedback control systems.
Introduction
From 1980 to the present day, the continuous processing industry has seen an explosive use of processes system engineering tools and algorithms in their plants with substantial benefits, both economic and reducing the variability in the quality of the produced products. From the pharmaceutical industrial side, a decade has elapsed since the FDA publication ‘Pharmaceutical cGMPs for the 21st Century: A Risk-Based Approach’ and ‘PAT – A Framework for innovative Pharmaceutical Manufacturing and Quality Assurance’ were issued. Much progress and innovation in pharmaceutical manufacturing has occurred since the publication of these landmark documents. The application of multivariate process monitoring for real time fault detection and isolation has also found its way into pharmaceutical manufacturing. The industry has moved away from quality control strategies based on univariate parameters specifications, and towards the multivariate design space approach. While tremendous progress has been achieved in the decade, there is work to be done to realise the full potential of the process systems engineering (PSE) toolbox.
To augment information available in the open literature, we conducted an industrial benchmarking survey on the above-mentioned PSE sub areas that contained 21 questions in total. The survey was submitted to current pharmaceutical industry professionals in all areas of the industry: active pharmaceutical ingredient, solid oral dosage and biologics, in both development and manufacturing. The nine companies that submitted responses to the survey are: Alkermes, Johnson & Johnson, Bend Research, Bristol-Myers Squibb, Merck, Cephalon, Eli Lilly, Pfizer and Vertex. The interesting data this survey yielded are presented in our detailed publication1.
The current state of PSE tools in Pharma
We first briefly describe the current state of the utilisation PSE tools in the pharmaceutical industry.
Measurement systems for active pharmaceutical ingredients (API) manufacturing
The most common uses of process analytical techniques applied in API manufacturing are for studying reaction kinetics, reaction monitoring, secondary drying, crystallisation and milling operations.
The primary measurement system applied to reaction monitoring for API production is in-line Mid-Infrared spectroscopy2. Other techniques such as in-line Raman spectroscopy3, in-line NIR and on-line HPLC4 are also in use. During process development, the concentration profiles measured from the tools listed above are used to determine reaction mechanisms, identification of reaction intermediates and kinetic rate parameters for modelling2a. In a manufacturing deployment, reaction monitoring would be used for reaction end-point determination, and verification that the process is operating under safe conditions. While most of the published literature describes laboratory scale applications, some work on production scale equipment has been reported5.
Process measurement systems for API crystallisation operations include the use of in-line Mid-Infrared, Raman and NIR spectroscopy, in-line focused beam reflectance measurements (FBRM), and in-line imaging systems. Mid infrared spectroscopy6 is most often used for measuring the level of supersaturation in the crystallisation slurry. Raman7 and to a lesser extent NIR8 spectroscopy are implemented to monitor API form conversion. Lastly, in-line FBRM and in-line imaging are used to estimate particle size distribution and to assess crystal habit, respectively. These tools are extensively used in process development to study and optimise crystallisation conditions.
Measurement systems for solid oral dosage manufacturing
Common applications of process analytical techniques used in solid oral dosage manufacturing are for blend / lubrication uniformity, tablet content uniformity and moisture content during fluid bed drying. On-line NIR spectroscopy is the industry standard for tote blending operations. Both qualitative and quantitative methods can be developed to assess blend uniformity. Application of qualitative methods is the more common approach due to the simplicity. In qualitative methods, measure of spectral variability is tracked as a function of blender revolutions in a moving block fashion. Quantitative methods correlate blend composition to NIR spectra with PLS models.
Roller compaction process analytics include the use of instrumented rolls9 that measure the stress profile across the ribbon width. Additionally, at-line measurements of ribbon attributes such as density, porosity and moisture content are also in use. Ribbon property estimation methods can be developed using NIR10. In these methods, partial least squares (PLS) is used to correlate NIR spectra to traditional density and porosity measurements. The common process analytical approaches to high shear wet granulation involve the use of in-line/at-line measurements of particle size distribution11, in-line/at-line NIR12 for granule moisture analysis and impeller power draw13 to estimate granulation endpoint.
Process analytical tools for fluid bed operations includes in-line NIR14 for moisture content and at-line / in-line measurements for granule particle size distribution15. Fluid bed operations are also highly amenable to multivariate process control charting techniques16. In spray drying off-line characterisation tools are used extensively during development to develop process understanding. Then the knowledge is deployed in manufacturing. Spray dried intermediates are typically tested for particle morphology, chemical and physical stability and bio performance.
Film coating is generally considered undesirable from a cost and cycle time perspective, and is only used when the product requires it. Film coating is applied to tablets to function as a taste-masking agent, to provide protection from light. In some cases, the API is in the coating of the tablet, and at-line API concentration and uniformity measurements can be made with spectroscopy techniques, such as NIR.
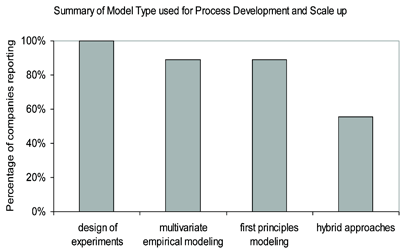

Figure 1: Breakdown of reported modelling approached utilised for process development and scale up. The results show that all of the participating companies have a balanced approach to modelling.
Process monitoring
Process monitoring in manufacturing operations is commonplace in the pharmaceutical industry. Traditional approaches include univariate statistical process control charting. Univariate control charting is applied to critical process parameters and product quality attributes. Process monitoring is conducted primarily for two reasons: as a means of verification, that the process is running within the parameter space allowed by the regulatory filing, and for the development of process understanding. Additional motivations for process monitoring include preventative actions such as fault detection, and for process control, such as end point determination. Within approximately the last 10 years, the use of multivariate statistical process control charting has emerged within the industry.
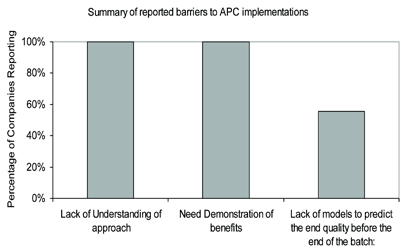

Figure 2: Summary of reported barriers to advanced process control implementations
Process modelling, quality control, and optimisation
Process modelling is used where applicable in the pharmaceutical industry for process design and scale up. Fundamental modelling of reaction processes and kinetics is common in API process development and scale up. In solid oral dosage manufacturing, the application of fundamental modelling is more limited by the complexity of the raw materials and processes. The same is largely true for biological processes. In most cases, fundamental models are not applicable to commercial scale processes. This leaves engineers and scientists with empirical modelling (response surface, regression, latent variable) as the only tractable option for mathematically describing process unit operations.
One third of the companies in our survey reported developing empirical models for 80 per cent to 100 per cent of process unit operations, and another third report 40 per cent to 60 per cent of all unit operations modelled empirically. Over half of the respondents, 56 per cent, report routine use of latent variable modelling techniques, such as PCA and PLS, to describe process unit operations. The advantages of data driven models were reported to be that the models require a minimum of basic fundamental information to develop, and they can be developed relatively quickly. The models work even when the science is not fully understood or too complex to develop a knowledge-driven (KN) model. Junior scientists and engineers can be successful with these approaches and the results can be easily understood by a broad audience with diverse backgrounds. Data driven models capture the physics and all of the variability in the data set, and assist in the identification and prediction of processes up-sets. Lastly, data driven models are reliable within their validated ranges, and in some cases can even be developed from only historical operation data.
Figure 1 shows a summary of the type of modelling approaches practiced in the pharmaceutical industry. It is clear that the industry has a balanced approach to modelling techniques, but favours empirical approaches. All of the responding companies reported applying the modelling approaches shown in Figure 1 on the individual unit operation level, while 33 per cent reported modelling on the plant wide/entire process train level.
The future use of PSE tools
In this section, we briefly discuss the future trends of contract manufacturing and continuous processing in the pharmaceutical industry and their impact on the utilisation and advancement of PSE tools.
Continuous processing for API manufacturing is not economically feasible for most compounds. This is due to the complexity of the chemistries and the number of synthesis and purification steps involved in most processes. Not all products are expected to be amenable to continuous processing, such as products with low drug loads (≤ ~5wt per cent), and products that have extremely poor flowing API. An added benefit of continuous processing would be that full-scale evaluations of alternate raw material supplies would be less costly to conduct.
The results of our questionnaire and the numerous publications indicate that pharmaceutical companies routinely use PAT measurement systems. While most companies currently appear to be using these tools in process development, it is reasonable to expect that in the future most companies will be routinely deploying these tools into manufacturing operations.
In summary, all of the technological advancement above will eventually lead to advanced process control and on-line process optimisation implementations. As more of the remaining pharmaceutical companies implement enterprise-based and plant-wide information technology systems, the application of advanced analytics and optimisation methodologies will evolve into scheduling, capacity, raw material supply and chain management, and enterprise wide real time optimisation.
The key to such advances is the availability of the appropriate models, mostly data-driven models. Several data-driven approaches, such as PCA and PLS, have been very useful indeed. However, new ones are needed that will enable the development of explicitly dynamic and nonlinear models. The Design of Dynamic Experiments (DoDE) methodology described in the next section might be one of the new avenues that might become very useful.
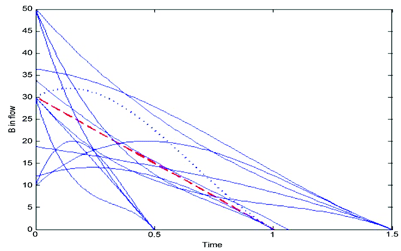

Figure 3: The 13 distinct feeding profiles of the co-reactant B in the DoDE set of experiments. Dashed line: Base Case, Dotted line: Best of 13 cases
The need for data-driven models
The inner workings of the majority of batch pharmaceutical processes are not well understood for a fundamental or knowledge-driven (KD) model to be developed. An additional roadblock in the development of such models is the small production rates of the majority of pharmaceutical products compared to the production rate of bulk chemical and petrochemicals for which a plethora of knowledge-driven models has found extensive use over the last four to six decades. Because such KD models provide a much more detailed and insightful view of the process, their development should be pursued, and is indeed pursued, for selective critical parts of the process.
For the majority of pharmaceutical processes, one needs to rely substantially on the development of data-driven (DD) models. The availability on an ever-increasing set of off-line and on-line process measurements (spectroscopic or otherwise) avails the engineer with substantial data as the starting point of developing a DD model and, through it, attaining a certain understanding of the process. Such measurements are highly correlated with each other and techniques like principal component analysis (PCA) and Partial Least Squares (PLS) have been extensively used. They reduce the dimensionality of the available data and help distinguish the informative from the non-informative data segments. They have been used in a variety of situations, as several of the references given above demonstrate. Even though they are statistically sound, such tools have two major limitations. They are linear and they are not explicitly dynamic. Contrast this with the nonlinear and dynamic character of the majority of pharmaceutical processes and the fact that the available measurements are auto-correlated in time. Both batch and continuous pharmaceutical processes can be approximated by linear models if they do not depart substantially from a nominal operating mode. However, recent FDA regulatory guidelines allow the substantial enlargement of the operating window as long we understand the consequences on the product quality and we have a reliable approach ensuring that quality attributes will remain within their acceptable limits. Enlargement of the operating window necessitates the development of nonlinear DD models. This is often achieved by the development of mostly quadratic Response Surface Models (RSMs) related to the methodology of Design of Experiments (DoE)17.
A further restriction of the abovementioned DD models is that they do not account explicitly for the dynamic character of the pharmaceutical process. Without the use of data driven dynamic models, the systematic design of feedback controllers will be difficult. These feedback controllers are our main mechanism for compensating, using on-line measurements, the variability on the input feedstock and the variability on the uncontrolled disturbances in order to ensure the desired tight product quality specifications.
The optimisation of batch processes is a longstanding problem of interest (see for example the 1983 comprehensive review by Rippin18). The number of publications that address pharmaceutical processes is much smaller (see for example19). The longstanding methodology of batch optimisation in the unit as well in the overall process level is certainly applicable to pharmaceutical processes if a model of the unit or overall process is available. However, the most prevalent case in pharmaceutical applications is that a fundamental model is not easily at hand. Consequently, optimisation is achieved mostly via data-driven models or intuitively via ad hoc approaches. The most frequently used technique is the Design of Experiments (DoE)20. A limitation of such traditional designs is that they only design for time-invariant conditions. The proper selection of time-variant operating conditions, (such as reactor temperature profile, the co-reactant feed rate, or the cooling rate in crystallisations, binder addition during wet granulation) can offer a much more optimal process. A new methodology, called Design of Dynamic Experiments (DoDE), which removes this limitation, will be discussed below.
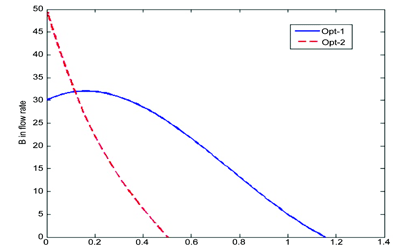

Figure 4: The feeding profiles of the coreactant B that correspond to Opt-1 and Opt-2 that maximise Cc(t¬b)or CC(tb)/tb, respectively
Design of Dynamic Experiments
In an effort to develop a data-driven approach for the optimisation of the end-result of a batch process unit with respect a time-evolving decision variable, Georgakis21 generalised the classical Design of Experiments (DoE) with respect to time-varying decision variables. Examples of such time-varying decision variables are the temperature of a batch reactor, the cooling rate of a crystalliser, or the feeding rate of the nutrient in a fed-batch fermentation unit. A set of experiments is designed; each with a specific time-dependent function for the decision variable and the performance of the batch is measured at the end. The data from all the experiments are used to estimate a response surface model from which the best time-dependent operation is calculated. The detailed explanation of the methodology is given elsewhere22. This methodology was been applied successfully to a crystallisation process23 and a pharmaceutical hydrogenation process24. Here we will briefly present the main idea of this methodology through its application to the following simple but illustrative batch reactor problem.
We will simulate the following reaction network, assuming that the reactor temperature and volume of the reactor are kept constant.
We assume that the reactor volume is 10 lt and that the initial concentration of A is 1.0 gmol/lt. We want to maximise the production of C and for this reason, the reactant B should be fed in semi-batch (fed-batch) mode. The decision variables are the total amount of B that should be fed, the batch time and the dependence of the feeding profile with time. For the total amount of B fed, we set the value of 15 gmol as the reference value and we will consider a range between 10 and 20 gmol fed. Concerning the batch time, the nominal value is set to 1.0 hr and the range between 0.5 and 1.5 hr. The material balances that comprise the model and will be used to simulate the experiments. Here we present a brief outline of the results. More technical details are given elsewhere1.
A D-optimal design is used to define the necessary experiments. For a quadratic model we need a minimum of 10 experiments to estimate the 10 parameters, three additional experiments to assess the Lack-of-Fit (LoF) statistic and three replicates to assess the inherent variability of the process. In Figure 3, we plot the 13 different feeding profiles of the co-reactant B. From the (simulated) experimental data, a Response Surface Model (RSM) is estimated. First we optimise this model so that we maximise the final concentration of product C. We denote this Opt-1. On the other hand, if we wish to optimise the amount of C produced pet unit time of batch operation, CC/tb, the optimal conditions are denoted as Opt-2. In Figure 4, the feeding profiles for the above two optimal operating conditions are plotted. One can clearly observe that they are quite different from each other, yet there were determined by the same set of experiments.
Conclusions
We summarised the state-of-the-art utilisation of PSE tools in the pharmaceutical industry and tried to glance a bit into the future. The results of an industrial benchmarking survey have been presented elsewhere. The literature references provided in this paper, and the data from the questionnaire indicate that the pharmaceutical industry has embraced the use of PAT measurement systems such as spectroscopic tools (Mid-IR, NIR, Raman) and has adopted multivariate data analysis tools (PCA, PLS) for process monitoring and modelling. Some activities on closed-loop control are staring to appear. We hope to have motivated the audience about the greater need of data-driven rather than knowledge-driven models, suitable for quick deployment in process optimisation and on-line control tasks related to pharmaceutical processes. We have also presented a novel-data driven optimisation methodology called Design of Dynamic Experiments.
These PSE tools are currently mostly used in process development, but several companies are using them during manufacturing operations. All the participating companies reported that the risk management / design space approach is applied to product development. They also expressed interest in advanced process control approaches for reducing variability and enlarging the size of the control space. There are clearly many more opportunities for applying existing techniques to other processes as well as in postulating new methodologies such the nascent one on the Design of Dynamic Experiments.
Acknowledgments
The authors acknowledge the permission by Computers and Chemical Engineering Journal to publish this abbreviated version of our original article.
References
- Troup, G. M.; Georgakis, C., Process systems engineering tools in the pharmaceutical industry. Computers and Chemical Engineering 2013, 51, 157-171
- (a) Wolf, U.; L., L.; Seeba, J., Application of infrared ATR spectroscopy to in situ reaction monitoring Catalysis Today 1999, 49 (4), 411-418; (b) Dadd, M. R.; Sharp, D. C. A.; Pettman, A. J.; Knowles, C. J., Real-time monitoring of nitrile biotransformations by mid-infrared spectroscopy. Journal of Microbiological Methods 2000, 41 (1), 69-75; (c) Ge, Z. H.; Thompson, R.; Cooper, S.; Ellison, D.; Tway, P., QUANTITATIVE MONITORING OF AN EPOXIDATION PROCESS BY FOURIER-TRANSFORM INFRARED-SPECTROSCOPY. Process Control and Quality 1995, 7 (1), 3-12
- Svensson, O.; Josefson, M.; Langkilde, F. W., Reaction monitoring using Raman spectroscopy and chemometrics. Chemometrics and Intelligent Laboratory Systems 1999, 49 (1), 49-66.
- Zhu, L.; Brereton, R. G.; Thompson, D. R.; Hopkins, P. L.; Escott, R. E. A., On-line HPLC combined with multivariate statistical process control for the monitoring of reactions Analytica Chimica Acta 2007, 584 (2), 370-378
- Märk, J.; Andre, M.; Karner, M.; Huck, C. W., Prospects for multivariate classification of a pharmaceutical intermediate with near-infrared spectroscopy as a process analytical technology (PAT) production control supplement. European Journal of Pharmaceutics and Biopharmaceutics 2010, 76 (2), 320-327
- (a) Lewiner, F.; Klein, J. P.; Puel, F.; Fevotte, G., On-line ATR FTIR measurement of supersaturation during solution crystallization processes. Calibration and applications on three solute/solvent systems. Chemical Engineering Science 2001, 56 (6), 2069-2084; (b) Fevotte, G., New perspectives for the on-line monitoring of pharmaceutical crystallization processes using in situ infrared spectroscopy. International Journal of Pharmaceutics 2002, 241 (2), 263-278; (c) Cote, A.; Zhou, G.; Stanik, M., A Novel Crystallization Methodology To Ensure Isolation of the Most Stable Crystal Form. Organic Process Research & Development 2009, 13 (6), 1276-1283
- Fevotte, G., In situ raman spectroscopy for in-line control of pharmaceutical crystallization and solids elaboration processes: A review. Chem. Eng. Res. Des. 2007, 85 (A7), 906-920
- Fevotte, G.; Calas, J.; Puel, F.; Hoff, C., Applications of NIR spectroscopy to monitoring and analyzing the solid state during industrial crystallization processes. International Journal of Pharmaceutics 2004, 273 (1-2), 159-169
- Cunningham, J. C.; Winstead, D.; Zavaliangos, A., Understanding variation in roller compaction through finite element-based process modelling. Computers & Chemical Engineering 2010, 34 (7), 1058-1071
- Gupta, A.; Peck, G. E.; Miller, R. W.; Morris, K. R., Nondestructive measurements of the compact strength and the particle-size distribution after milling of roller compacted powders by near-infrared spectroscopy. Journal of Pharmaceutical Sciences 2004, 93 (4), 1047-1053.
- Dieter, P.; Stefan, D.; Guenter, E.; Michael, K., In-line particle sizing for real-time process control by fibre-optical spatial filtering technique (SFT). Advanced Powder Technology 2011, 22 (2), 203-208
- Luukkonen, P.; Fransson, M.; Bjorn, I. N.; Hautala, J.; Lagerholm, B.; Folestad, S., Real-time assessment of granule and tablet properties using in-line data from a high-shear granulation process. Journal of Pharmaceutical Sciences 2008, 97 (2), 950-959
- Leuenberger, H.; Puchkov, M.; Krausbauer, E.; Betz, G., Manufacturing pharmaceutical granules: Is the granulation end-point a myth? Powder Technology 2009, 189 (2), 141-148
- Frake, P.; Greenhalgh, D.; Grierson, S. M.; Hempenstall, J. M.; Rudd, D. R., Process control and end-point determination of a fluid bed granulation by application of near infra-red spectroscopy. International Journal of Pharmaceutics 1997, 151 (1), 75-80
- (a) Hu, X.; Cunningham, J. C.; Winstead, D., Study growth kinetics in fluidized bed granulation with at-line FBRM. International Journal of Pharmaceutics 2008, 347 (1-2), 54-61; (b) Burggraeve, A.; Van Den Kerkhof, T.; Hellings, M.; Remon, J. P.; Vervaet, C.; De Beer, T., Evaluation of in-line spatial filter velocimetry as PAT monitoring tool for particle growth during fluid bed granulation. European Journal of Pharmaceutics and Biopharmaceutics 2010, 76 (1), 138-146
- (a) Burggraeve, A.; Van den Kerkhof, T.; Hellings, M.; Remon, J. P.; Vervaet, C.; De Beer, T., Batch statistical process control of a fluid bed granulation process using in-line spatial filter velocimetry and product temperature measurements. European Journal of Pharmaceutical Sciences 2011, 42 (5), 584-592; (b) Fransson, M.; Folestad, S., Real-time alignment of batch process data using COW for on-line process monitoring. Chemometrics and Intelligent Laboratory Systems 2006, 84 (1-2), 56-61
- (a) Montgomery, D. C., Design and Analysis of Experiments Wiley: New York, 2005; (b) Box, G. E. P.; Draper, N. R., Response Surfaces, Mixtures, and Ridge Analysis. Wiley: Hoboken, NJ, 2007.
- Rippin, D. W. T., Simulation of a Single- and Multiproduct Batch Chemical Plants for Optimal Design and Operation. Computers & Chemical Engineering 1983, 7 (3), 137-156.
- (a) Yang, Y. B.; Tjia, R., Process modelling and optimization of batch fractional distillation to increase throughput and yield in manufacture of active pharmaceutical ingredient (API). Computers & Chemical Engineering 2010, 34 (7), 1030-1035; (b) Bumann, A. A.; Papadokonstantakis, S.; Fischer, U.; Hungerbuhler, K., Optimization of Chemical Batch Processes within a Systematic Retrofit Framework including Evaluation of Historical Process Data. In Pres 2010: 13th International Conference on Process Integration, Modelling and Optimisation for Energy Saving and Pollution Reduction, Vol. 21, pp 919-924; (c) Rocha, M.; Neves, J.; Veloso, A. C. A.; Ferreira, E. C.; Rocha, I., Evolutionary algorithms for static and dynamic optimization of fed-batch fermentation processes. In Adaptive and Natural Computing Algorithms, 2005; pp 288-291
- (a) Montgomery, D. C., Design and Analysis of Experiments. 7th ed.; Wiley: New York, 2008; (b) Box, G. E. P.; Hunter, J. S.; Hunter, W. G., Statistics for Experimenters: Design, Innovation, and Discovery. Wiley-Interscience: New York, 2005
- Georgakis, C. In “A Model‐Free Methodology for the Optimization of Batch Processes: Design of Dynamic Experiments” IFAC International Symposium on Advanced Control of Chemical Processes (ADCHEM 2009), Istanbul, Turkey, Istanbul, Turkey, 2009
- Georgakis, C., “Design of Dynamic Experiments: A Data-Driven Methodology for the Optimization of Time-varying Processes” (to be submitted) 2011
- (a) Fiordalis, A.; Georgakis, C. In “Optimizing Batch Crystallization Cooling Profiles: The Design of Dynamic Experiments Approach”, 9th IFAC International Symposium on Dynamics and Control of Process Systems (DYCOPS), Leuven, Belgium, Leuven, Belgium, 2010; (b) Fiordalis, A.; Georgakis, C. In Design of Dynamic Experiments Versus Model-Based Optimization of Batch Crystallization Processes, IFAC World Congress, Milano, Italy, Milano, Italy, 2011
- Georgakis, C. In “A Model‐Free Methodology for the Optimization of Batch Processes: Design of Dynamic Experiments” IFAC International Symposium on Advanced Control of Chemical Processes (ADCHEM 2009), Istanbul, Turkey, Istanbul, Turkey, 2009
- Makrydaki, F.; Georgakis, C.; Saranteas, K. In Dynamic Optimization of a Batch Pharmaceutical Reaction using the Design of Dynamic Experiments (DoDE): the Case of an Asymmetric Catalytic Hydrogenation Reaction, 9th International Symposium on Dynamics and Control of Process Systems (DYCOPS 2010), Leuven, Belgium, July 5-7, 2010; IFAC: Leuven, Belgium, 2010


Present research activities focus on the development of data-driven modeling methodologies with applications in both batch and continuous processes. As an initial step in this direction, Professor Georgakis has defined a generalisation of the Design of Experiments (DoE) methodology for dynamic processes that he called Design of Dynamic Experiments (DoDE). A consortium of industrial companies is presently under development at Tufts University to support research in this area.
His research activities have been recognised by a multitude of awards both nationally and internationally. He was awarded in 1978 a Dreyfus Foundation Teacher-Scholar Grant. In 1998, one of his publications was selected for the O. Hugo Schuck Best Paper Award of the American Automatic Control Council. In 2001 he was the recipient of the Computing Award of the CAST Division of the American Institute of Chemical Engineers. He became a fellow of the American Institute of Chemical Engineer in 1998, a Fellow of the American Association for the Advancement of Science in 2004 and a fellow of the International Federation of Automatic Control (IFAC) in 2007. He has served as the Chair of the Technical Committee on Process Control and as the Chair of the Coordinating Committee on Industrial Applications of the International Federation of Automatic Control (IFAC). In 2002-03 he served as the President of the American Automatic Control Council. He was a visiting Professor at Delft University I the Netherland, RWTH- Aachen, Aachen, Germany and EPFL in Lausanne Switzerland. He is actively involved in consulting activities with a variety of companies in the area of Process Modelling, Monitoring, Optimisation and Control.


Gregory M. Troup joined Merck & Co., Inc. in 2005, as part of the Process Analytical Technology group in the Merck Manufacturing Division, where he developed in-line, and at-line spectroscopic methods for process and quality control to support drug product manufacturing. In 2009, he moved to the Solid Oral Dosage Formulation Development group, where he currently works on preliminary market formulation product composition and process definition. In addition to PAT and formulation, he has expertise in multivariate data modelling, process control, optimisation, and hot melt extrusion technology.


