Article 4: Optimisation of the PCR step of a qPCR assay
Posted: 30 July 2009 | Tania Nolan, Global Manager of Applications and Technical Support, Sigma-Aldrich and Stephen Bustin, Professor of Molecular Science, Centre for Academic Surgery, Institute of Cell and Molecular Science, Barts and the London School of Medicine and Dentistry | No comments yet
The deceptive simplicity of a typical qPCR assay is an important reason for the exponential growth in the adoption of qPCR-related technologies for both research and diagnostic applications. The only requirements for obtaining ostensibly quantitative data are a mixing of primers, DNA and a mastermix, their distribution into individual tubes or wells, turning on a qPCR instrument and collection of threshold cycles (Cqs). Indeed, it is remarkably difficult to make a reaction fail completely but alarmingly simple to produce poor quality data1. Furthermore, it is of great concern that many ready-to-run commercially available systems adopt protocols that discourage the user from performing assay optimisation or validation steps, resulting in the publication of vast volumes of potentially meaningless data. Inevitably this has lead to inaccurate conclusions and publication retractions2,3. Consequently, assay optimisation, validation and critical data evaluation are essential practice if the integrity of the scientific study is to be preserved4.
The deceptive simplicity of a typical qPCR assay is an important reason for the exponential growth in the adoption of qPCR-related technologies for both research and diagnostic applications. The only requirements for obtaining ostensibly quantitative data are a mixing of primers, DNA and a mastermix, their distribution into individual tubes or wells, turning on a qPCR instrument and collection of threshold cycles (Cqs). Indeed, it is remarkably difficult to make a reaction fail completely but alarmingly simple to produce poor quality data1. Furthermore, it is of great concern that many ready-to-run commercially available systems adopt protocols that discourage the user from performing assay optimisation or validation steps, resulting in the publication of vast volumes of potentially meaningless data. Inevitably this has lead to inaccurate conclusions and publication retractions2,3. Consequently, assay optimisation, validation and critical data evaluation are essential practice if the integrity of the scientific study is to be preserved4.
The deceptive simplicity of a typical qPCR assay is an important reason for the exponential growth in the adoption of qPCR-related technologies for both research and diagnostic applications. The only requirements for obtaining ostensibly quantitative data are a mixing of primers, DNA and a mastermix, their distribution into individual tubes or wells, turning on a qPCR instrument and collection of threshold cycles (Cqs). Indeed, it is remarkably difficult to make a reaction fail completely but alarmingly simple to produce poor quality data1. Furthermore, it is of great concern that many ready-to-run commercially available systems adopt protocols that discourage the user from performing assay optimisation or validation steps, resulting in the publication of vast volumes of potentially meaningless data. Inevitably this has lead to inaccurate conclusions and publication retractions2,3. Consequently, assay optimisation, validation and critical data evaluation are essential practice if the integrity of the scientific study is to be preserved4.
Basic considerations
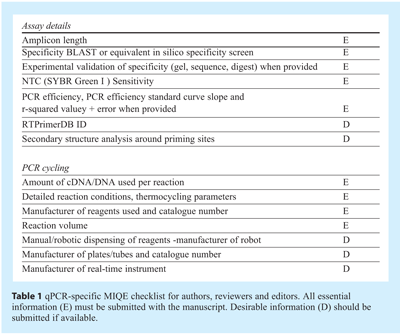
Robust and precise qPCR usually correlates with high PCR efficiency; consequently the eventual aim of assay optimisation is to obtain the highest efficiency possible qPCR assay. Detailed optimisation requires the consideration of a range of parameters: qPCR is sensitive to the standard of assay design and the input template as previously discussed5. As with conventional PCR, qPCR quality is also dependent on the concentration of reaction components, such as salts and oligonucleotides and different reactions display different degrees of instability. As such the established optimisation procedures adopted for PCR apply to qPCR. The effect of template quality and concentration was discussed in detail in article 1 and it is worth reiterating that, regardless of assay optimisation, variability at that level makes a huge contribution to data variability, in particular of RT-qPCR assays. Assay components such as buffer composition, salt concentrations, primer and probe concentration, as well as reaction conditions including primer annealing temperatures, incubation periods and even ramp rates can all be targets for optimisation. In addition, qPCR is subject to considerations concerning the fluorescent signal, especially when the aim is to design multiplex assays. In a system with multiple variables, each time an optimised condition is determined it is dependent upon the other factors in the reaction remaining stable. This can lead to endless rounds of optimisation procedures resulting in incremental improvements to some parts of the assay, but also in subtle deteriorations within other parts. Hence the degree of optimisation required for a given series of experiments must be assessed critically to ensure that the assay is optimised at the sensitivity and specificity required for any particular application. Clearly, optimal sensitivity is of primary importance when the aim is to quantify a transcript expressed at low level in single cells and the aim is to produce a linear reaction with high reaction efficiency such that estimates of template quantity can be made. In contrast, specificity is of the utmost importance when analysing SNPs, whereas sensitivity is rarely an issue. Since it has become apparent that variations in experimental protocols lead to highly variable data, it is essential to report all relevant experimental conditions and assay characteristics, i.e. the results of the optimisation procedures, when publishing qPCR results. This will enable other investigators to reproduce results and allow more reliable and unequivocal interpretation of data. This is further explained in the recently published MIQE guidelines1. This means determining amplification efficiency, linear range and accurate limit of detection and the extent of primer dimers or non-specific amplification are of particular importance for SYBR Green I assays (see Table 1). 

Amplification plots
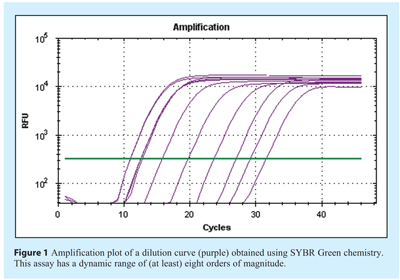
The characteristics of the amplification plot provide the first informative features of the quality of the reaction. This can be defined by a series of phases: The background noise of the detection system prior to sufficient amplification signal is recorded as the baseline, this is followed by a period of logarithmic amplification where the detected signal is correlated to increase in DNA concentration until the plateau phase is reached (see Figure 1). It is inaccurate to take data measurements close to the background noise of the system and so one method of analysis is to define a constant florescence intensity (threshold), correlating to a constant DNA concentration, and determine the number of cycles required to reach this threshold setting. Alternative systems are used to analyse the curve shape using a variety of algorithms that aim to predict the cycle at which a positive signal occurs. Over time each of these systems has been used to produce a cycle number used for quantification. It has been proposed that when communicating these values a common term is adopted, the Cq (referring to quantification cycle)1. 

Dilution curves
A well-optimised assay will be linear over a range of at least nine logs of template concentration, with efficiency close to 100% and high reproducibility between technical replicates. Amplification efficiency is best determined by generating a standard curve using serial dilutions of a template and determining the slope from the linear regression of a plot of Cq (y-axis) vs log [quantity]. The template maybe any suitable material such as cDNA, gDNA, PCR product or a synthetic DNA oligo manufactured for the purpose. The synthetic oligo option requires synthesis of an oligo that matches the sequence of the target amplicon. These artificial templates must be handled with extreme caution since these are highly concentrated targets that could potentially contaminate all oligos and reagents if handled carelessly. The advantage of using the synthetic oligos is that one synthesis is sufficient for several million reactions, thus providing a consistent positive control and it is possible to estimate a reasonable copy number value making comparison of different assays more reliable. In addition using a synthetic oligo as the control for optimisation and troubleshooting allows separation of template factors from assay features. In order to construct a standard curve using an artificial template, the oligo is resuspended to 100μM and then diluted through 2 x100 fold series to produce 10-4μM, which is suitable to use as the template for the highest concentration of the standard curve. This is then diluted through a 10fold dilution series to produce the template material for the remaining standard curve. (The higher concentration samples can be frozen in aliquots to provide almost a lifetime’s supply of ready to use template.) Analysis of the standard curve and in fact all qPCR data assumes that perfect doubling (or consistent amplification) occurs with each amplification cycle. Thus, the spacing of the fluorescence curves will be determined by the equation 2n = dilution factor, where n is the number of cycles between curves. For example, with a 10-fold serial dilution of DNA, 2n = 10. Therefore, n = 3.32 and the Cq values should be separated by approximately 3.32 cycles.
Amplification efficiency
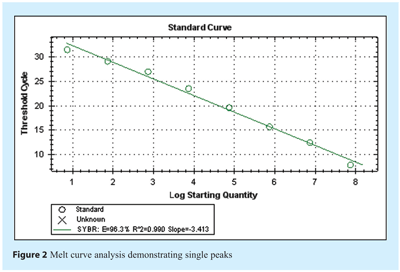
Amplification efficiency, E, is calculated from the slope of the standard curve using the formula: E = 10(-1/slope), which is usually converted into a percentage efficiency (% Efficiency = (E – 1) x 100%). In our example of the perfect scenario where doubling occurs at each cycle, E = 10-(1/-3.32) = 2 and the % Efficiency = (2 – 1) x 100% = 100%. In practice, amplification efficiency will be around 90-105% or result in a gradient of around -3.2 to -3.5 (see Figure 2 on page 16). Note that the presence of inhibitors can also result in an apparent increase in efficiency. This is because samples with the highest concentration of template also have the highest level of inhibitors, and therefore display a greater lag between Cq values than samples with lower template concentrations and lower levels of inhibitors. As a result, the absolute value of the slope decreases and the calculated efficiency appears to increase. Similarly inaccurate pipetting can lead to data suggestive of higher or lower efficiency and so it is important to assess the correlation coefficient in order to determine the linearity and reproducibility of the assay. During assay evaluation and optimisation, three technical replicates of each template dilution should be processed in parallel in order to establish that the assay is reproducible. A stable assay will demonstrate a correlation coefficient of R2> 0.98 over at least 6 logs and with 3 replicates. A reduced R2 value is one indication that the assay requires further optimisation although it may indicate poor pipetting technique, instrument uniformity or the presence of inhibitors in the sample. The linearity of the serial dilution defines the dynamic range of detection for the assay and only data within these limits are acceptable for experimental samples. Since the standard curve method assumes equal efficiency in all reactions, or provides an average assessment, a number of algorithms have been developed that use amplification plot characteristics as indicators of individual sample efficiency, thereby also providing a means to evaluate each sample individually. It appears that these have a lower sensitivity to the presence of inhibitors and so may not be as reliable as the standard curve approach. 

Assay specificity
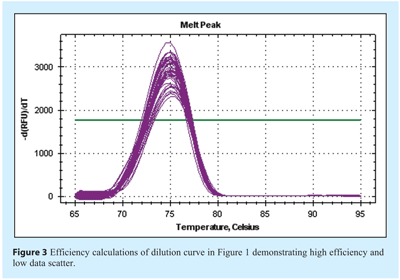
The specificity of the assay will contribute to the efficiency and reproducibility. In contrast to end point PCR assessment using agarose gel electrophoresis, all detectable products, be they specific or non-specific, contribute to the final amplification plot. This is more likely to be a problem when using a generic detection system such as SYBR Green I dye or universal probes, while specific probes are usually designed to detect only the target sequence. Hence, non-specific amplification and detection may result in an artificially raised quantification. The specificity of amplification can be validated by performing a post reaction melt analysis using SYBR Green I dye (see Figure 3). Products of differing size can be identified, albeit with low resolution with most instrument default settings. However, these are adequate for the identification of primer dimer products. Specificity is influenced by the ability of the primers to bind to non-specific target regions and for these to be extended. The composition of the buffer largely influences binding of primer to template. 

Buffer and sample considerations
Reaction buffers contain variations on a basic composition consisting of ammonium sulphate, Tris, EDTA, BSA, β-Mercaptoethanol, dNTPs, MgCl2, KCl, NaCl and DNA polymerase. The absolute optimum buffer composition is dependent upon the DNA polymerase used; different enzymes can affect PCR efficiency and therefore product yield. It is generally accepted that Taq DNA polymerase performs optimally in a basic buffer of 50 mM KCl and 10 mM Tris-HCl, pH 8.3, (measured at room temperature). Some enzymes have a requirement for added protein (BSA is usually added, when required). Although dNTPs are the standard substrate for DNA polymerases dUTP may be incorporated into qPCR reactions to provide target for subsequence contamination control steps using Uracil – N- Glycosylase to remove UTP containing templates from reaction mixes prior to amplification. In a standard reaction, the concentration of dNTPs is included in equimolar ratios, usually 200μM (or up to 500μM) of each dNTP. Many commercially available buffers may also contain PCR enhancers such as single stranded binding protein (SSBP), betaine, formamide, DMSO. The presence of detergent improves the activity of some enzymes, presumably by reducing aggregation. The salt concentration within the buffer affects the Tm of the primer – template duplex and is required for primer annealing. Concentrations of KCl or NaCl above 50mM can be inhibitory while MgCl2 is required as a cofactor for DNA polymerase. The most influential factor effecting free magnesium ions is the concentration of dNTPs in the reaction and so the magnesium ion concentration must exceed the dNTP concentration. Typical PCR reactions contain 1.5 mM magnesium chloride in the presence of 0.8 mM dNTPs resulting in approximately 0.7 mM free magnesium. Optimal MgCl2 concentration will differ for each primer/template and in qPCR reactions requiring digestion of the probe system the requirements are usually around 5mM. Optimisation results in significant differences in the efficiency of the reaction and in the yield of PCR product. However, this is one step where the experiment and technicalities may prevail. If the reactions are to be multiplexed then the optimal MgCl2 for all reactions is required and it is unlikely to be identical. Many commercial kits are supplied containing high levels of MgCl2, which makes optimisation impossible, but for very sensitive or specific requirements it is advisable to use a system that is amenable to modification. A qPCR template may be present at any concentration from a single copy to approximately 1011 copies. High concentration of template will inhibit the reaction resulting in reduced yield and inaccurate Cq differences between amplification plots, so inaccurate quantification. Low initial concentration can result in lack of detection of amplified product if the final yield is extremely low. In addition, in the absence of specific target, non-specific primer hybridisation, including primer dimerisation, may occur. Determination of the most appropriate target concentration from a cDNA sample may require the testing of several dilutions. As a guide; for a medium to highly expressed gene, including the equivalent of 0.5μl of a cDNA synthesis (from a total cDNA synthesis preparation of around 500ng total RNA in 20μl total reaction volume) in a 25μl PCR should be sufficient to see an amplification plot. An approximate copy number of a given target in gDNA can be determined using the approximation of the genome size of the organism and the average base pair mass of 650 daltons.
Primer optimisation
Primer optimisation serves to drive the kinetics of binding of the primers to the specific template sequence. Annealing is a kinetic result of the annealing temperature of the reaction and also the concentration of the primers. As a starting condition an approximation of annealing temperature can be made of around Ta (annealing temperature) ~ Tm (melting temperature) -5ºC3, taking the Tm for the primer with the lowest Tm. The Tm for a short oligo can easily be calculated by the approximation: Tm=4(number G + number C residues) + 2(number A + number T residues) However, applying the optimal Ta will result in higher specificity and yield. Using too low a Ta results in non-specific priming and too high a Ta results in inefficient priming and elongation. When this Ta fails, different temperatures must be tested in steps of 0.5ºC. Alternatively, a simpler option is to use a temperature gradient PCR block. For qPCR adjusting the annealing temperature can pose additional problems; when multiplexing all reactions will be run under the same cycling parameters, when using a linear, hydrolysis probe for detection the Taq is required to have active exonuclease activity and this is also temperature dependent with greatest efficiency of cleavage at 60°C. As an alternative, or in addition, primer concentration may be optimised using a primer concentration matrix in which all primer concentrations from 50nM to 600nM are tested against each other and the conditions producing the highest concentration of specific template are selected5. When optimising a multiplex reaction it is essential that each single reaction is of high quality (as defined above) before attempting to combine them. The single most important factor for multiplex success is the assay design (discussed in article 3 of this series) and it is recommended that a programme such as Beacon Designer is used since this will compare the compatibility of assays in silico. There are also commercial services that offer multiplex assay design such as that from Sigma-Genosys6. A serial dilution containing each of the targets is then interrogated with the assays in pairs. Any deviation from the original single assay indicates that the oligos are interfering. Optimisation may then include re assessment of oligo concentration, increase in MgCl2 and potentially in DNA polymerase. There are commercially available mastermixes for multiplex reactions. When these are selected the process of specific assay validation remains the responsibility of the scientist and it should not be assumed that the mixes are suitable for every combination of every conceivable assay.
Conclusions
qPCR remains the method of choice for RNA and DNA target quantification. The simplicity of the technology makes it attractive and available for most scientists and the rapid generation and attractive proposition. However, as with any technology it remains vulnerable to abuse or misuse. Only when the assays are well designed and well optimised is it likely that the data will be biologically meaningful.
References
- J.A. Garson, J.F. Huggett, S.A. Bustin, M.W. Pfaffl, V. Benes, J. Vandesompele, and G.L. Shipley, Unreliable real-time PCR analysis of human endogenous retrovirus-W (HERV-W) RNA expression and DNA copy number in multiple sclerosis. . AIDS Res. Hum. Retroviruses (2009) in press.
- T. Huang, H. Bohlenius, S. Eriksson, F. Parcy, and O. Nilsson, The mRNA of the Arabidopsis gene FT moves from leaf to shoot apex and induces flowering. Science 309 (2005) 1694-6.
- H. Bohlenius, S. Eriksson, F. Parcy, and O. Nilsson, Retraction. Science 316 (2007) 367.
- S.A. Bustin, V. Benes, J.A. Garson, J. Hellemans, J. Huggett, M. Kubista, R. Mueller, T. Nolan, M.W. Pfaffl, G.F. Shipley, J. Vandesompele, and C.T. Wittwer, The MIQE Guidelines: Minimum Information for Publication of Quantitative Real-Time PCR Experiments. Clinical Chemistry 55 (2009) 609-620.
- T. Nolan, R.E. Hands, and S.A. Bustin, Quantification of mRNA using real-time RT-PCR. Nature Protocols 1 (2006) 1559-1582.
- www.designmyprobe.com or [email protected]


