Article 3: qPCR Assay Design
Posted: 29 May 2009 | Tania Nolan, Global Manager of Applications and Technical Support, Sigma-Aldrich and Stephen Bustin, Professor of Molecular Science, Centre for Academic Surgery, Institute of Cell and Molecular Science, Barts and the London School of Medicine and Dentistry | No comments yet
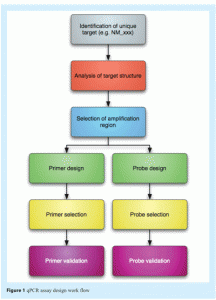
Real-time PCR (qPCR) data are reliable only if they result from a robust qPCR assay that has been carefully designed, validated and optimised. This process requires an extensive assay design procedure aimed at generating an optimum primer/probe/amplicon combination to allow accurate quantification of nucleic acids with minimum need for post-PCR analyses (see Figure 1).
Real-time PCR (qPCR) data are reliable only if they result from a robust qPCR assay that has been carefully designed, validated and optimised. This process requires an extensive assay design procedure aimed at generating an optimum primer/probe/amplicon combination to allow accurate quantification of nucleic acids with minimum need for post-PCR analyses (see Figure 1).
Real-time PCR (qPCR) data are reliable only if they result from a robust qPCR assay that has been carefully designed, validated and optimised. This process requires an extensive assay design procedure aimed at generating an optimum primer/probe/amplicon combination to allow accurate quantification of nucleic acids with minimum need for post-PCR analyses (see Figure 1). 

1. Know your target
As a first step, it is essential that the researcher is clear as to what his target(s) are; hence the more is known about the DNA or RNA of interest, the better. For example, when targeting mRNA, its database accession number (e.g. NM_001145852 for human prominin-1 transcript variant 4), the number of transcript variants (e.g. NM_001145851 prominin-1 variant 5, NM_001145850 prominin variant 6 etc), the location of SNPs and the presence of pseudogenes or related genes must be ascertained. Database mining assumes that the researcher is familiar with its nomenclature: e.g. sequences prefixed with NC_, NG_ are curated genomic sequences, NM_ is a curated mRNA sequence, whereas NT_ and NW_ are automated genomic and XM_ automated RNA sequences. If the purpose of the assay is to quantify an mRNA, there are numerous potential targets within the mRNA suitable for amplification; genotyping assays, on the other hand, place an obvious restriction on the position of the amplicon as it must include the site of the polymorphism or mutation. Additional complications arise from the presence of multiple splice variants or additional gene family members, and whether the assay needs to be able to distinguish between these. This is of particular importance when utilising qPCR as a diagnostic assay. Human papillomavirus (HPV) is the primary aetiological factor that transforms cervical epithelia into cancer. According to epidemiological case-control studies, 15 high-risk HPV types have been acknowledged, while three types have been designated as probable high-risk and 12 types have been classified as low-risk. Obviously, it is essential to distinguish these using appropriately designed assays. A BLAST search2 will identify all related sequences and a subsequent alignment of all the related sequences will permit the identification of regions that are unique to the target sequences of interest.
2. Consider the amplicon
In general, the shorter the amplicon, the more efficient the PCR assay as the reaction is driven towards doubling of the target at each cycle, ensuring a greater accuracy in quantification. Hence amplicons should be no more 150 base pairs in length range. Too short an amplicon, on the other hand (<60 bp), may result in difficulties differentiating amplicon from primer dimers in SYBR Green assays. Hence, the aim is to generate amplicons in the 60-80 base pair range. When comparing the relative expression of several genes of interest, it is advisable to designs amplicons of approximately equal lengths for comparative DDCq analysis, as this makes it more likely that the qPCR assays will be of similar efficiencies. Amplicons should always be checked for secondary structure3, as this is another important cause of reduced amplification efficiency. The GC content of amplicons should be as close to 50% as possible and the inclusion of Guanine repeats should be avoided.
3. Choose your primers well
Primers should not bind to secondary structures as the hybridisation kinetics of the annealing reaction will favour intramolecular binding and reduce priming efficiency. The annealing temperature requirements for qPCR primers are usually more stringent than for legacy PCR. Most assays are designed to run optimally under constant PCR conditions consisting of a brief 95°C melt followed by a single annealing and elongation step of 60°C for 1 to 60 seconds. qPCR primers should therefore be designed to hybridise optimally at 60°C, with no more than 1ºC between primer pairs. Since oligonucleotides are cheap, it is worth designing several primers for each assays and choosing the combination giving the lowest Cq and the least amount of primer dimer. Primer concentrations for SYBR I Green assays tend to be lower (100-200nM) than for probe-based assays (300-400nM). It should be remembered that primer concentration affects their Tm; hence annealing conditions may need to be altered when switching from one chemistry to another. It is undesirable to include repeats of the same base or palindromic motifs within the primer sequence, GC content is usually between 40-60%. The degree of clamping at the 3′ should be sufficient to secure hybridisation but not to promote non-specific priming. As a general guide aim for two of the five bases at the 3′ to be G or C; more than three tends to give poorer results. Primer dimers are avoided by rejecting primers with three or more base matches at the 3′ end and six bases or more matching within the rest of the primer. A measure of the Gibbs free energy (delta G) can be helpful to estimate structure stability. A highly negative value indicates a stable structure and so primers with negative self dimerisation scores are likely to form primer dimers. Similarly primers adopting a hairpin structure with a delta G value more negative than -9.0 should be rejected. At the very least the stem must not remain closed at the annealing temperature of the primer. Finally, try to keep the distance between the primer that hybridises to the same DNA strand as the probe as short as possible, as this prevents probe displacement.
4. Select your chemistry
Detection of qPCR products uses fluorescent labelling, either of the amplicon directly or by detection of a labelled probe. Direct labelling is via one of several DNA binding dyes, the most widely used one being SYBR Green. When free in solution, these dyes emit very low fluorescence whereas when bound to double strand DNA they adopt a conformational change that results in high fluorescence. SYBR Green chemistry is ideal for assay design and validation and, frequently, assays can be designed that are so sensitive and specific as to obviate the need for any probe. Probe-based detection systems include linear hydrolysis probes (“TaqMan”) that are labelled at the 5′ end with a fluorescent label and are quenched at the 3′. After elongation from the primer, the 5′ exonuclease activity of Taq displaces and cleaves the 5′ of the probe, releasing the label from the quencher. The 5′-nucleotide of a probe must not be a guanine, as this quenches probe fluorescence and impedes the assay’s sensitivity. Maximum hydrolysis probe length should be less than 25 base pairs, as quenching becomes less efficient and background fluorescence starts to rise, again compromising sensitivity. If necessary, primer Tm can be lowered, thus enabling shorter probes to be used. It is also best to choose a probe that contains more cytosines than guanines and there should be no more than three guanines in a row. The Tm of the probe should be 10ºC higher than that of the primers (around 68-70ºC), although it is perfectly possible to design assays where that rule does not apply. Alternative detection systems include Molecular Beacons4 in which the probe adopts a stem loop structure until it can hybridise to a specific target. In the structured conformation the 5′ label and 3′ quencher are held in close proximity. Upon hybridisation the stem opens and creates a physical distance between the label and quencher. When Taq with exonuclease activity is included in the reaction the Molecular Beacon is also cleaved. Scorpions5 are a combined primer and structure probe molecule. After elongation from the primer the template strand is displaced and the probe opens to detect the newly synthesised strand. Scorpions are extremely sensitive because the primer is covalently linked to the target and specific because the detection occurs after primer hybridisation and so the probe regions can be shorter than conventional probes. An alternative strategy to increase specificity by using a shorter probe is to incorporate nucleotide analogues such as Locked Nucleic Acids (LNA)6. LNA monomers consist of a modification to the ribose of an RNA nucleotide such that the ribose has an additional methylene bridge across the 2′ and 4′ carbons. This bridge locks the ribose into the 3′ endo conformation and when incorporated into DNA oligos, such as qPCR probes, results in an increased melting temperature making it possible to use a much sorter, more specific probe to target single nucleotide polymorphisms (SNPs), for example. Finally, another approach uses another nucleotide analogue, intercalating pseudonucleotides (IPN) that comprise flat (hetero) aromatic and hydrophobic molecules that stack on top of each other in the absence of a hybridisdation target, thus minimising the hydrophobic surface exposure to water7. This reduces background and increases sensitivity.
5. Use the appropriate software
There is numerous software packages designed to simplify qPCR assay design. Amongst the commercial packages, Beacon Designer8 (which is used to design all qPCR assays, not just Molecular Beacons) is outstanding. The associated package Allele ID also incorporates a function to select sequences from homology line-up plots. Alternatively there are free design services available from oligonucleotide synthesis companies, such as Biosearch9 that will provide a custom design to the specification of the experiment. It is also worth using Roche’s Universal Library10 and Promega’s Plexor (very good for multiplexing)11 design programmes to design assays, compare the results and choose a range of assays to validate. Finally, there are also commercially available assays but it is important to ensure that the assay sequences are available in accordance with new guidelines on the requirements for reporting qPCR assays1. In order to reduce the number of different assays targeting the same sequences, assays can be submitted or retrieved from a public database12. The database allows submission of data qualifying the quality of the assay, which will be described in the next article of this series. 

6. Validate your assay
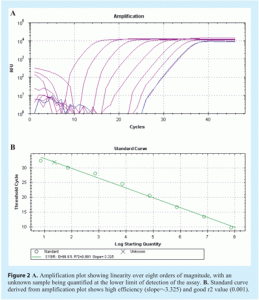
Since real-time quantification assumes a linear relationship between initial template quantity and the Cq value obtained during amplification, empirical assay validation is an integral and essential part of good assay design. Essentially, it means determining an assay’s amplification efficiency, its limit of detection and the extent of primer dimers, of particular importance for SYBR Green assays. The hallmarks of an optimised qPCR assay are:
- Linear standard curve (r2 > 0.980)
- High amplification efficiency (90-105%)
- Consistency across replicate reactions
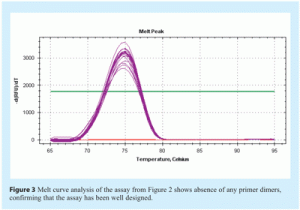
Amplification efficiency is best determined by generating a standard curve using serial dilutions of a template and determining the slope from the linear regression of a plot of Cq (y-axis) vs log [quantity] (see Figure 2 on page 28). If perfect doubling occurs with each amplification cycle, the spacing of the fluorescence curves will be determined by the equation 2n = dilution factor, where n is the number of cycles between curves. For example, with a 10-fold serial dilution of DNA, 2n = 10. Therefore, n = 3.32 and the Cq values should be separated by approximately 3.32 cycles. Amplification efficiency, E, is calculated from the slope of the standard curve using the formula: E = 10(-1/slope), which is usually converted into a percentage efficiency (% Efficiency = (E – 1) x 100%). In a perfect scenario, E = 10-(1/-3.32) = 2 and the % Efficiency = (2 – 1) x 100% = 100%. In practice, amplification efficiency will be around 90-105%. Together with the r2 value, which should be >0.98, this reveals how optimal the qPCR assay is and how linear the data are. Linearity, in turn, gives a measure of the variability across assay replicates and whether the amplification efficiency is the same for different starting template copy numbers. A significant difference in observed Cq values between replicates will lower the r2 value. Note that the presence of inhibitors can also result in an apparent increase in efficiency. This is because samples with the highest concentration of template also have the highest level of inhibitors, and therefore display a greater lag between Cq values than samples with lower template concentrations and lower levels of inhibitors. As a result, the absolute value of the slope decreases and the calculated efficiency appears to increase. Primer dimers are easily visualised using melt curve analysis (see Figure 3). 

Conclusions
Good assay design forms an integral part of any research project designed to quantify nucleic acids. It must be carried out with care, but can be carried out by following a straightforward workflow. Each new assay must be properly validated, and the results of this validation must be reported when qPCR data are published.
References
- Stephen Bustin, Vladimir Benes, Jeremy Garson, Jan Hellemans, Jim Huggett, Mikael Kubista, Reinhold Mueller, Tania Nolan, Michael Pfaffl, Gregory Shipley, Jo Vandesompele, Carl Wittwer. The MIQE Guidelines: Minimum Information for Publication of Quantitative Real-Time PCR Experiments. Clin Chem 2009 55:611-622
- (http://www.ncbi.nlm.nih.gov/blast/ Blast.cgi?PAGE=Nucleotides&PROGRAM=blastn&MEGABLAST=on&BLAST_PROGRAMS=megaBlast&PAGE_TYPE=BlastSearch&SHOW_DEFAULTS=on)
- (DNA: http://mfold.bioinfo.rpi.edu/cgi-bin/dna-form1.cgi; RNA: http://www.bioinfo.rpi.edu/zukerm/cgi-bin/rna-index.cgi)
- http://www.molecular-beacons.org/
- http://www.dxsdiagnostics.com/Site/ Content/dxs/Welcome.aspx?Z=17
- https://www.sigmaaldrich.com/life-science/custom-oligos/dna-probes/product-lines/lna-probes.html
- http://www.pentabase.com
- http://www.premierbiosoft.com/
- http://www.biosearchtech.com/products/ probe_design.asp
- https://www.roche-applied-science.com/servlet/RCConfigureUser?URL=StoreFramesetView&storeId=10 305&catalogId=10304&langId=-1&countryId=uk
- http://www.promega.com/techserv/ apps/qpcr/primer_design.htm
- http://www.rtprimerdb.org/


