Applying PAT in Chemical Process Development
Posted: 29 May 2009 | Mario Hellings, Scientist, Johnson & Johnson; Tom Van den Kerkhof, Senior Scientist, Johnson & Johnson and Koen De Smet, Senior Technology Engineer, Johnson & Johnson | No comments yet
As the time-to-market of pharmaceutical products has elongated, while its prices are under big pressure, cost saving is currently essential in the pharmaceutical industry.
As the time-to-market of pharmaceutical products has elongated, while its prices are under big pressure, cost saving is currently essential in the pharmaceutical industry.
As the time-to-market of pharmaceutical products has elongated, while its prices are under big pressure, cost saving is currently essential in the pharmaceutical industry.
Therefore, the manufacturing of pharmaceutical products is forced to change to a more efficient and qualitative production. Since the introduction of the PAT guideline in September 2003, even regulatory environment is driving the industry to change their manufacturing from a Quality by Inspection to a Quality by Design state, which has led to quality improvements and cost savings in other industries. Within the concept of Quality by Design, Process Analytical Technology (PAT) is a powerful tool for achieving an optimal manufacturing process. The main goals of PAT are to gain a thorough understanding of the manufacturing processes and to learn how to control them1. When processes are understood, opportunities for continuous improvement (quality and efficiency), cycle time reduction, cost reduction and QC lab test replacement arise. In this article, the strategy of Johnson & Johnson Pharmaceutical Research & Development (J&J PRD) towards the implementation of PAT in Chemical Process Development is explained and clarified by case studies.
Strategy
The first step in understanding and controlling a process is to make it more visible. This implies that analysers, which measure critical chemical and physical characteristics with a fast response time, are required. These analysers can be used for in-line (in the process), on-line (bypass on the process) or at-line/off-line (near the process / in the lab) measurements. In-line measurements are preferred, as they provide a continuous and real-time view of the entire process. In addition it eliminates manual sample handling and therefore reduces operator errors, improves safety and retains sample integrity. J&J PRD utilises a four stage approach to implement PAT for chemical and pharmaceutical processes.
In the first stage, a process analyser is employed and in-process samples are taken, which are analysed in the lab with traditional analytical methods, like liquid chromatography, Karl Fisher titration, etc.. During this stage, process knowledge is increased, allowing to optimise the process and even to define the design space. For new products this is a standard approach which is combined with design of experiments, where also the critical to quality attributes are identified. For existing products, PAT is applied either as a problem solving tool (e.g. drying case) or when the cost of the old process is too high (e.g. cleaning case). In this stage, the signal of the PAT tool is challenged by the lab analysis of the in-process samples.
In the second stage, the optimised process is continuously monitored with the PAT tool, while the product or equipment is released by the lab analysis of the final sample with an official validated analytical method. During this stage, the performance of the PAT tool and the robustness of the optimised process are evaluated. A decision is made whether or not to apply PAT for further batches (e.g. up-scaling, commercial batches, etc.) and to transfer it from R&D to manufacturing. Although manufacturing used to demand a robust optimised process without PAT, their position is changing as they start to see the benefits of PAT as a control tool or monitoring tool. Considering the amount of batches in R&D and manufacturing, it has a large added value to have PAT within manufacturing.
In the third stage, decisions with regard to the product are made based on the signal of the PAT tool. Therefore, the PAT tool indicates the right quality of the product and allows firstly to finish the process – instead of using a fixed time period – and secondly a real-time release. At this point, it can be considered that the QC lab is brought to the process.
The fourth stage includes the ultimate goal of PAT, real-time control of the processes. This implies that processes are steered by the PAT signal, and that each batch is delivered with the right quality product in the most efficient way. In order to achieve this, the effect of each process parameter needs to be known. In this stage, process validation evolves to the validation of the process parameters, which control the entire process.
Case Studies
Reaction monitoring
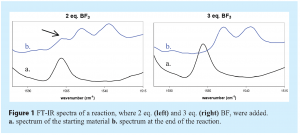
The synthesis of an API includes several reaction, crystallisation and purification steps. Within R&D the optimal synthesis path – concerning yield, number and cost of steps – needs to be developed. Applying PAT techniques, like in-line FT-IR spectroscopy and even on-line HPLC, helps us to obtain a scientific understanding and allows us to design a robust API synthesis in a very short time period. For the reaction (depicted in Figure 1) in-line FT-IR spectra of the reaction mixture immediately indicate that the addition of two equivalents of BF3 is insufficient for the complete transformation, while the addition of an extra equivalent will deliver a good yield. Without applying PAT, this information would only be available after the reaction, when the product is crystallised and dried. PAT can also be used as a control tool. The FT-IR signal can be seen as an “on-line titration” method to dose the exact amount of reagent as function of yield and quality optimisation2.

Depending on the criticality, the PAT application can be used to support scale-up, to fine tune test batches and can be transferred from R&D to manufacturing, where it will be used as a quality and / or process control tool. Quality control allows endpoint determination and real-time release (stage 3), e.g. continuous verification that the unwanted intermediates or side products are below the specification3. By process control (stage 4), the process is steered using real-time measurements. For example, during solution cooling crystallisation processes, real-time in-line FT-IR measurements of the supersaturated liquid allow a continuous adjustment of the cooling temperature and can be verified by Focussed Beam Reflectance Measurements4,5.
Centrifugation/Filtration processes
One of the basic steps in the development of API is the solid/liquid separation executed after a crystallisation/precipitation step. The solid/liquid separation exists of a centrifugation/filtration step, followed by a wash step to remove the mother liquor and impurities from the product cake. Most times, a historically grown fixed amount of solvent is used during the wash step, with limited knowledge of scaling up this process. The wash step is often considered a critical to quality process step since an inadequate wash step results in low quality (contaminated) product. Applying too much wash solvent always results in a high waste production and can also result in product loss, thus implying a significant cost. PAT is applied to the wash step to determine the most optimal amount of wash solvent required, resulting in high quality product and avoiding cost by reducing waste and product loss.
The mother liquor and wash step can involve aqueous and/or solvent solutions. A pH-probe, a conductivity probe and a UV immersion probe are applied to monitor the entire wash process. This combination allows us to monitor acid/base replacement, ion washing (salts), solvent replacement (because of differences in UV cut-off), product loss and even possible impurities.
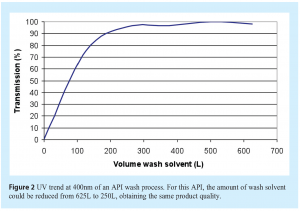
For example, the wash process of an API in manufacturing used 625L wash solvent. Monitoring of the wash process with the PAT tools (see Figure 2) showed that the same product quality is obtained, when the amount of wash solvent is reduced to 250L.

Drying
After separating solid from the liquid phase and washing, the wanted product is further dried towards specifications. As drying processes can take up to several days, continuous monitoring with endpoint (dryness) detection, can have a big impact on the capacity of commercial manufacturing. In some cases, simple temperature measurements of the gas and solid phase in a dryer are already sufficient to determine the drying endpoint. In other cases, monitoring the exhaust gas with mass spectroscopy is necessary to control the drying process.
For a spray-dried product the initial post-drying time was set at 72h, which meant that only 80% of the required capacity could be reached by the production site. In this particular case the process was further investigated by performing several boundary experiments at the production site itself. During these experiments samples were taken at different time points and analysed by off-line gas chromatography, while mass spectroscopy delivered a continuous and real-time view on the composition of the exhaust gas. Although the mass spectroscopy drying profile could not be quantitatively related to the gas chromatography results, it could still be used to determine the endpoint of the drying process. The mass spectrometer can be used as a pass / fail test, i.e. dry or not dry. Therefore, the applied N2 carrier gas flow needs to be controlled and a limit value, based on a worst case batch, needs to be put on the mass spectroscopy drying profile. As a result of these experiments, the drying time was reduced to 48h, which led to a capacity increase of 35% and to obtain the required commercial capacity. Based on the expectation that the drying time can be further reduced, in a second phase of the project the mass spectrometer is used for commercial batches, and a sample is taken – and verified with lab analysis – at exactly the same time as the mass spectrometer indicates dryness. The first results already indicate that the drying time can be further reduced to approximately 32-34h for commercial batches. At the moment, it’s being discussed to either keep a fixed (reduced) drying time or a variable drying time based on the mass spectroscopy results. In both cases, the final release of the product will be based on a lab analysis.
Equipment cleaning
Most of the equipment in chemical units, used to develop and produce API, is multi-purpose equipment. Since cross-contamination is potentially harmful for the patient, cleaning processes are necessary and critical in our API manufacturing. Cleaning processes within chemical units consist of a number of manual and/or automated steps mainly involving the use of solvents and sometimes detergents. Dependent whether spray balls, pump systems or complete CIP systems are in place different cleaning concepts exist. Spray balls are used in once-through flows, recycling flows or combined flows. Equipment without spray balls (mostly old equipment) is mainly cleaned with solvent reflux and solvent/detergent fill-up/stirring steps. In practice, the cleaning processes are usually based on historical upgraded processes, lacking an integrated scientific approach. As a result, these cleaning processes are very time-consuming and expensive. By applying PAT to cleaning, the cleaning processes can be scientifically fully understood. As a consequence, these processes can be optimised and controlled resulting in faster and cheaper processes of a better quality which are less harmful for the environment6.
The use of solvents prohibits the use of TOC and conductivity for monitoring of the cleaning processes. Since most active pharmaceutical ingredients possess a strong UV absorption, UV spectroscopy was chosen as the PAT tool. With UV, solvent as well as detergent steps can be monitored. Additionally, as some detergents have an absorption in the deep-UV region, the removal of detergents can be monitored as well. For this application double-beam diode-array UV analysers, equipped with solarisation resistant fibers are applied. Dependent on the cleaning concept, these fibers are coupled to a flow-cell, which is placed in- or on-line to the cleaning flow, or to an immersion probe which is directly inserted in a reactor vessel.
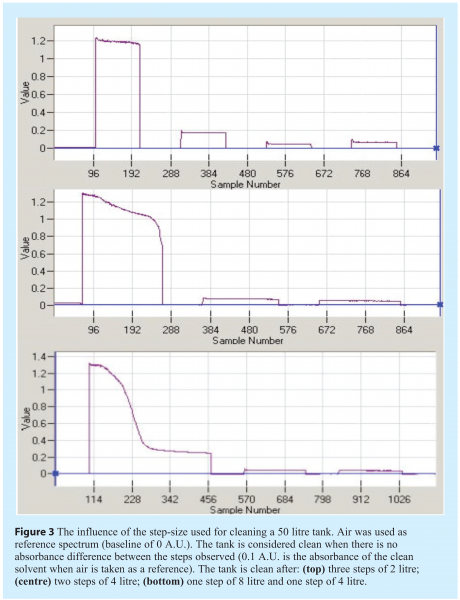
These set-ups allow an immediate evaluation of parameters like step-size (see Figure 3), spray-pressures, temperature effects, spray-times for each spray ball, recycling times, soaking effects, holding times, reflux sequence and timings, stirring times etc.. Therefore, the most optimal cleaning process is created, which can be applied in cleaning validation (i.e. on a worst-case compound) or in routine monitoring (i.e. all compounds).

For real-time release, the residual between the spectrum and a reference spectrum (clean solvent) is calculated and the cleaning process stops when the residual reaches a pre-set minimum level.
Conclusion
In general, applying PAT within J&JPRD has delivered more insight in the processes and reduced the product development time. Introducing PAT has led to a high degree of innovation, as new technologies are applied, while existing technologies are applied in a new way (in-line). Therefore, more relevant data was generated and a more robust scientific background for process optimisation was obtained. By immediately evaluating the effect of process parameters on the product, quality improvements were obtained. In that way, not only the most optimal process could be defined, but also more robust and flexible processes could be achieved. From a financial perspective, applying PAT has led to significant cost reductions due to cycle time, solvent and waste reductions. By applying optimised processes, with cycle time reduction, the capacity of the manufacturing site was increased. Reduction of the solvent and waste had also a big environmental impact as less waste needed to be combusted or purified.
Acknowledgement
Implementing PAT requires the expertise of many people. Therefore, we want to thank all the people within J&J, who contributed to the successful introduction of PAT in the company.
References
- U.S. FDA, “Guidance for Industry: PAT – A Framework for Innovative Pharmaceutical Development, Manufacturing, and Quality Assurance”, (2004).
- Horváth A., De Smet K., Ormerod D., Depré D., Prez-Balado C., Govaerts T., Van den Heuvel D., and Schorpion I., “Development of the One-Carbon Homologation of a 4-Methylcoumarin Assisted by In-Line FTIR”, Org. Process Res. Dev., 9 (3), 356-359, (2005).
- De Smet K., van Dun J., Stokbroekx B., Spittaels T., Schroyen C., Van Broeck P., Lambrechts J., Van Cleuvenbergen D., Smout G., Dubois J., Horváth A., Verbraeken J., and Cuypers J., “Selectivity Control by Use of Near-IR for a Hydrogenation Process”, Org. Process Res. Dev., 9 (3), 344-347, (2005).
- Liotta V., and Sabesan V., “Monitoring and Feedback Control of Supersaturation Using ATR-FTIR to Produce an Active Pharmaceutical Ingredient of a Desired Crystal Size”, Org. Process Res. Dev., 8 (3), 488-494, (2004).
- Wiss J., Lnzlinger M., and Wermuth M., “Safety Improvement of a Grignard Reaction Using On-Line NIR Monitoring”, Org. Process Res. Dev., 9 (3), 365-371, (2005).
- Hellings M. and Vanbaelen H., “The Application of PAT for Cleaning and Cleaning Validation”, American Pharmaceutical Review Issue July/August, (2008).


