The Data Cave: A collaborative method for interpreting genomic data
Posted: 20 March 2009 | Holly Hilton, Senior Principal Scientist, Roche; Windy Berkofsky-Fessler, Postdoc, Roche and Charu Kanwal, Principal Scientist, Roche | No comments yet
Generating knowledge and insight from complex genomic data sets is always a challenging endeavor. As data collection becomes more routine and less expensive, and the existing body of data expands, getting the most out of genomics experiments requires ever more expertise and insight. Here, we discuss our method of integrating gene expression profiling data for a candidate oncology drug with pre-existing data and the knowledge and expertise of a wide variety of biologists and statisticians.
Generating knowledge and insight from complex genomic data sets is always a challenging endeavor. As data collection becomes more routine and less expensive, and the existing body of data expands, getting the most out of genomics experiments requires ever more expertise and insight. Here, we discuss our method of integrating gene expression profiling data for a candidate oncology drug with pre-existing data and the knowledge and expertise of a wide variety of biologists and statisticians.
Generating knowledge and insight from complex genomic data sets is always a challenging endeavor. As data collection becomes more routine and less expensive, and the existing body of data expands, getting the most out of genomics experiments requires ever more expertise and insight. Here, we discuss our method of integrating gene expression profiling data for a candidate oncology drug with pre-existing data and the knowledge and expertise of a wide variety of biologists and statisticians.
A current genomics lab often has access to a wide variety of genomics techniques, including expression profiling via qRT-PCR, mRNA microarrays, and miRNA microarrays; gene knockdown via siRNA and miRNA mimics; a number of pathway tools, and statistical/visualisation programs. In addition, public sources of data and years of accumulation of in-house data allow additional insight. Incorporating these types of data is now standard in drug discovery programs for target identification, mechanism of action studies, toxicity analysis and biomarker discovery.
Translational Biomarkers
Despite these increases in capabilities, other hurdles remain, and drug discovery itself remains a long and arduous undertaking. In oncology research, a novel drug often begins with the goal of targeting a specific biological process. The development of this biological concept into a safe and effective new treatment is lengthy and marked by many potential pitfalls, any one of which may terminate the project. Effective pharmacodynamic biomarkers, which would show that a dose-responsive drug affects the targeted processes in spite of a lack of clinical response, could play a valuable role, given that phenotypic response is often not expected in the disparate set of patients involved in an oncology phase I trial. These biomarkers could keep a promising project active until the later stages of clinical trials, when efficacy can be best determined.
As an example, we focus here on our process of biomarker identification for a novel CDK inhibitor for the treatment of solid tumours and leukemia1. We conducted multiple preclinical microarray experiments and sought an effective process for selecting genes for further testing. We identified, through analysis of three different preclinical models, a total of 26 potential biomarkers of drug action, and tested their validity in clinical trial blood samples by quantitative real-time PCR. Our data indicates that eight of the preclinically selected genes behave as predicted and hold promise as dose-responsive pharmacodynamic biomarkers for Phase II monitoring.
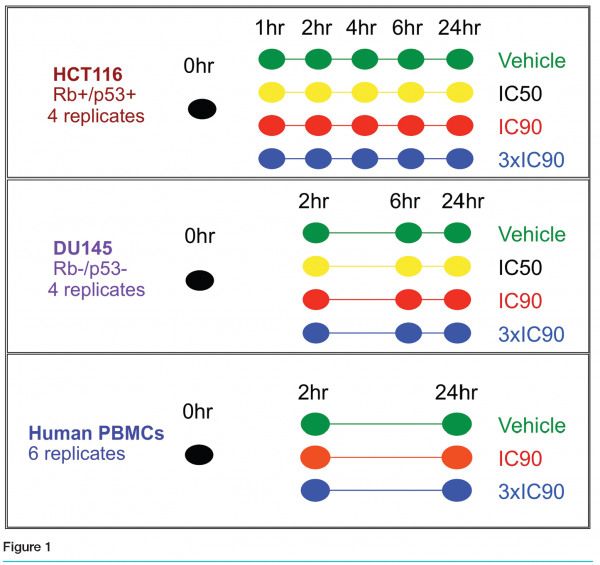
The preclinical studies encompassed two different human cell lines, HCT116 (colon cancer) and DU145 (prostate cancer), as well as primary human peripheral blood mononuclear cells. The first experiment was conducted in the HCT116 cell line and included six time points (see Figure 1). Quadruplicate cultures were grown in the presence of no treatment, vehicle, the IC50, IC90 or 3xIC90 dose for 0, 1, 2, 4, 6, or 24 hours. As the 2, 6 and 24 hours time points were most informative, the DU145 experiment included only those time points. For the human PBMC study we used true biological replicates: six different donor samples were treated with vehicle, the IC90 or the 3xIC90 doses for 2 or 24 hours. An additional donor sample was divided into triplicates as our untreated control.

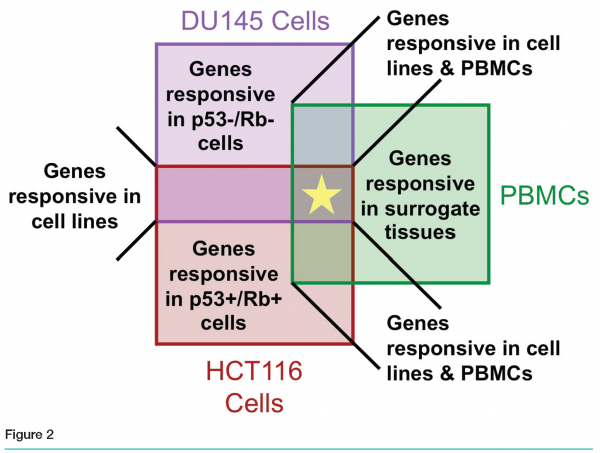
Affymetrix GeneChip® results revealed fewer than ten genes differentially regulated by our compound in all three models. Thousands of genes were modulated in DU145, hundreds in HCT116, and fewer than one hundred in PBMCs. Various degrees of overlap were observed between pairs of sets (see Figure 2).

Once we had amassed this substantial amount of data, we reached the critical stage of the entire process. We needed to recommend a limited number of genes that could serve as pharmacodynamic biomarkers. There was no standard process in place, and several issues made it difficult for a single scientist to analyse the whole data set. No one person had the full range of expertise required: experience in the preclinical project itself, knowledge of the chemistry of the compound, familiarity with the planned clinical trials, and a full understanding of surrogate pharmacodynamic biomarkers, genomics processes, bioinformatics and statistics. However, we realised that combining many sources of data and many types of experts could generate the needed knowledge.
The Data Cave
We assembled a multidisciplinary team, with experts from Preclinical Oncology, Clinical Oncology, Development, Biomarkers, Genomics and Bioinformatics, along with real-time interactive access to the project-related data, baseline pre-existing genomics data and pathway information. These experts gathered to discuss and rank genes in what we named our “data cave”. The goal of the data cave was to leverage the combined expertise of the assembled group to review all aspects of the data so as to produce a short list of genes for further evaluation in samples from the phase 1 trial. Prior to the data cave, gene lists were pared down to fewer than 100 by a smaller working group. This list, as well as pertinent information regarding experimental design and results, was incorporated into a booklet that was provided to all participants.
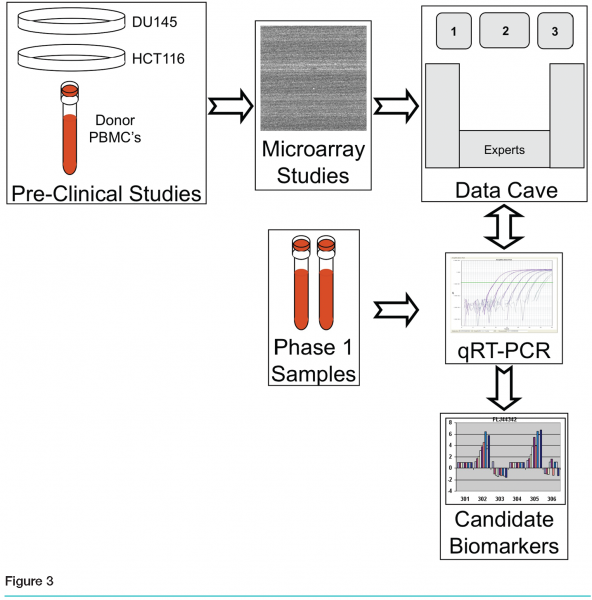
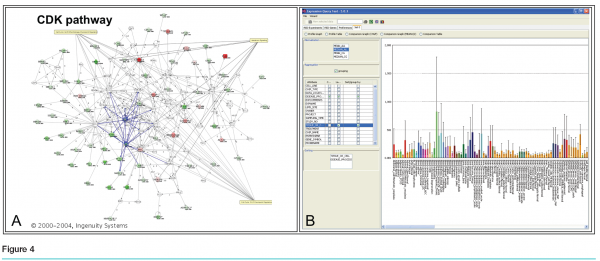
Each gene on the list was considered in turn, with data projected interactively on three screens. (see Figure 3) Screen 1 showed general information about the gene, including the gene name, a short description, classification of cellular activity, observed modulation, and three graphs containing the results from the two treated cell lines and the PBMCs. Also displayed was the level of expression of each gene in the blood of cancer patients, based on data from a blood expression database created in-house. Screen 2 had a live link to the Ingenuity Pathway Analysis tool (Redwood City, California) so that pathways containing the gene could be explored in real time as needed by the group (see Figure 4a). The third screen had a live link to the Roche Expression Database, housing data from all high quality in-house and select public-domain Affymetrix profiling experiments (see Figure 4b. This allowed the display of each gene’s expression level in various tissues and cell types, disease states and treatments. This screen was also used for general or literature searches on the internet or to view the gene ranking list, containing the group’s comments and notes, which were generated during the meeting.


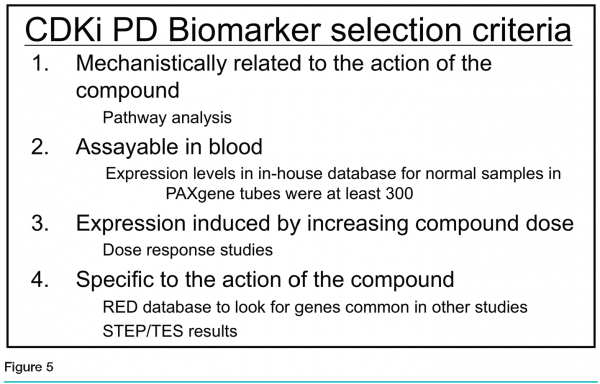

The team ranked the genes based on the following four criteria (see Figure 5):
Mechanistic relationship to the action of the compound, based on literature and pathway analysis
Measurable expression in blood, based on the PBMC dataset and whole blood samples in the Roche Expression Database
Dose-responsive expression
Specificity of regulation in response to the CDK inhibitor, when compared to other compound studies in the Roche Expression Database
Genes were given rankings from 1 to 4 by general consensus. For example, if a gene met all criteria and was well-characterised, it received a high mark; if it was a “favourite” of a particular participant but did not meet all criteria, it was ranked lower. Top-ranking genes were then selected for further follow-up. An effort was made to cast a wide net and choose genes with different preclinical patterns; as a result, the genes selected were not always the most obvious choices from either a statistical or biological perspective. The final number chosen was dictated by the amount of material and resources available for further testing; in our case, the top 26 were chosen for analysis in the human patient samples.
The accompanying clinical study involved patients with confirmed advanced solid tumours or chronic lymphocytic leukemia or refractory lymphomas. Other key eligibility and exclusion criteria have been previously reported (in submission). Drug was dosed intravenously on day one and day eight every 21 days. Blood was drawn from each patient just prior to injection of drug, three hours after the completion of injection and 24 hours after the start of the injection on both days one and eight. The trial was a multiple ascending dose study with three patients per cohort and seven cohorts.
The 26 top-ranked genes were then quantified in the patient blood samples, using qRT PCR. A variety of measures were used to assess the robustness and quality of the measurements, including average Ct level, range of technical triplicates, the directionality of the expression change as measured by Affymetrix arrays and qRT-PCR, and the level of significance of any changes in expression of the endogenous control gene as compared to that of the target gene. Genes with questionable results were omitted from further consideration.
Of the 26 genes profiled in the patient blood samples, eight revealed clear statistically significant dose-dependent response to drug treatment. Eight others showed partial response, and the remaining genes were unresponsive. The top performers were somewhat surprising. For example, our best gene had a beautiful stepwise increase in expression as drug dose increased. It had been chosen not based on its function but on high blood expression level and reasonable fold change in PBMCs. This gene was the only one of the top eight to come exclusively from the PBMC data, while another favourite gene had a similar preclinical pattern but did not show a response in patients. Three of the most responsive genes in the clinical samples were top hits in all three of the preclinical experiments, while the four remaining top hits were only derived from the two cell line experiments. This suggests that use of a wide variety of preclinical models is the most effective way to identify predictors of response in patient blood samples. Additionally, one of our top eight genes, which showed a highly significant dose dependant increase in patient blood samples, was a poorly annotated gene with no associated literature. This gene did not interest the oncologists, but was included because the pre-clinical expression pattern caught the attention of the genomics experts.
We found many benefits to the data cave format for the selection of potential biomarkers. We wanted to leverage the combined wisdom of a variety of experts in distinct fields, each of whom brought a somewhat different knowledge base and bias to the table, to produce a more rounded list of genes for follow-up. In fact, the top hits chosen by the group and the eight that were strongly confirmed in the clinic, would not have all been chosen if the selection had been done by a team focused only on fold change, a known link to oncology or a good pattern in the pre-existing data. We found this technique fosters better communication between diverse job functions allowing otherwise excluded parties to become participants in the preclinical science. By involving these people from an earlier stage, we engendered more ownership of the project and its results. Additionally, a data cave spreads the risk of gene selection and its potentially expensive follow up experiments amongst a larger group instead of leaving the onus on one or a handful of people.
The major drawback to holding a data cave for selection of potential biomarkers is the logistical aspect. It is a time-consuming process requiring extensive preparation, adequate meeting space and computer facilities for proper display of the data, as well as involvement of more scientists than our typical selection process. Perhaps most important is the requirement for a forceful and fair personality to lead the session so as to keep the discussion focused and productive. However, despite these limitations, this process produced a fruitful list of potential biomarkers for follow-up and everyone involved enjoyed the process and team atmosphere.
We have employed data caves on other major projects since this first one and have found it to be a productive method of gene selection, requiring somewhat less time for preparation as our familiarity with the process progresses. Using the data cave process produced a diverse list of potential biomarkers to test on our limited clinical samples, and revealed a group of genes that effectively predicted response to the CDK inhibitor. The data cave proved to be an effective way to create knowledge and decisions from complex genomic data sets.
Reference
- DePinto, W., et al., In vitro and in vivo activity of R547: a potent and selective cyclin-dependent kinase inhibitor currently in phase I clinical trials. Mol Cancer Ther, 2006. 5(11): p. 2644-58.


