Can calorimetry provide accurate estimates of long‑term stability for monoclonal antibodies?
Posted: 3 September 2019 | Dr Ernesto Freire - Johns Hopkins University | No comments yet
Differential scanning calorimetry (DSC) has been one of the most widely used techniques to characterise the temperature stability of monoclonal antibodies (mAbs) and provide important information in formulation optimisation. However, despite its widespread use, not all the information contained in DSC data, especially denaturation kinetics, is routinely extracted. In this article, Ernesto Freire addresses this issue.
THE fasted growing segment in the pharmaceutical industry is biologics (protein drugs), especially mAbs. Traditionally, biologics have been administered intravenously in clinical settings since they are not orally bioavailable.
However, the enormous growth of biologics has triggered the need for patient self-administration in the form of subcutaneous injections. Since typical mAb doses range between 1 and 3mg/kg, formulations of up to 200mg/ml are not uncommon. At these extremely high concentrations (for comparison, albumin concentration in serum is only 35–50mg/ml) denaturation and aggregation tendencies are exacerbated. Accordingly, identification of the mAbs characterised by the lowest tendency to denature/aggregate and the formulations that minimise those tendencies are of extreme importance.
A calorimetric approach
DSC measures the temperature dependence of the heat capacity function (Cp) of a protein solution. Unlike other techniques, DSC provides accurate differentiation of the different domain contributions to the denaturation process (Fab, CH2 and CH3 domains). Unfortunately, the temperature denaturation of mAbs is irreversible and conventional equilibrium thermodynamic analysis cannot be applied. Irreversible transitions are kinetically and not thermodynamically controlled. For that reason, DSC data of mAbs has mainly been used to report midpoint denaturation temperatures (Tm) or onset temperatures (Tonset) and infer potential stability trends based solely on Tm or Tonset .1
The scarcity of more complete studies is surprising since rigorous methods to analyse irreversible denaturation transitions in terms of kinetic rate equations have been available for several years after the pioneering work of Sanchez-Ruiz.2-4
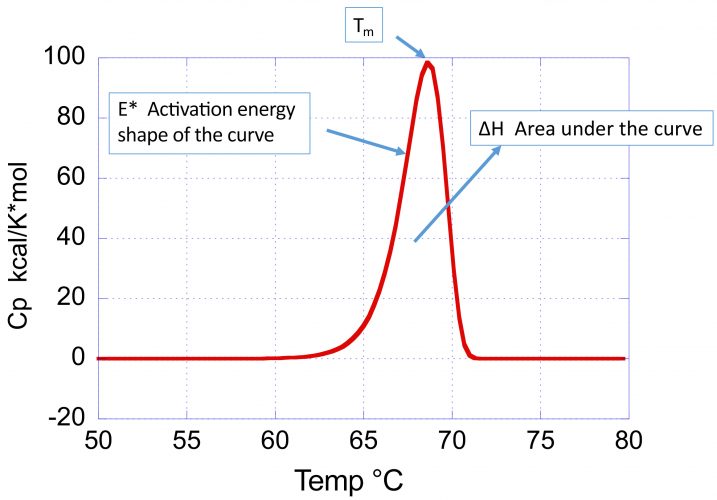
Figure 1: Typical DSC profile (heat capacity versus temperature) for an irreversible thermal denaturation transition. Notice that the curve is asymmetrical towards the low temperature end. The shape of the curve reflects three parameters: 1) the Tm, defined as the maximum in the heat capacity function; 2) the enthalpy change, ΔH, given by the area under the curve; and 3) the activation energy, E*, that defines the sharpness and skewness of the curve. The smaller the activation energy, the broader the curve and the higher the asymmetry towards the low temperature end.
A rigorous kinetic analysis not only provides Tms but, importantly, the denaturation rates and activation energies – two critical parameters for estimating the long-term stability of mAbs at lower temperatures. Unlike earlier analysis methods that required several DSC scans obtained at different rates, modern kinetic deconvolution algorithms using non-linear least squares allow determination of the rates of denaturation/aggregation and their temperature dependence (activation energies) from a single DSC scan.
DSC of mAbs
Figure 1 illustrates the parameters, describing the position and shape of a DSC profile associated with an irreversible denaturation transition:
- the transition temperature (Tm) defined as the maximum in the heat capacity
- the enthalpy change or area under the curve
- the activation energy (E*), which determines the sharpness and skewness of the curve.
A large activation energy defines a sharp denaturation curve, whereas a low activation energy defines a shallow and more pronounced skewed curve. The denaturation rate at different temperatures is estimated by the kinetic deconvolution. Within the context of optimising conditions that maximise long-term stability, the importance of the activation energy cannot be underestimated as it determines the temperature dependence of the denaturation rate constant. The larger the activation energy, the faster the decrease in rate of denaturation/aggregation at lower temperatures and consequently the better long-term stability. High Tm and large E* is the preferred combination to maximise low temperature stability.
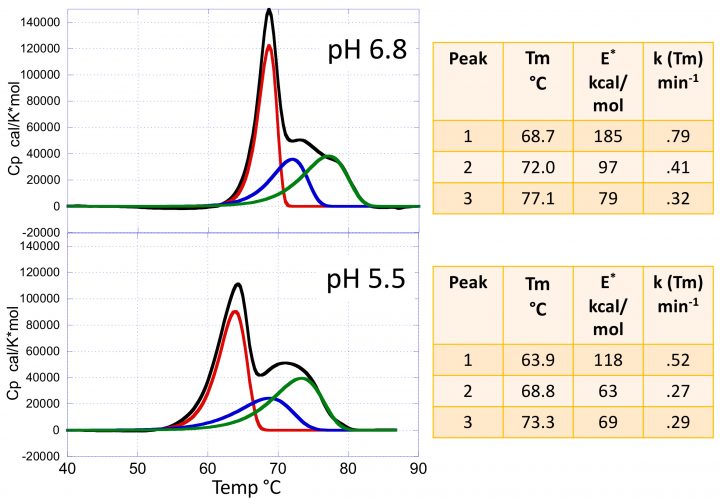
Figure 2: The heat capacity versus temperature profiles for the mAb VRC07 at pH 5.5 and 6.8. The figures also show the results of the kinetic deconvolution to three transitions. Increasing the pH from 5.5 to 6.8 not only increases the Tm of the transitions but also their sharpness and, consequently, their activation energies as shown in the insets.
Figure 2 shows typical DSC scans of the HIV‑1- neutralising mAb VRC07 (see reference 3 for a complete discussion) determined at pH 5.5 and pH 6.8. The data are composed of three transitions corresponding to the Fab, CH2 and CH3 domains. These transitions are irreversible; ie, a re-scan of the same sample does not yield any transition. In the past, the thermal denaturation of mAbs has often been analysed using the equilibrium models that come pre-packaged with the instrumentation software. Using those models, however, is not only incorrect but often produces misleading information since the equilibrium curves are rather symmetrical, while irreversible transition curves exhibit a significant asymmetry towards the low temperature end. Most importantly, an equilibrium model does not estimate the denaturation rates and activation energies. Figure 2 also shows the results of the kinetic deconvolution of the data into three irreversible transitions. It is evident that increasing the pH from 5.5 to 6.8 not only increases the Tm of the three transitions but also increases the sharpness of the profiles. A sharper transition curve is an indication of a higher activation energy. As shown in the figure, the kinetic deconvolution performs a fit of the overall curve to a sum of irreversible transitions. Non‑linear least squares analysis is used to estimate the number of transitions and the best set of kinetic parameters for each transition. For the example, increasing the pH from 5.5 to 6.8 increases the Tm of each peak as well as the activation energies, as shown in the figure.
Activation energy is the critical factor for long-term stability
Figure 3 illustrates the effects of pH on the rate of denaturation of the main peak, corresponding to the Fab domain.
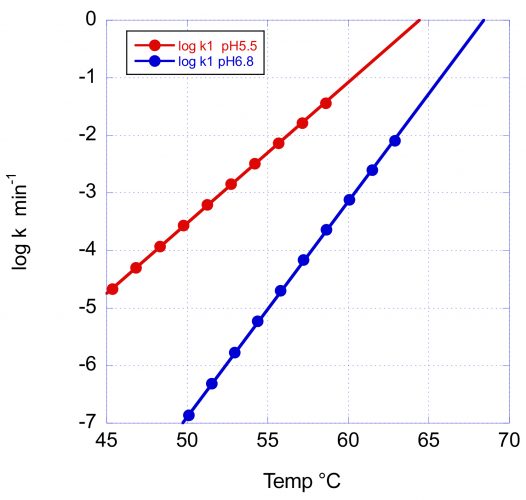
Figure 3: The temperature dependence of the denaturation rate for the main Fab transition of VRC07 at pH 5.5 and pH 6.8. In addition to the increase in Tm with pH, the larger activation energy at pH 6.8 causes a faster rate decrease and, consequently, a better long-term stability at low temperature.
In this figure, the logarithm of the rate in min-1 has been plotted as a function of temperature. At the scanning rate of these experiments (1°/min) the denaturation rates at Tm are essentially the same (0.8 and 0.5min-1); however, the rate of decrease with temperature is very different, as expected from the different activation energies. At 60°C and pH 6.8, the reported denaturation/aggregation rate measured isothermally3 is 1.8 days-1, which compares favourably with the average rate of 2.1 days-1 estimated from the DSC scan. At 50°C, the denaturation rate at pH 6.8 is expected to decrease faster and be close to three orders of magnitude slower than at pH 5.5. The difference between pH 5.5 and pH 6.8 is expected to be further amplified at lower temperatures due to the larger E* at pH 6.8.
The situation gets more complex at lower temperatures as we consider the smaller peaks that usually originate from the CH2 and CH3 domains. These peaks have smaller activation energies and their rates are not expected to decrease as quickly at lower temperatures. In fact, at some crossover temperatures they have faster rates than the main transition and are expected to have the highest propensity to denature/aggregate.
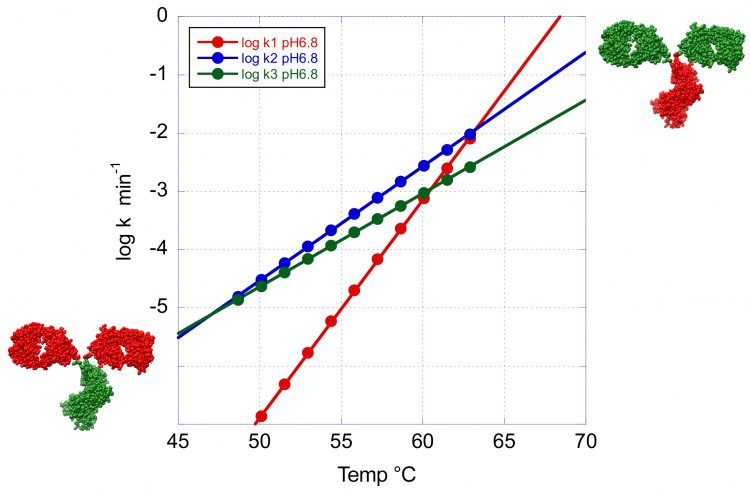
Figure 4: The temperature dependence of the denaturation rates for the three transitions of VRC07 at pH 6.8. This figure clearly illustrates the crossover temperature at which the minor peaks have a faster denaturation rate than the main peak. At high temperature the Fab region shown in green has the faster denaturation rate whereas at low temperature the order is reversed and the CH2 and CH3 domains now shown in green denature faster.
This situation is illustrated in Figure 4 where the logarithm of the denaturation rates for the three peaks observed at pH 6.8 have been plotted as a function of temperature. Below 63°C the denaturation rates for the second and third transition become faster than at the main peak and this situation is amplified at lower temperatures. Incidentally, below 45°C, the transition with the highest Tm becomes the one with the fastest denaturation rate. These results have important implications for the development of formulation strategies for long-term stability. At low temperatures, the overall rate of denaturation/ aggregation needs to be extremely slow. In fact, an acceptable formulation should produce fewer than five percent aggregates over one year. However, depending on the magnitude of the activation energy, the denaturation order at low temperatures (4 or 25°C) is not necessarily the same as the one observed during temperature denaturation. The identification of the domains responsible for denaturation/aggregation at low temperature is a critical piece of information for the development of optimised formulations that differentially affect specific domains.
DSC contains more mAb stability information than the techniques currently used. With the recent development of novel kinetic deconvolution software, it can be expected that denaturation rates and activation energies, in addition to Tm values, will play an important role in antibody selection and formulation optimisation.
Acknowledgments
Rajoshi Chaudhuri and Lisa Kueltzo from the Vaccine Research Center/NIAID, National Institutes of Health kindly provided VRC07.
About the author
Dr Ernesto Freire is the Henry Walters Professor at the Johns Hopkins University in the US. He is a world-recognised expert in biological thermodynamics. He performs research relating to the thermodynamics of protein stability, protein‑protein interactions and protein-ligand binding. He has pioneered the development of drug design and optimisation strategies using thermodynamic techniques. Ernesto has developed new thermodynamic approaches for the characterisation of long-term stability and formulation optimisation of biologics. He is the author or co-author of over 260 publications and 15 patents.
References
- Brader ML, Estey T, Bai S, Alston RW, Lucas KK, Lantz S, Landsman P, Maloney KM. Examination of Thermal Unfolding and Aggregation Profiles of a Series of Developable Therapeutic Monoclonal Antibodies. Mol. Pharmaceutics 2015; 12: 1005−1017.
- Sanchez-Ruiz JM, Lopez-Lacomba JL, Cortijo M, Mateo PL. Differential Scanning Calorimetry of the Irreversible Thermal Denaturation of Thermolysin. Biochemistry 1988; 27: 1648-1652.
- Sanchez-Ruiz JM. Theoretical analysis of Lumry-Eyring Models in Differential Scanning Calorimetry. Biophys. J. 1992; 61: 921-935.
- Freire E, van Osdol WW, Mayorga OL, Sanchez-Ruiz JM. Calorimetrically Determined Dynamics of Complex Unfolding Transitions in Proteins. Annu. Rev. Biophys. Biophys. Chem. 1990;19: 159-188.
- Clarkson BR, Chaudhuri R, Schon A, Cooper JW, Kueltzo L, Freire E. Long Term Stability of a HIV-1 Neutralizing Monoclonal Antibody Using Isothermal Calorimetry. Analytical Biochemistry 2018; 554:61-69.
Issue
Related topics
Antibodies, Biopharmaceuticals, Bioprocessing, Bioproduction, Calorimetry, Therapeutics