Exploring new sources of raw material
Posted: 20 May 2005 | | No comments yet
Raman spectroscopy using excitation in the near infrared allows non-destructive Raman analyses of pharmaceutical products as well as of plant or animal tissues. This radiation excites only minimal fluorescence of the samples or impurities and has only minimal photo-physical and photochemical activity. Raman analysis of plants allows the efficient exploration of new sources of raw materials for phytomedicinal drugs.
Raman spectroscopy using excitation in the near infrared allows non-destructive Raman analyses of pharmaceutical products as well as of plant or animal tissues. This radiation excites only minimal fluorescence of the samples or impurities and has only minimal photo-physical and photochemical activity. Raman analysis of plants allows the efficient exploration of new sources of raw materials for phytomedicinal drugs.
Raman spectroscopy using excitation in the near infrared allows non-destructive Raman analyses of pharmaceutical products as well as of plant or animal tissues. This radiation excites only minimal fluorescence of the samples or impurities and has only minimal photo-physical and photochemical activity. Raman analysis of plants allows the efficient exploration of new sources of raw materials for phytomedicinal drugs.
Raman spectroscopy uses light scattering by molecules. When a molecule is illuminated by monochromatic radiation with the frequency νO, a dipole moment in the molecule is induced, having the same frequency νO. The magnitude is proportional to the molecular polarisability and consequently the molecule emits radiation at this frequency; the so-called Rayleigh scattering.
When a molecule vibrates, its polarisability can be modulated with the frequency of the vibration, nS. As a consequence the molecule emits a modulated wave, the Raman scattering.
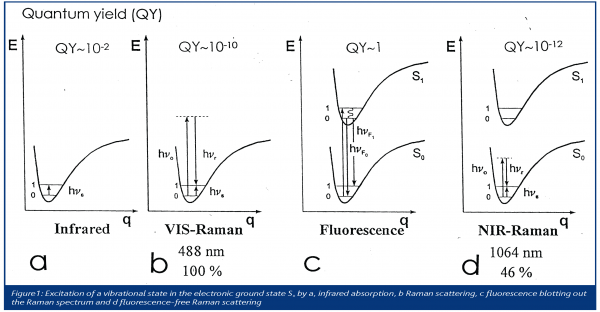
In Figure 1 typical potential curves of molecules are shown. They describe the energy needed to stretch the bonds by the amount q. In Figures 1a and 1b, two energy levels of a molecular vibration are shown: the ground level ‘0’ and the level of the excited vibration ‘1’. When illuminated with infrared radiation (Figure 1a), a molecule can absorb quanta of this energy difference hnS to excite the vibrational level ‘1’. The infrared spectrum displays as absorption bands the frequencies νS of the ‘infrared active’ vibrations.
But there is another way to excite the vibration (Figure 1b): when a molecule is illuminated with radiation of higher energy hnO, e.g. from the visible range, the molecule reaches a virtual state from which it may also reach the excited vibrational level, however, the surplus energy is emitted: hνO – hνS: the Raman radiation. A Raman spectrometer usually displays the frequencies νS of the ‘Raman active’ vibrations.
The different ‘IR’ or ‘Raman’ activities of the vibrations provide information about the molecular structure. They give a unique ‘fingerprint’ of analyte molecules: any change of its structure concerning bond distribution, bond order or bond angles is documented by a change of the frequencies or intensities of the individual vibrational spectrum.
When a molecule has absorption bands in the visible range, it may absorb the exciting radiation used in customary Raman spectroscopy and change from the electronical ground state So to an electronical excited state S1. It reaches the ground state by emitting fluorescence radiation hνF, Figure 1c. Unfortunately, the quantum yield of this process is several orders of magnitude larger than that of the Raman process. This means that the very strong fluorescence radiation completely blots out the Raman spectrum, making it invisible.
A solution to this problem is to reduce the energy of the exciting radiation to a level that is insufficient to excite the electron system of the molecule (Figure 1d). This is why exciting radiation at a wavelength 1064 nm is used. Its quantum energy is less than 50% compared to the quantum energy of the Argon laser radiation at 488 nm. Consequently, Raman spectroscopy performed in such conditions usually shows no fluorescence and allows one to conduct non-destructive measurements.
Another advantage of Raman spectroscopy is that it requires little or no sample pre-treatments compared to infrared spectroscopy, where the sample must usually be prepared in a thickness suitable for a transmission measurement of infrared radiation.
The spectra shown in this publication were recorded with the FT-Raman-Spectrometer BRUKER RFS 100, predecessor of the present RAM II.
Non-destructive analyses by Raman spectroscopy
A non-destructive analysis must fulfil the following conditions:
- No mechanical decomposition
- No chemical decomposition
- No photochemical decomposition
- No photo-physical decomposition
- No thermal decomposition
Excitation of Raman spectra with radiation of the wavelength 1064 nm together with appropriate spectrometers and sample facilities fulfils these conditions optimally1-3. Several modifications of ‘classical’ Raman spectrometers allow analyses in small recording times: Multiple reflection sample arrangements enhance the intensity of the exciting radiation and especially that of the collected Raman radiation. Using interferometers instead of dispersive spectrometers for recording the Raman spectra enhances, due to its ‘Jacquinot advantage’4, the recorded intensity by about two orders of magnitude compared to ‘classical’ dispersive spectrometers.
Raman analysis of plants
Since all plant and animal cells contain enzymatic machinery, which absorbs radiation in the visible range and consequently emits strong fluorescence, analysis of Raman spectra with excitation by visible radiation in most cases is not possible. However, using excitation with radiation at 1064 nm permits the analysis of animal tissues and plants, the identification of natural compounds and the mapping of its distribution.
Ferdinand Bohlmann has, by a wide margin, been the most productive of all chemists dealing with natural substances in higher plants5,6. He has discovered polyacetylenes in many plants, especially in various species related to the Compositae and Umbelliferae families.
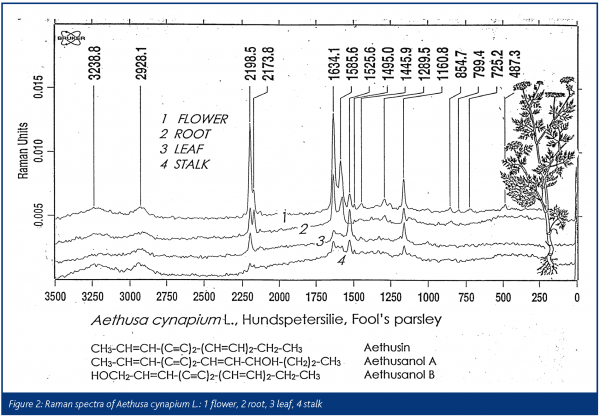
Bohlmann desribed the polyacetylenes in ‘fool’s parsley’ as extremely poisonous, almost as much as the hemlock7. As seen in Figure 2 the Raman spectra show polyacetylenes with their characteristic triple bond vibrations near 2200 cm-1; different compounds of this chemical group can be located in the root, the flower and the leaves of fool’s parsley.
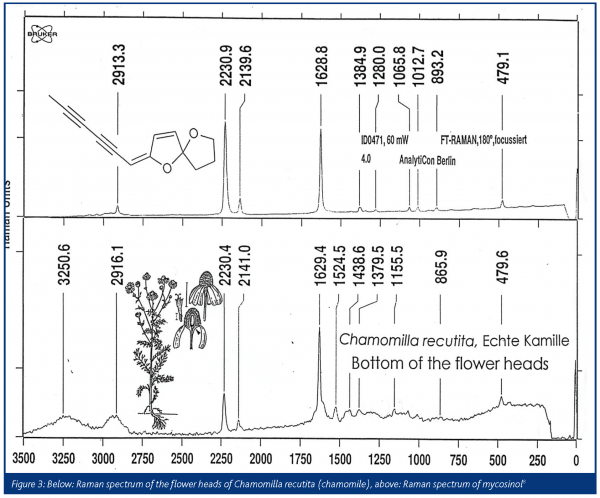
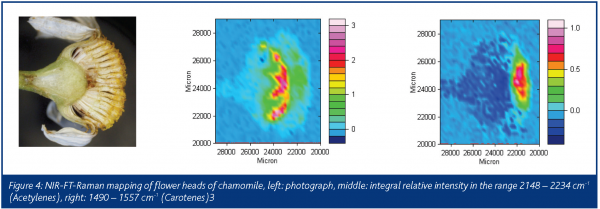
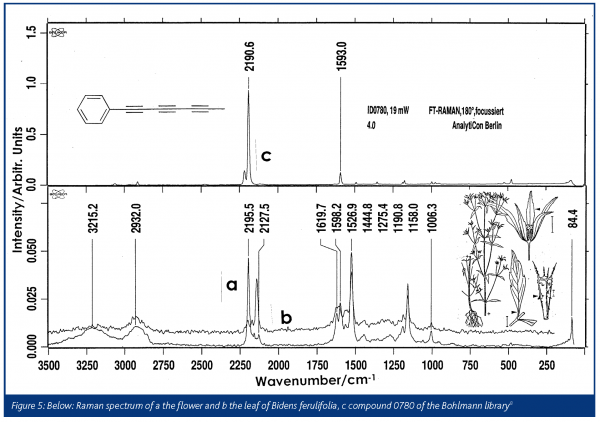
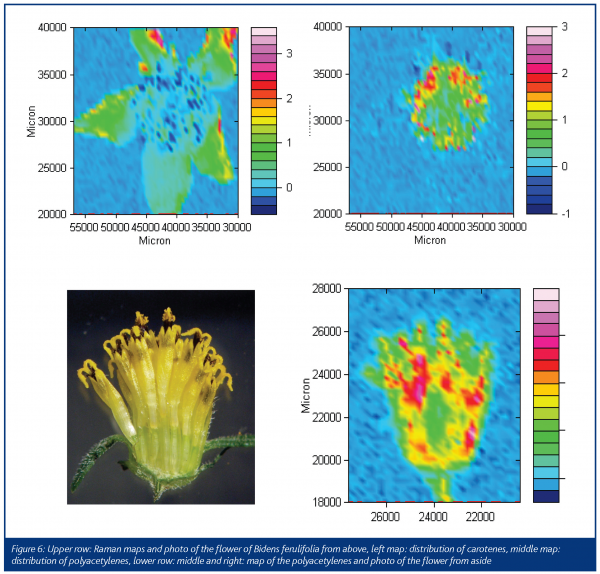
Fortunately, former co-workers of Bohlmann have recorded the Raman and infrared spectra of the samples, which survived in the collection of the samples synthesised by Bohlmann. A library of the infrared and Raman spectra of 1505 natural samples in plants, together with their structural formulas is now available8.The flower heads of chamomile show the spectrum of mycosinol, which is nearly identical to the spectrum from the Bohlmann library (Figure 3). A special sample arrangement allows for mapping the distribution of natural products in plants. In Figure 4, the Raman images of chamomile inflorescence are presented. Integration in the range of the triple bond stretching mode (2148-2234 cm-1) demonstrates that mycosinol is accumulated in the bottom of the flower head. Contrary to that, the carotenoid bands occur at 1525, 1156 and 1004 cm-1 and prove that these compounds are mainly present at the ends of the tubular parts of the blossom3,9. Generally, blue colours in the maps represent low concentrations, whereas the red colours represent higher concentrations. Recently, the usefulness of Raman spectroscopy for in situ studies of several carotenoids that occur ubiquitously in the plant kingdom has been demonstrated10. The measurements obtained for several fruits, vegetables as well as aromatic and medicinal plants show that cis-trans isomerisation of carotenoids during processing can be easily registered and different 7-, 8- and 9-double bond conjugated carotenoids can be analysed independently in the same sample according to their different key band positions.Various species of the genus Bidens, such as B. pilosa L. and B. campylotheca Schultz Bip., are widely used in Chinese medicine. Several polyacetylenes occurring in Bidens species have been identified and seem to be responsible for antimalarial activity and antimicrobial properties. A spectrum from the Bohlmann collection is quite similar to the spectrum recorded from the flower of Bidens ferulifolia, which is predominantly known in Europe as a horticultural plant (Figure 5). In Figure 6, we see photographs from the blossom of B. ferulifolia L. from above and from the side together with the mapping of carotenes (left maps) and polyacetylenes (middle maps). The red dots from the mapping of the flower from above show that the carotenes are especially present in the petals, whereas the red dots in the maps in the middle show that the polyacetylenes occur mainly in the stamen.
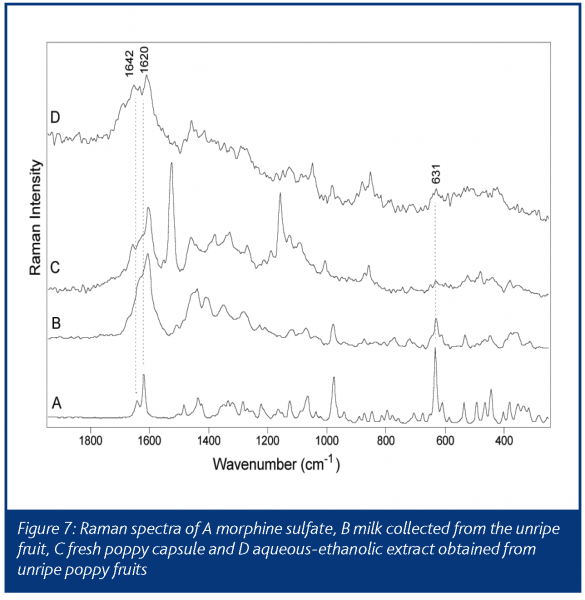
Figure 7 shows the Raman spectra of pure morphine sulfate, milk obtained from the unripe fruit, a fresh poppy capsule and an aqueous-ethanolic extract produced from an unripe fruit of Papaver somniferum11.
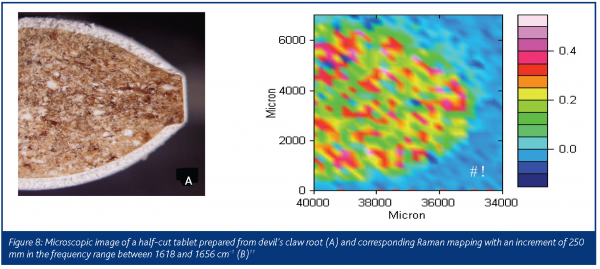
Raman spectroscopy was also successfully applied to identify and quantify harpagoside, the main active principle in the secondary roots of devil’s claw (Harpagophytum procumbens). Figure 8 presents the microscope image of a half-cut tablet prepared from devil’s claw root (A) and the corresponding Raman mapping in the frequency range of 1618 to 1656 cm-1 relating to key signals of harpagoside12.
These examples show that Raman analyses of plants are useful in biochemistry and for exploring new sources of raw materials for the phytopharmaceutical industry. Mapping studies give the option to determine the distribution of the compounds of interest and may provide the information which part of the plant contains the highest concentration of the individual active substance. Therefore, this technique helps the breeders to select high-quality plants and the farmers to predict the optimal harvesting time. Artefacts as a consequence of sampling procedures and clean-up are avoided.
Other applications
We can readily demonstrate that Raman spectroscopy is a powerful tool in medical diagnostics: identification of tumours, of skin lesions without the necessity of a biopsy and micro-organisms13-15. This is in accordance with a recent paper describing mapping of the Raman spectra of fresh lung tissues16, which allowed a clear distinction between normal and cancerous states. The results demonstrate the feasibility of 1064 nm Raman spectroscopy for in vivo, non-invasive and molecular-level clinical diagnosis of diseases including cancers. An excitation at 785 nm failed to detect any Raman bands because of an extremely high fluorescence background.
Of special interest is the possibility to analyse the content of ampoules without the necessity to open them17. This can be used for the control of the stability of samples under irradiation or heating.
The exciting radiation at a wavelength of 1064 nm used in FT-Raman spectroscopy has such a small photo-physical activity that polymorphs or the components of photochemical reactions can be studied without the danger to produce phase transitions or chemical reactions2.








References
1. Andreev, G.N., Schrader, B., Schulz, H., Fuchs, R., Popov, S., Handjieva, N., ‘Non-destructive NIR-FT-Raman analyses in practice, Part I. Analyses of plants and historic textiles’, Fresenius J Anal Chem 371, 1009-1017, (2001)
2. Andreev, G.N., Schrader, B., Boese, R., Rademacher, P., von Cranach, L., ‘Non-destructive NIR-FT-Raman analyses in practice, Part II Analyses of ‘jumping’ crystals, photosensitive crystals and gems’, Fresenius J Anal Chem 371, 1018 – 1022 (2001)
3. Baranska, M., Schulz, H., Rösch, P., Strehle, M.A., Popp, J., Identification of secondary metabolites in medicinal and spice plants by NIR-FT-Raman microspectroscopic mapping Analyst 129, 926-930 (2004)
4. Schrader, B. (ed) ‘Infrared and Raman spectroscopy, methods and applications’, VCH Weinheim (1995)
5. Winterfeld, E., ‚Ferdinand Bohlmann (1921-1991) und sein wissenschaftliches Werk’, Liebigs Ann. Chem., I-XXXIV, (1994)
6. Bohlmann, F. and Sucrow, W., ‚Natürlich vorkommende Acetylenverbindungen’, in: Moderne Methoden der Pflanzenanalyse, Springer Verlag Berlin (1963) pp. 82-108
7. Bohlmann, F., Arndt, C., Bornowski, H., Herbst, P., ‚Polyacetylenverbindungen, XXVI. Die Polyine aus Aethusa cynapium L.’, Chem. Ber. 93, 981 – 987 (1960)
8. Nature IR and Nature Raman Digital Spectral Library, Version 1.0, Bruker Optik GmbH, D-76275 Ettlingen, Germany (2000)
9. Schrader, B., Schulz, H., Baranska, M., Andreev, G.N., Lehner, C., Sawatzki, J., ‚Non-destructive Raman analyses – Polyacetylenes in plants’, Spectrochim. Acta Part A (2005), in print
10. Schulz, H., Baranska, M., Baranski, R., ‚Potential of NIR-FT-Raman Spectroscopy in Natural Carotenoid Analysis’, Biopolymers 77, 212 – 221 (2005)
11. Schulz, H., Baranska, M., Quilitzsch, R., Schütze, W., ‚Determination of alkaloids in capsules, milk and ethanolic extracts of poppy (Papaver somniferum L.) by ATR-FT-IR and FT-Raman spectroscopy’, Analyst, 129, 917-920 (2004)12. Baranska, M., Schulz, H., Siuda, R., Strehle, M.A., Rösch, P., Popp, J., Joubert, E., Manley, M., ‚Quality Control of Harpagophytum procumbens and Its Related Phytopharmaceutical Products by Means of NIR-FT-Raman Spectroscopy’, Biopolymers 77, 1-8 (2005)
13. Schrader, B., ‚Die Möglichkeiten der Raman-Spektroskopie im Nah-Infrarot-Bereich’, Chemie in unserer Zeit 31, 229-234; 270–279 (1997)
14. Fendel, F., Schrader, B., ‘Investigation of skin and skin lesions by NIR-FT-Raman spectroscopy’, Fresenius J Anal Chem 360, 609 – 613 (1998)
15. Schrader, B., Dippel, B., Erb, I., Keller, S., Löchte, T., Schulz, H., Tatsch, E., Wessel, S., ‘NIR Raman spectroscopy in medicine and biology: results and aspects’, J Mol Struct 480-481, 21-32 (1999)
16. Min, Y-K., Yamamoto, T., Kohda, E., Ito, T., Hamaguchi, H., ‘1064 nm near-infrared multichannel Raman spectroscopy of fresh human lung tissues’, J. Raman Spectrosc. 36, 73-76 (2005)
17. Schrader, B., ‘Chemical Applications of Raman Spectroscopy’, Angew. Chem. Internat. Edit. 12, 884-908 (1973)


