Implementation of trending charts in analysis of inventory pattern
Posted: 23 April 2021 | Mostafa Eissa (Cairo University) | No comments yet
Information is king – and real-time data regarding material stock movements is essential for effective inventory management. Here, Mostafa Eissa from Cairo University demonstrates the use of statistical processing control techniques for monitoring material mobility and how this could benefit the pharma industry.

Introduction
Inventory management in the industrial field is crucial for the control of goods in warehouses. Monitoring the patterns and trends of material flow and traffic is useful to assess the dynamic weight of the item’s stock. Observation of the process behaviour in a timely manner could be rendered fast and effective in the modern healthcare field, notably the pharmaceutical industry, using network communication between different processing sectors in organisations’ facilities.1 This would enable the material mobility database to be updated regularly. The final step is the statistical processing of the dataset through Statistical Processing Control (SPC) techniques using a statistical software platform.2 The following case study illustrates the dynamicity of medicinal material between point of delivery at a quarantine area in a warehouse and final disposition. From this study, an inventory shipment dynamicity index was adopted. The investigation will integrate the combined analysis of commercial statistical software platforms including GraphPad Prism v 6.01 for Windows and Minitab® v 17.1.0.3 Inventory control is an important and integral part of the total quality management (TQM) for any successful organisation in the world of competitive industry.
Segmental analysis of Immunosuppressive Disease‑Modifying Antirheumatic Drug (DMARD): a worked case investigation
Preliminary statistical analysis and data visualisation
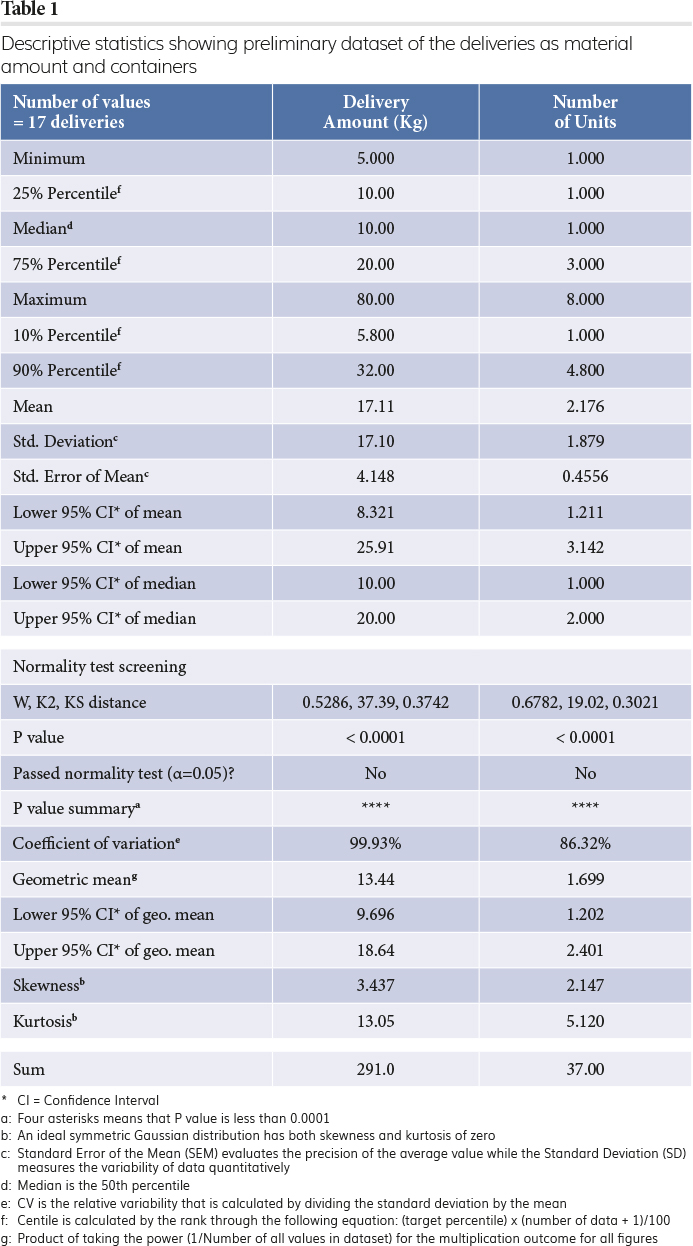
Immunosuppressive Disease-Modifying Antirheumatic Drugs (DMARD) are a group of unrelated drugs that are used to slow down rheumatoid arthritis (RA) progression, in addition to other conditions such as inflammatory arthritides, including ankylosing spondylitis (AS) and psoriatic arthritis (PsA).4 These drugs include methotrexate, hydroxychloroquine and auranofin (Gold salt). Data concerning this group of drugs were arranged chronologically and examined preliminarily using a statistical programme to yield column statistics; as seen in Table 1. Results showed apparent skewness of the dispersion involving truncation pattern. Thus, the dataset failed to show evidence of a Gaussian distribution shape. The maximum exceptional amount of shipped material was identified as a single batch using robust regression and outlier removal methodology (ROUT) (Q = 1.000 percent) due to additional demand for the material. The average amount of received item was 17.11kg ± 17.10 which ties in container units at r(Spearman) = 0.6293 with a 95 percent confidence interval between 0.1981 and 0.8564 and P (two‑tailed) of 0.0095. Most deliveries are small quantities with an amount of 10kg or less per reservoir in almost half of the shipments. The contour plot in Figure 1 demonstrates the zone pattern as the number of reservoir units in relation to time and amount of the material, showing a solitary point of the high delivery amount. On the other hand, the Pie chart in Figure 2 illustrates the rate of conformance and non-conformity based on the inspection and analysis of the material.
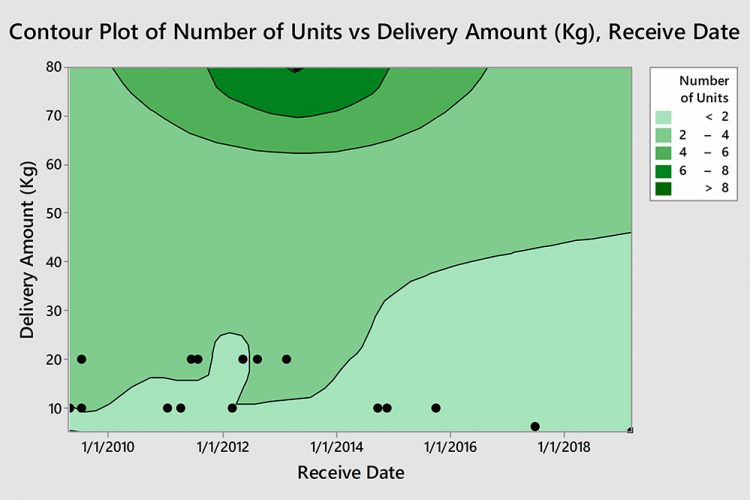
Figure 1: Contour diagram showing shipment arrival, amount (in Kg) and reservoir count relationship.
Process-behaviour charts and the monitoring of inventory mobility
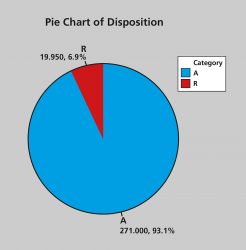
Figure 2: Pie chart showing acceptance (A) and rejection rates (R) from the total deliveries.
A process-behaviour chart indicates when the process is out-of-control and helps to identify the presence of assignable cause variation. When special cause variation is present, the process is not stable and corrective action should be taken. Trending charts are figures that plot process data in a time-ordered sequence. Most control charts include a centreline (CL), an upper control limit (UCL) and a lower control limit (LCL). The centreline represents the process mean. The control limits represent the process variation. By default, the control limits are drawn at distances of three standard deviations (σ) above and below the centreline.5 Two types of trending charts were used – rare event and ordinary control charts – to draw both time interval between delivery and release of the warehouse item, and chronological monitoring of the delivery amount of the material under inspection. Reception and release of the material occurred at almost the same rate and the means and the upper control limits (UCLs) are almost identical with the same probability of occurrence as could be seen in Figure 3. Complementarily, the implementation of the classical type of control chart that shows the amount of material per delivery demonstrated a single excursion on the item demand per shipment (indicated by number 1 alarm dot in the diagram) in Figure 4. Since the dataset failed to follow any of the presumed distributions for control charts, Laney’s approach to modifying limits was applied to correct for data dispersion that impacts control limits and hence alarm signalling.6 Nevertheless, if the data are not following the expected distribution patterns (ie, normal or Poisson distributions) and the Laney modification was not applied, an increased number of false alarms might be considered. However, because fewer than two points are beyond the threshold limits on the Shewhart chart, the dispersion fitness test is not needed.7 In quantity demand terms, the process mean is expected to be unstable. One (5.9 percent) data point is ‘out of control’ on the Shewhart chart, bearing in mind that 0.7 percent of out-of-control points might be seen by chance, even when the process is stable.
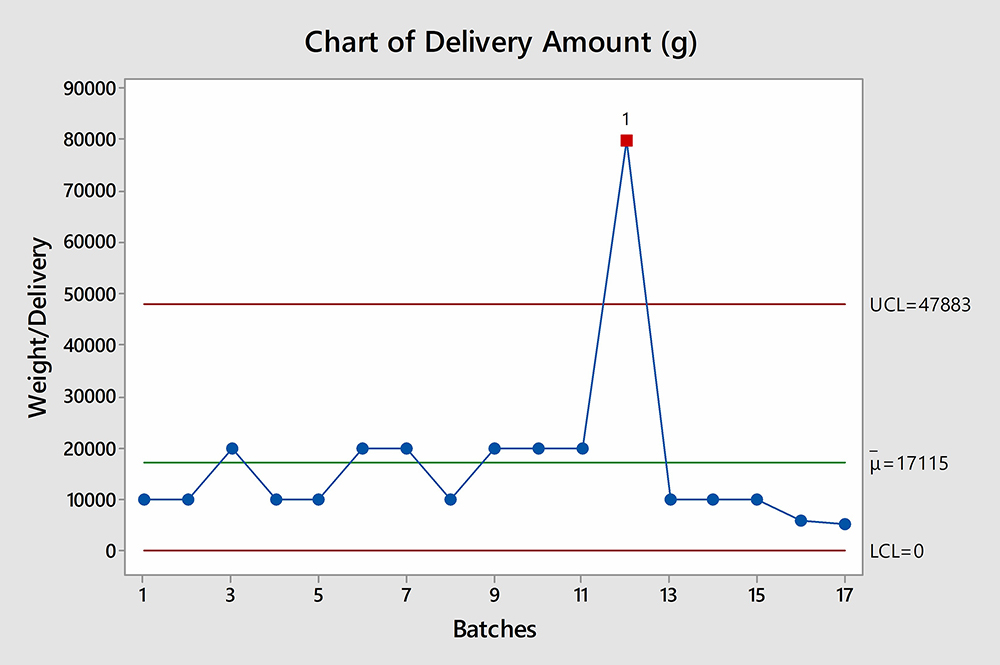
Figure 3: Process-behaviour chart: the average amount of the raw material per shipment (μ bar), upper control limit (UCL) and lower control limit (LCL).
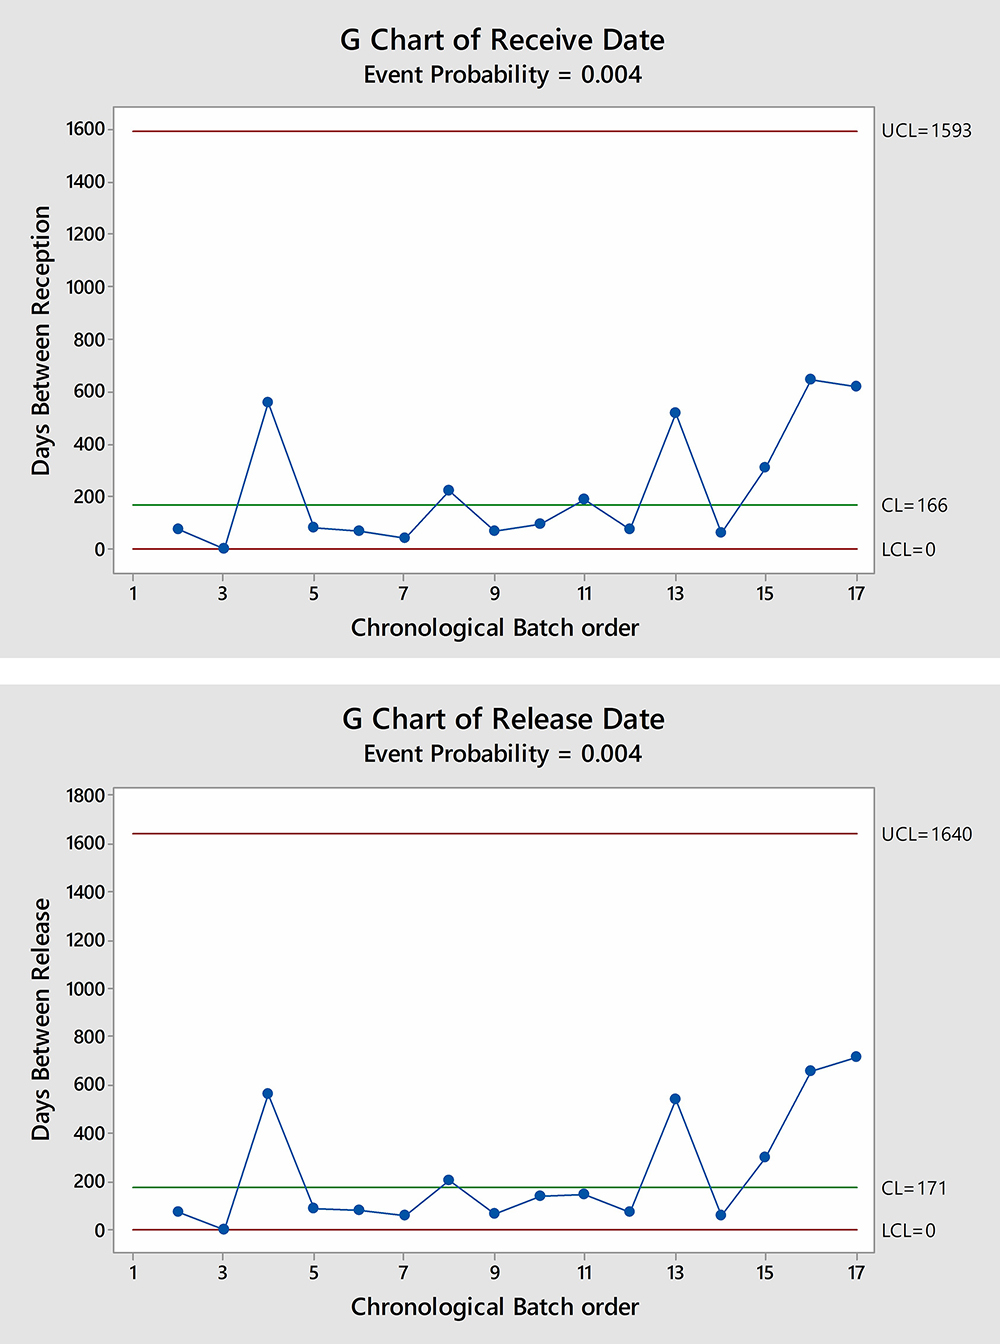
Figure 4: Rare event control chart showing incidences intervals, probability of occurrence, control limit (CL), upper control limit (UCL) and lower control limit (LCL).
Control chart-based material weight index
A metric was developed to take into account the rate of failure of material combined with its amount and the probability of the daily arrival to the facility, in such a way that the metric will increase with high risk and decrease with low-risk goods. The developed equation could be summarised as follows:
Wi= (1/(1-R)) ×P×A (1)
Where:
Wi = Weight index of the item delivered
R = Rejection fraction or 1 – R term could be substituted by Acceptance rate (A)
P = Probability of reception or release
A = Amount of the received good (in Kg), which could be expressed from mean value and UCL.
For example, in the previous case, the range of Wi could be estimated during the study period to be between 0.07 and 0.21. When a database is subjected to a continuous update, these values may change up and down depending on the amount and frequency of delivered shipments, in addition to the rate of acceptance or rejection of the goods.8 As an example, a comparison could be performed with another drug that showed 0.35 – 0.85 which is higher in the index value due to higher frequency and amount despite the absence of rejection factor. A third material showed even higher values of 0.36 – 1.07. A fourth product showed an even higher index value due to the impact of the combined factors, 6.96 – 14.51. When applying the Pareto principle, the major influential items could be spotted in the warehouse traffic. Thus, this index shows the preferential difference between inventory items in terms of the impact on the inventory load and burden.
Conclusion
Application of SPC methodologies has been adopted herein to assess the inventory item weight and impact using quantitative metrics. Moreover, monitoring and control of material mobility will provide useful support in the decision‑making procedures for planning actions and when comparing different materials with respect to inventory weight impact.
About the author
Mostafa Eissa Independent PhD Researcher, Cairo University
Mostafa has a master’s degree in pharmaceutical sciences and has worked as a research specialist in biotechnology at a pharmaceutical company. With microbiology and raw material quality analysis experience, Mostafa has written several cultural and scientific articles in magazines and published 104 scientific papers as well as a book. His research interest focuses on microbiology quality control and statistical process control. He is also Inspector at the central administration of pharmaceutical affairs.
References
- Ei̇ssa M, Rashed E. APPLICATION OF STATISTICAL PROCESS OPTIMIZATION TOOLS IN INVENTORY MANAGEMENT OF GOODS QUALITY: SUPPLIERS EVALUATION IN HEALTHCARE FACILITY. Journal of Turkish Operations Management. 2020; 4(1): 388-408.
- Eissa M. Pharmaceutical Component Kinetics | Inventory dynamic control is crucial | Pharma Focus Asia [Internet]. Pharmafocusasia.com. 2021 [cited 16 January 2021]. Available from: https://www.pharmafocusasia.com/articles/pharmaceutical-component-kinetics…
- Eissa ME. Trichinosis Outbreak Risk Analysis in USA from Food Sources and New Prospective Analysis Using Statistical Process Control Tools. International Journal of Research in Pharmacy and Biosciences. 2019; 6(7): 4-13.
- Benjamin O, Bansal P, Goyal A, Lappin S. Disease Modifying Anti-Rheumatic Drugs (DMARD) [Internet]. Ncbi.nlm.nih.gov. 2021 [cited 16 January 2021]. Available from: https://www.ncbi.nlm.nih.gov/books/NBK507863/
- Understanding control charts – Minitab [Internet]. Support.minitab.com. 2021 [cited 16 January 2021]. Available from: https://support.minitab.com/en-us/minitab/18/help-and-how-to/…
- Eissa MEAM. SPC and COVID-19 Quantitative Analysis | Healthcare Articles [Internet]. Asianhhm.com. 2021 [cited 16 January 2021]. Available from: https://www.asianhhm.com/articles/application-of-industrial-statistical-tools-in-quantitative-analysis-of-covid-19-pandemic
- Getting Started with Minitab Statistical Software [Internet]. Minitab.com. 2021 [cited 16 January 2021]. Available from: https://www.minitab.com/content/dam/www/en/uploaded files/documents/getting-started/MinitabGettingStarted_EN.pd
- Ei̇ssa M, Rashed E. INVENTORY DIGITAL MANAGEMENT USING STATISTICAL PROCESS CONTROL ANALYSIS IN HEALTHCARE INDUSTRY. Journal of Business in The Digital Age. 2020; 3(2): 123-128.
Issue
Related topics
Analytical techniques, Distribution & Logistics, Drug Markets, Industry Insight, Informatics, Supply Chain