Evaluation of cellular response to nicotinic compounds using optical label-free technology
Posted: 16 February 2011 |
Cell signalling circuits are likely to have a key role in the future of pharmacological discovery and medical treatment. There is consensus about the importance of understanding cell components and their function, not at the level of genes, but at a higher level of abstraction, involving their pathways and circuits. The optical label-free detection is a powerful approach to study molecular interactions by measuring the cellular refraction index. The phenotypic kinetic responses or signatures elicited by a compound are mechanistically informative and directly offer experimental models to abstract cell functioning. This characteristic is a practical advantage over the so-called high content techniques or the pure mathematical modelling approaches where the integration of high level information about cell functioning requires mathematical algorithms that need validation and consensus.


Figure 1 Signal generation on an Optical Resonance Grating Biosensor. The Reflected Light Wavelength (RLW) variates depending on the index of refraction bound at the sensor surface. The magnitude of the RLW shift to the left is proportional to the mass increase to the material bound to within about 150 nm of the sensor surface. RLW is usually express as picometres wavelength or PWV.
Cell signalling circuits are likely to have a key role in the future of pharmacological discovery and medical treatment. There is consensus about the importance of understanding cell components and their function, not at the level of genes, but at a higher level of abstraction, involving their pathways and circuits. The optical label-free detection is a powerful approach to study molecular interactions by measuring the cellular refraction index. The phenotypic kinetic responses or signatures elicited by a compound are mechanistically informative and directly offer experimental models to abstract cell functioning. This characteristic is a practical advantage over the so-called high content techniques or the pure mathematical modelling approaches where the integration of high level information about cell functioning requires mathematical algorithms that need validation and consensus.
In this article, we provide results on the effect of different nicotinic agonist and antagonist using optical label-free technology in the HEK 293 cell line. Cellular response to nicotinic compounds is primarily induced by the nicotine receptor, a family of ligand gated ion channels.
Modelling of cell functioning and interconnection
Cell signalling circuits will play a critical role in the future of pharmacological discovery and medical treatment. There is consensus about the importance of understanding cell components and their function, not at the level of genes, but at a higher level of abstraction, involving their pathways and circuits1-3.
In general, the signalling pathway starts with ligands accessing to the cellular receptors causing change in the macro-conformation of the cytosolic region of the protein. The ability of a ligand to induce functional responses is dependent on the cellular system under investigation i.e. cellular background, receptor expression and its coupling efficiency. It is well known that only particular receptor conformations will induce intracellular changes4,5. At the same time, different ligands that bind to the same receptor, even the same subtype, can display profoundly different biological properties arising from different regulation of intracellular pathways and secondary messengers involved (e.g., IP3 flux, ERK1/2 phosporilation, cAMP activation, Ca2+ release or beta arrestin)3,4,6-8. For instance, the states of the acetylcholine receptor have been reported to be resting, open, fast on-set desensitised and slow on-set desensitised. It is assumed that there are two different agonists binding sites. The total number of states of occupancy for the sites is four (from unoccupied to single occupied to double occupied) and there may be up to 16 transitions between them9.
For some authors, mathematical models about signalling pathways will dominate the dissemination of biological knowledge in the future1. Some others have found in the emerging field of the label-free techniques applied to the study of living cells a new means to detect the texture and complexity of life circuits2,3,5,10,11. In any case, whether it is conceptual or experimental, the modelling of cellular functioning and interconnection is at the breaking point.
Measurement of Cellular Refraction Index
Nowadays, there are at least two distinct labelfree technology platforms compatible with assays running in microplates. They differ in the biophysical principle of detection, namely electrical impedance and index of refraction. Impedance-based systems measure the electrical impedance (Z) of a cell monolayer positioned over electrode arrays on the bottom of the plate. In 2001, a novel class of optical biosensors known as ‘photonic crystals’ was introduced in the marketplace, with the first commercial product being launched in 200412-14,16. These are structures incorporating two different dielectric materials with a periodically repeating structure. A nanostructure sub wavelength optical grating is used as the binding surface. This novel kind of surface hologram reflects only one single infrared colour when illuminated with white or broadband light14. The wavelength of the reflected monochromatic light is characteristic of the index of refraction in the sample of analysis. The optical biosensors provide very sensitive measurements of changes in binding or adherence of cells or proteins in response to ligand additions in the proximity of the biosensor surface (see Figure 1 for details on signal generation on an optical biosensor).
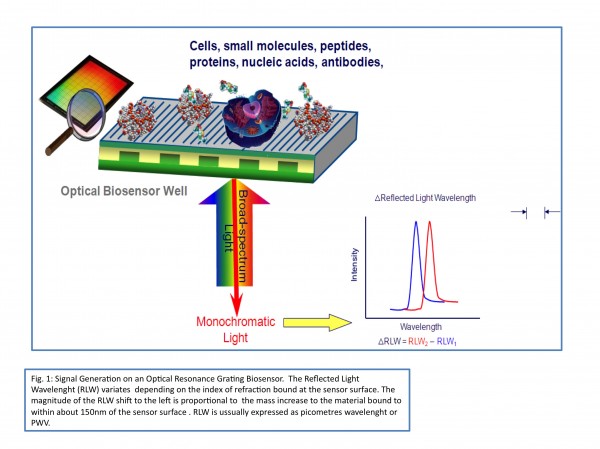

Figure 1 Signal generation on an Optical Resonance Grating Biosensor. The Reflected Light Wavelength (RLW) variates depending on the index of refraction bound at the sensor surface. The magnitude of the RLW shift to the left is proportional to the mass increase to the material bound to within about 150 nm of the sensor surface. RLW is usually express as picometres wavelength or PWV.
There is a well grounded although still nascent evidence about the value of optical label-free technology to study cellular functioning, specifically about signalling on GPCRs stimulation or blockage. There continue to be many publications regarding this matter2,3,5,10,11,15.
Figure 2 panel A shows the temporal signature for the Gi pathway in the HEK 293 MSRII cell line on Sphingosine 1 Phosfate (S1P) challenge obtained in our laboratory using a SRU BINDTM system. Figure 2 in panel B represents both dose-response and blockage of Lisophospatidic Acid (LPA) stimuli (RBL wild type cell line). It is clearly demonstrated that the profile elicited by LPA is mediated by Ca2+ (Gq pathway). Interestingly, blocking of Gq pathway by 5uM BAPTA reveals potential underlying signalling still running in the cell15.
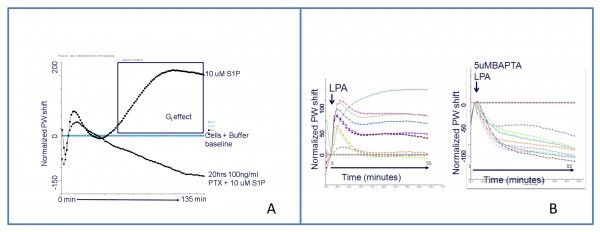

Figure 2 Optical signatures for two G-protein coupled receptors A: S1P (Sphingosine 1 Phosphate) signalling in HEK 293 MSRII (Human Embryonic Kidney) cell line with and without pertussi toxin pre-incubation. S1P is mediated by Gi pathway between 60 – 120 minutes after challenge addition B: Dose-response and blockage of LPA (Lisophospatidic Acid) in RBL (Rat Basophilic Leukemia) wild type cell line. The profile elicited by LPA is due to Gq pathway. Interestingly, blocking of Gq pathway by 5uM BAPTA reveals potential underlying signalling
In spite of the promising results reported so far, the number of publications about ion channels and their regulation, in the arena of the optical label-free, remain low19,25. Reasons may be certainly related to both the experimental challenges that the technique demands and the level of resolution achieved so far by the marketed readers. In particular, pre-coating steps of sensors and cell attachment variation versus neat signal are very critical factors to keep under experimental control. There is a need for a case by case optimisation of cell concentration and growth conditions. Cell starvation for approximately 24 – 48 hours is often required in order to ensure a significant signal, particularly for wild type or primary cell lines. Even under tightly controlled experimental conditions, the reproducibility of results may be a drawback when exploring intrinsic and close to the background signals15. These facts evidence a need to develop technical aspects of this methodology in order to specifically enhance resolution for cells. There are currently reports on new approaches like the combination of optical high- resolution label-free imaging with enhanced fluorescence16 or unicellular scanner readers (BINDTM Systems). They will all certainly add future insight into cellular optical label-free measurements.
Cell signalling of ion channels. nACh ligand-gated ion channels
Ion channels control the electrical properties of neurons and other excitable cell types by selectively allowing ions to flux through the plasma membrane. A fundamental feature of ion channels is that they do not always allow ions to flow. Rather, most ion channels can exist in different conformational states. The transition between these states is often called ion channel gating, and it is influenced by a number of different factors. In one large family of channels, the binding of a small molecule extracellular or intracellular ligand triggers a conformational change that causes the pore to open. These ligand-gated ion channels include the receptors for major neurotransmitters such as glutamate, GABA and acetylcholine, as well as the cyclic nucleotide–gated ion channels that are key players in sensory transduction. The gating of some ion channels may also be influenced by the binding of another ligand, intracellular Ca2+. In the case of the voltagegated ion channels, a particular protein region is thought to act as a voltage sensor that moves in response to changes in the electric field across the membrane, thereby exerting force on the channel gate. Intracellular signalling proteins can also modulate ion channel function. For example, most and perhaps all ion channels are substrates for protein kinases and phosphoprotein phosphatases, and phosphorylation and dephosphorylation can modulate channel gating. More recently, attention has centred on the idea that kinases and phosphatases, as well as other signalling and scaffolding proteins, may be intimately associated with ion channels in a regulatory protein complex17-19.
Acetycholine receptors (AChRs) came to be divided into nicotinic receptors that activate ion channels and muscarinic receptors that couple to phospholipase C or to adenylyl cyclise through G-proteins because of the discovery and study of two alkaloids, nicotine from tobacco plant and muscarine from the mushroom Fly Agaric.
The Nicotinic Acetylcholine Receptors (nACh) are ligand-gated ion channels. They consist of five subunits that form a central, cation-permeant channel whose opening is gated in response to the binding of the neurotransmitter acetylcholine (ACh). Mammals have 16 nAChR subunit-encoding genes, five of which function at the neuromuscular junction while the remaining subunits are neuronal. A subclass of α subunits is defined by a pair of adjacent cysteine residues that play a key role in ACh binding. Neuronal nAChRs are generated from α (α2–10) and β (β2–4) subunits; the three most abundant brain nAChR subtypes are composed of α7, α4β2, and α3β4 subunits, although nearly 30 brain nAChR subtypes have been described9. Upon agonists binding, nAchRs undergo an allosteric transition that allows an influx of Na+, and to lesser extent of Ca2+, and an efflux of K+ under normal physiological conditions. In recent years, intricate regulatory mechanisms have been reported, including the existence of two different binding sites for its natural ligand (ACh) that may provoke either potentiating or inhibiting effects20. In addition, nicotine up regulates its own receptors through enhanced intracellular maturation; this exceptional mechanism is thought to be controlled by an extracellular protein domain that some authors consider an immature form of the non competitive binding site of the receptor21.
nAChRs have been objects of interest due to their contribution to several pathological situations like apoptosis, cancer22 or Alzheimer’s Desease23 among others.
Several different signalling cascades, including the ERK/MAPK pathway and the JNK pathway, have been implicated in the actions of the nAChR activation. AKT and apoptotic proteins have been reported as alternative activation pathways23.
Evaluation of cellular response to nicotinic compounds using optical label-free technology We are showing results that formed part of a broader scope work in the area of the nicotinic receptors. We investigated whether label free BINDTM technology could monitor the particular label-free optical signature induced by nicotine upon receptor binding. In addition, we characterised the cellular kinetic response to nicotine in HEK 293 MSRII wild type cell line. Finally, we investigated whether this technology could discriminate between nicotinic nACh agonists and antagonists. Part of these results have been already presented at the 15th Annual Conference of the Society of Biomolecular Screening (Lille, 2009)24.
All the tool compounds including acetylcholine chloride (ACh), scopolamine, atropine, lantrunculine A , Methyllicaconitine (MLA), mecamylamine and dihydro-betaerythroidine (DhbE) were obtained commercially.
The base media for cell culturing HEK 293 MSRII was Minimum Essential Medium including 10 per cent FBS, 0.4mg/ml geneticine and 2mM L-glutamine. Cells were seeded in TiO2 384 well sensor plates. The sensors were previously coated firstly with collagen and secondly with culture media. After being washed, the basal values of the pre-coating steps were recorded for all plates and used for further in-well normalisation.
Cells were cultured in t-flasks and used for assay between 4-15 passages. When they reached 60-70 per cent confluence, they were detached with Versene solution. After being washed and counted, the cells were seeded into sensor plates at 30K cells / well and maintained at 30°C (five per cent CO2) for 24 hours in culture media. After washing the plates, cells were maintained on starvation for 24 hours (HBSS medium pH 7.4 supplemented with glucose) at 30°C (five per cent CO2).
Figure 3 shows the response of HEK MSRII cell line on nicotine challenge (optical temporal signature). The signal induced by nicotine is dose-dependent, saturable and causes a net signal decrease between 0.2 to 100uM concentration. The maximum response is observed at 15 minutes after agonist addition for 5-0.5uM nicotine concentration. High nicotine concentrations (>100uM) produce a positive signal, this fact would point out to the existence of a differentiated mechanism of action. Figure 4 illustrates how the nicotine response is blocked by latrunculine A (an inhibitor of actine polymeration) in a dosedependent manner (IC50 = 65nM) suggesting that the changes in the cellular refraction index are mediated by cytoskeleton rearrangements.
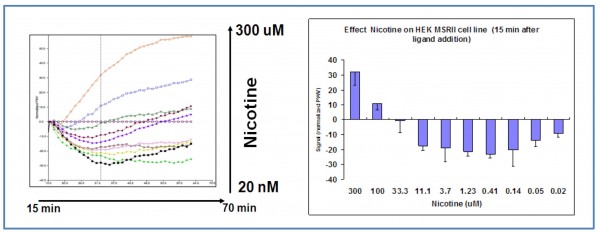

Figure 3 Nicotine dose-response in HEK 293 wild type cell line (SRU™ optical label free system). The signal induced by nicotine is dose-dependent, saturable and causes a net signal decrease (PWV) that is maximum for 0.5-5 uM at 15 – 50 minutes after agonist addition
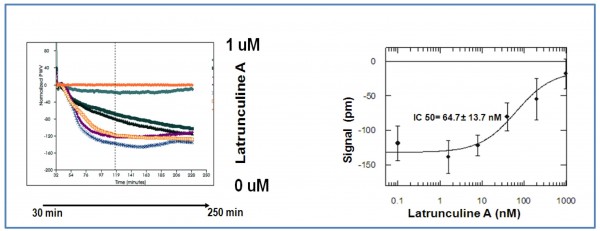

Figure 4 Dose-response effect of Latrunculine A on HEK 293 wt cell line challenged by 30uM nicotine. Nicotine response is blocked by actine depolymerisation in a dose-dependent manner (IC 50 = 65nM). It proves that observed changes in cellular refraction index are caused by intra-cellular cytoskeleton rearrangements
Figure 5, panel A shows the optical signature that we registered for both HEK 293 wild type and HEK 293 α4β2 transfected cell line, on ACh, nicotine and epibatidine (a potent nicotinic agonist) challenge. The optical signature registered for ACh is a typical Gq record pathway, this elucidation is confirmed by the ACh signal blockage exerted by atropine and scopolamine (data shown in panel B). Interestingly, the response induced by ACh on our α4β2 transfected cell line is not only of higher amplitude but depicts a different decay slope with regard to the HEK 293 wt cell line. It would suggest that the transfected nicotinic ion channel is actually modulating the G-protein coupled receptor pathway induced by the muscarinic activation. Similar results have been recently reported about a potassium channel (the slack potassium channel) transfected in a HEK 293 cell line after stimulation with carbachol and measured with Corning Epic® optical label free system19.
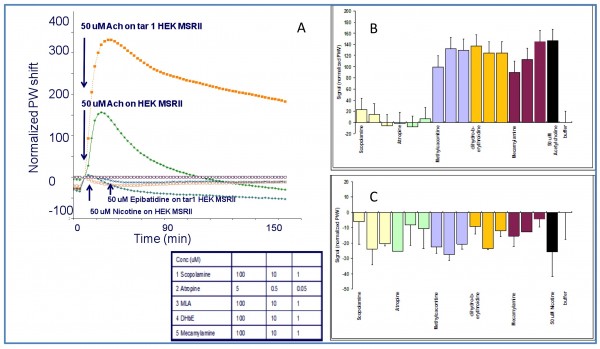

Figure 5 Panel Ashows the optical signature registered in both the HEK 293 wt and the HEK 293 α4β2 transfected cell line upon acetylcholine, nicotine and epibatidine (a potent nicotinic agonist) challenge. Panels B and C show blocking experiments for both the ACh (B) and Nicotinic (C) induced signal in HEK 293 wt cell line. It can be observed that the ACh signal is fully blocked by muscarinic antagonist like scopolamine and atropine, but not by methyllicaconitine (MLA), mecamylamine and dihydro-beta-erythroidine (DHbE) some well known nicotinic blockers (Panel B). In addition to that, the nicotinic response in panel C is just partially blocked by high concentrations of muscarinic antagonists like atropine or scopolamine but fully blocked by mecamylamine. Besides that, the relative blocking of mecamylamine / scopolamine is six-fold higher against the nicotine induced signal than against the ACh induced signal
Figure 5 panel A also shows the optical signature for nicotine and epibatidine in both cell lines. It can be observed that the signal profile is very significant, although the relative amplitude compared to ACh signal is experimentally low and close to the background. For this reason, it is difficult to conclude whether nicotinic responses are significantly different in both cell lines.
Figure 5 panel C shows that the nicotinic response is just partially blocked by high concentrations of muscarinic competitive antagonists like atropine or scopolamine but fully blocked by mecamylamine, a well-known nicotinic antagonist. In addition, the relative blocking of mecamylamine / scoplamine is sixfold higher on the nicotine induced signal than against the ACh induced signal (HEK 293 wt cell line). Those results have led us to the conclusion that the cytoskeleton rearrangements that we have registered after nicotine stimuli in the BINDTM system are caused by the activation of the family of the nicotinic ligand gated ion channels (nAChRs) endogenously expressed in our HEK MSRII cell line.
Summary
The marketplace currently holds a plethora of label-free techniques enabling measurement of different physicochemical parameters of cells, including impedance, viscoelasticity, sound transmission or refraction index. Among these many label-free indexes, we rely on the intracellular refraction index as having a high cell-functioning contents value.
In order to make experimental procedures more feasible and reproducible, and increase technical resolution to enable more basic mechanistic information, evolution in this field remains a challenge before applying these techniques in a larger scale.
In any event, the measurement of the cellular refraction index combines revolutionary information, including the capability to study the cellular signalling course in real time by means of a simple approach. We envision it will open new avenues in early drug discovery in general, as well as particularly in the field of ion channel modelling and functioning.
Acknowledgments
The author thanks Eugenia Cruz, Ana Lopez Polin and Guadalupe del Real for their help on the experimental work. Also, Emilio Diez and Emilio Alvarez and Sergio Senar for their critical reading of the article.
References
1. Aldridge B, Burke J, Lauffenburger A, Sorger P. (2006) Physicochemical modelling of cell signalling pathways. Nature Cell Biology, 8, 1195-1203
2. Kenakin T. (2009) Interrogating 7TM receptors: Does texture in the question yield greater texture in the answer? Journal of Receptor and Signal Transduction, 29(3-4): 132-139
3. Cooper M. (2009) Signal transduction profiling using label-free biosensors. Journal of Receptor and Signal Transduction, 29(3-4): 224-233
4. Kenakin T. (2007) Collateral efficacy in drug discovery: Taking advantage of the good (allosteric) nature of 7TM receptors. Trends Pharmacol Sci 28:407
5. Rocheville M, Jerman J. (2009) 7TM pharmacology measured by label-free: a holistic approach to cell signalling. Current Opinion in Pharmacology, 9: 1-7
6. Shukla AK et al. (2008) Distinct conformational changes in beta-arrestin report biased agonism at seventransmembrane receptors. Proc Natl Acad Sci USA: 105:9988
7. Sato M et al. (2008) The beta3-adrenoceptor agonist 4-[[(Hexylamino)carbonyl]amino]-N-[4-[2-[[(2S)- 2-hydroxy-3-(4- hydroxypheno xy)propyl]amino]ethyl]- phenyl]-benzenesulfonamide (L755507) and antagonist (S)-N-[4-[2-[[3-[3-(acetamidomethyl) phenoxy]-2-hydroxypropyl]amino]-ethyl] phenyl] benzenesulfonamide (L748337) activate different signalling pathways in Chinese hamster ovary-K1 cells stably expressing the human beta3-adrenoceptor. Mol Pharmacol;74:1417
8. Galandrin S et al. (2008) Conformational rearrangements and signaling cascades involved in ligand-biased mitogen-activated protein kinase signalling through the beta1-adrenergic receptor. Mol Pharmacol 74:162
9. Karlin A. (2002) Emerging Structure of the Nicotinic Acetylcholine Receptors. Nature, 3: 102-114
10. Lee P. (2009) Label-free optical biosensor: A tool for G protein-coupled receptors pharmacology profiling and inverse agonists identification. Journal of Receptor and Signal Transduction , 29(3-4): 146-153
11. Kebig A, Kostenis E, Mohr K, Mohr-Andra M. (2009) An optical dynamic mass redistribution assay reveals biased signalling of dualistic GPCR activators. Journal of Receptor and Signal Transduction , 29(3-4): 140-145
12. Cunningham BT et al. (2004) Label-Free assays on the BIND system. J Biomol. Screen. 9 (6): 481-490
13. Martin J. (2008) High-Throughput Optical Label-Free in Early Drug Discovery: From Biomolecular Interactions to Cellular Phenotypes. American Drug Discovery 3,12
14. Martin J, Coma I, Rocheville M. (2010) Addressing Attrition in Early Drug Discovery by Label-free Methodologies: Receptor Pharmacology in Native Cells. International Drug Discovery
15. Coma I. (2009) Working With Cellular Applications in Optical Label-free Technology. Oral presentation at SMi Group Ltd, High Throughput Screening for Biological Systems, London
16. Cunningham B. (2010, in press) Photonic Crystal Surfaces as a General Purpose Platform for Label-Free and Fluorescence Assays. JALA 2010
17. Levitan IB. (2006) Signaling protein complexes associated with neuronal ion channels. Nat Neurosci 9 (3): 305-10
18. Kaczmarek LK. (2006) Non-conducting functions of voltage-gated ion channels. Nat Rev Nuerosci 7 (10)761:71
19. Fleming M, Kackzmarek L. (2009) Use of optical biosensors to detect modulation of Slack potassium channels by G protein-coupled receptors. Journal of Receptor and Signal Transduction , 29(3-4): 173-181
20. Zwart R, Vijverberg P M. (1997) Potentiation and Inhibition of Neuronal Nicotinic Receptors by Atropine: Competitive and Noncompetitive Effects. Mol Pharmacol, 52:886-895
21. Sallette J, Bohler S, Benoit P, Soudant M, Pons S, Le Novere N, Changeux J-P, Corringer P. (2004) An Extracelullar Protein Microdomain Controls Upregulation of Neuronal Nicotinic Acetylcholine Receptors. J Biol Chem, 279: 18767-18775
22. Egleton R, Brown K, Dasgupta P. (2007) Nicotinic acetylcholine receptors in cancer: multiple roles in proliferation and inhibition of apoptosis. Trends in Pharmacological Sciences 29, 151-157
23. Buckingham S, Jones A, Brown L, Sattelle D. (2009) Nicotinic Acetylcholine Receptor Signalling: Roles in Alzheimer’s Disease and Amyloid Neuroprotection. Pharmacol Rev 61:39-61
24. Cruz E, Lopez A, Del Real G, Martin J, Coma I. (2009) Evaluation of cellular response to nicotinic compounds using optical label-free technology. Poster #2008 , 15th Society of Bimolecular Screening Meeting , Lille
25. Randle D, Gao A, Scibek J. (2010) Label Free Ion Channel Assays Using the Corning Epic System. Poster Presentation at the 16th Society for Bimolecular Screening Meeting , Phoenix, USA
About the Author
Isabel Coma is currently working at the Molecular Discovery Research High Throughput (HTS) facility of GlaxoSmithKline in Tres Cantos (Spain). This R&D centre is devoted to hit identification by using a combination of technologies in a highly automated environment. As investigator of one of the groups, she is responsible for HTS campaigns from screen development to dose-response and preliminary SAR including a wide range of HTS assay technologies. She has been engaged in the development and implementation of optical label-free techniques as well as new statistical tools for HTS quality control. Prior to her current position, she was working at the R&D Department of SmithKline Beecham in Madrid from 1992 until 2001. She holds a Masters Degree in Pharmacology from the University of Madrid and a Masters Degree in Statistics for Health Sciences from the University of Barcelona. She holds a Project Management Professional title from EOI Business School of Madrid.
email: [email protected]


