Surface-enhanced Raman spectroscopic sensing of glucose
Posted: 15 December 2017 | Laila Al-qarn, Zafar Iqbal | No comments yet
The small normal Raman cross-section of glucose is a major challenge in its detection by surface enhanced Raman spectroscopy (SERS) for medical applications, such as blood glucose level monitoring of diabetic patients and evaluation of patients with other medical conditions, since glucose is a marker for many human diseases. Here we will discuss the use of commercially available multilayer graphene sheets as substrates on which gold nanoparticles are chemically assembled by reduction of sodium citrate.
Results show that these substrates are capable of providing SERS enhancement factors up to 1010 with a lower limit of detection (LOD) of 10-8M in aqueous solutions of glucose. The LODs on graphene are many orders of magnitude lower than values obtained on gold-coated chemically etched Klarite silicon substrates, marketed by Renishaw Diagnostics, which are widely-used commercial SERS substrates. The glucose spectra over a range of concentrations in the 400-1500cm-1 fingerprint region were recorded using 532nm laser excitation, 10mW laser power and a 50x microscope objective. The intensity of the 1,340cm-1 line of glucose varied linearly with glucose concentration and can be used as a calibration for samples of unknown concentrations. Chemometric methods were used to provide improved spectra at very low concentrations. Graphene can also provide fractional charge transfer (CT) effects to glucose to provide secondary enhancement of the Raman spectra.
The discovery of SERS in the late 1970s enabled enhancement of the Raman scattering cross-section of adsorbed pyridine1 on a silver electrode by five to six orders of magnitude,1-4 which was explained in terms of the local plasmonic electromagnetic (EM) field on a rough surface.5,6 There have been heated debates over the details of the SERS mechanism; however, it is now generally accepted to be a combination of two mechanisms – charge transfer (CT) and electromagnetic (EM) enhancement. The origin of EM, a key contributor to enhancement of Raman signals, is in the magnified electromagnetic field with light-excited surface plasmon resonance.7 A typical location of strong electromagnetic fields is in nano-gaps between the metal nanostructures (so-called ‘hotspots’) and at their sharp corners.8 Coexistence of CT with EM creates a typical SERS system on the basis of the transfer of charge between SERS substrate and the analyte molecules that lead to high enhancement factors.
SERS can be used to sense molecules in trace amounts for biochemical and chemical analysis. Molecular fingerprint specificity is combined with potential sensitivity down to the single molecule level in SERS. Chemists have therefore used this powerful technique in a wide range of applications and in particular biosensing, such as that of glucose, which plays a significant role in metabolic activities in the human body. Glucose has a relatively small Raman cross-section of 5.6×10⁻³⁰cm2/(molecule-sr),9 which can be enhanced by SERS for sensing purposes. Further optimisation of SERS can be facilitated by molecule adsorption on a nanostructured gold- or silver-coated substrate to ensure enhancement by chemical and electro-magnetic mechanisms.10
Graphene is an emerging substrate for SERS because of its compatibility with a variety of biological and chemical species, its chemical inertness, and the novel presence of a single to few layers of sp2 bonded carbon atoms forming a network sheet.11,12 Graphene, however, has some inherent disadvantages because of its domain structure due to the presence of defects at the edges and variations in the number of layers that can lead to irreproducibility in electronic and optical data. Commercial graphene sheets with uniform multilayers from Graphene Laboratories Inc were found to provide reproducible SERS results.
Here, the use of commercial multilayer graphene sheets as SERS substrates on which gold nanoparticles were assembled by citrate reduction,13,14 is discussed. A Thermo Scientific DXR micro-Raman spectrometer was used to obtain the Raman spectra with 532nm laser excitation at a spatial resolution of 10μm and a spectral resolution of 2cm-1. Improved Raman spectra at very low concentrations down to 10-8M were obtained after chemometric smoothing of the data (Figure 1).
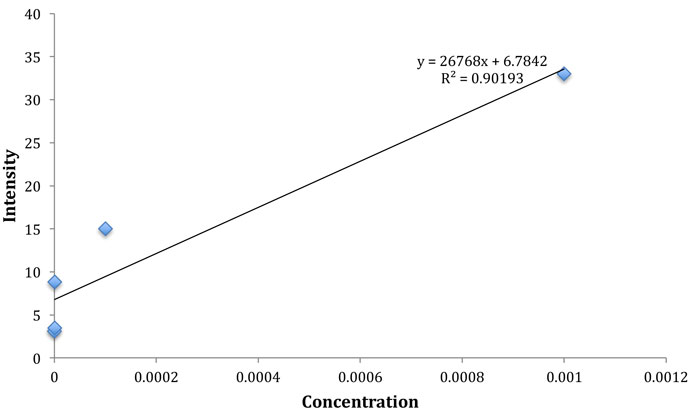
Figure 1: Intensity in arbitrary units of the glucose Raman peak at 1,340 cm−1 versus the molar concentration of glucose on the SERS substrate.
Figure 2a shows the conventional Raman spectrum of pristine multilayered graphene where the graphitic mode at 1,580cm-1 is extremely sharp, indicating highly-ordered carbon layers whereas the so-called G line at 2,720 cm-1 is broadened with many features due to multilayering. Figure 2b shows the conventional spectrum of crystalline glucose with Raman lines in cm-1 together with approximate assignments at: 919 (O-C1-H1 bend), 1,340 (C-C-H bend), 1,270, 1,164, 1,116 (C-C + C-O stretch), 860 (C-C stretch), and 1,070 (C1-OH stretch). SERS on a gold/graphene substrate of 1M glucose showing the key Raman lines is displayed in Figure 3 in agreement with the conventional Raman data in Figure 2.
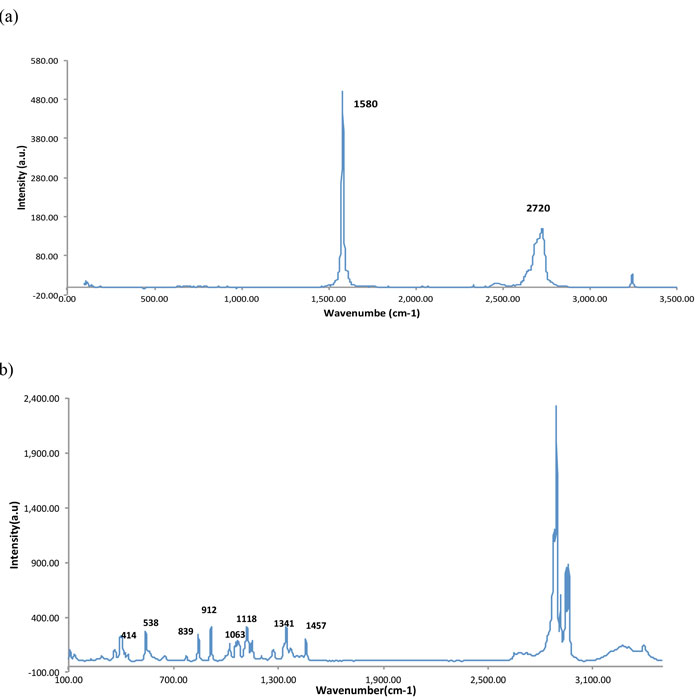
Figure 2: a) Conventional Raman spectrum of pristine graphene sheet, recorded with 532nm laser excitation, laser power 10mW, acquisition time 15s averaged for three scans b) Conventional Raman spectrum of crystalline glucose for comparison recorded under the same spectral conditions as in (a).
Scanning electron microscope (SEM) images of pristine and gold-coated graphene sheets were obtained with a VP-1530 Carl Zeiss LEO field-emission SEM. A high magnification image of a gold-coated graphene sheet is shown in Figure 4. The figure shows that gold nanoparticles on the graphene sheet surface which appear with lighter contrast is uniform, with an average concentration of 4.6% determined by energy dispersive x-ray (EDX) analysis.
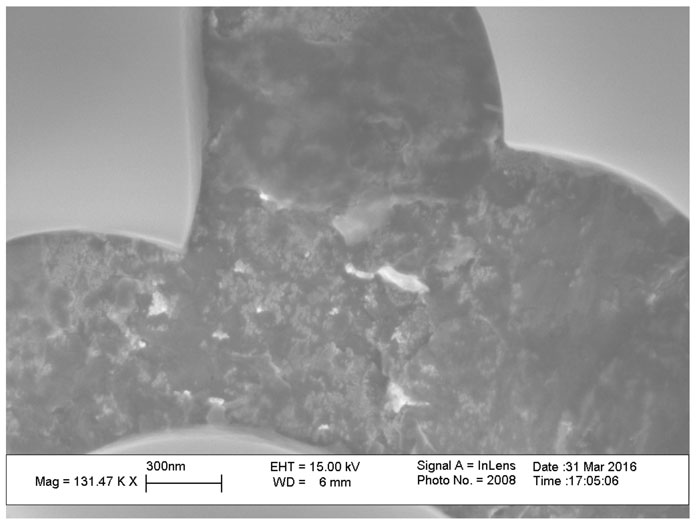
Figure 4: SEM image for a multilayered graphene sheet after gold nanoparticle deposition at a magnification of 131,470x showing fine nanoscale gold particles in lighter contrast to that of the graphene substrate.
Figure 5 shows how the Raman intensities of the key Raman line of glucose at 1,340cm-1 vary with concentration down to the 10-8M concentration level of the analyte. This essentially linear variation shows that gold/graphene can be an excellent substrate for glucose detection by SERS. Another feature observed is a small shift of the glucose SERS frequencies on graphene relative to those from free glucose, suggesting the presence of an EM field between the gold particles mediated by the graphene substrate that can provide additional enhancement of the Raman signal.15,16 The results presented suggest the potential of the gold-graphene system as a flexible, highly efficient glucose sensor, particularly for medical applications.
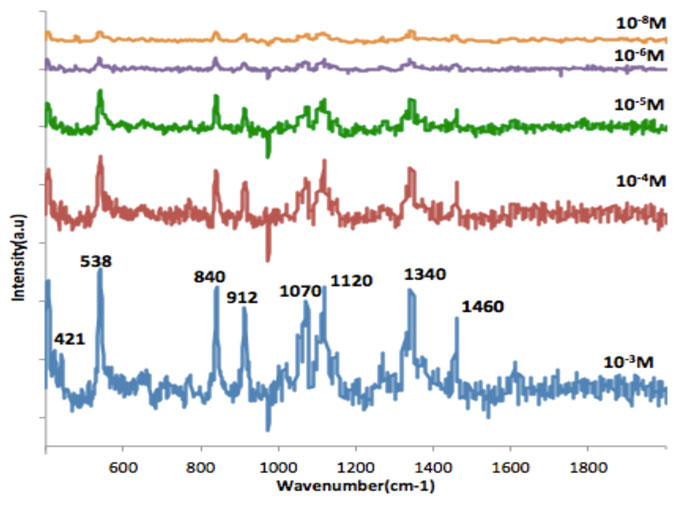
Figure 5: SERS of different concentrations of glucose in the 400 to 2,000 cm-1 spectral range on gold/graphene excited with a laser wavelength of 532nm with power of 10mW and acquisition time 15s averaged over three scans. All the peaks in the SERS spectra correspond with those of the Raman spectrum of crystalline glucose.
References
- Fleischmann M, Hendra PJ, McQuillan AJ. Raman spectra of pyridine adsorbed at a silver electrode. Chemical Physics Letters. 1974;26(2):163-166.
- Jeanmaire DL, Van Duyne RP. Surface Raman spectroelectrochemistry: Part I. Heterocyclic, aromatic, and aliphatic amines adsorbed on the anodized silver electrode. Journal of Electroanalytical Chemistry and Interfacial Electrochemistry.1977;84(1):1-20.
- Albrecht MG, Creighton JA. Anomalously intense Raman spectra of pyridine at a silver electrode. Journal of the American Chemical Society. 1977;99(15):5215-5217.
- Moskovits M. Surface roughness and the enhanced intensity of Raman scattering by molecules adsorbed on metals. The Journal of Chemical Physics. 1978;69(9):4159-4161.
- Creighton JA, Blatchford CG, Albrecht MG. Plasma resonance enhancement of Raman scattering by pyridine adsorbed on silver or gold sol particles of size comparable to the excitation wavelength. Journal of the Chemical Society, Faraday Transactions 2: Molecular and Chemical Physics. 1979;75:790-798.
- Le Ru E, Blackie E, Meyer M, Etchegoin PG. Surface enhanced Raman scattering enhancement factors: a comprehensive study. The Journal of Physical Chemistry C. 2007;111(37):13794-13803.
- Cialla D, März A, Böhme R, Theil F, Weber K, Schmitt M, Popp J. Surface-enhanced Raman spectroscopy (SERS): progress and trends. Analytical and Bioanalytical Chemistry. 2012;403(1):27-54.
- Li W, Camargo PH, Lu X, Xia Y. Dimers of silver nanospheres: facile synthesis and their use as hot spots for surface-enhanced Raman scattering. Nano Letters. 2008;9(1):485-490.
- Sharma B, Frontiera RR, Henry A-I, Ringe E, Van Duyne RP. SERS: materials, applications, and the future. Materials Today. 2012;15(1):16-25.
- Yonzon CR, Haynes CL, Zhang X, Walsh JT, Van Duyne RP. A glucose biosensor based on surface-enhanced Raman scattering: improved partition layer, temporal stability, reversibility, and resistance to serum protein interference. Analytical Chemistry. 2004;76(1):78-85.
- Xu W, Mao N, Zhang J. Graphene: A Platform for Surface-Enhanced Raman Spectroscopy. Small. 2013;9(8):1206-1224.
- Novoselov KS, Geim AK, Morozov SV, Jiang D, Zhang Y, Dubonos SV, Grigorieva IV, Firsov AA. Electric field effect in atomically thin carbon films. Science. 2004;306(5696):666-669.
- Turkevich J. Colloidal gold. Part II. Gold Bulletin. 1985;18(4):125-131.
- Frens G. Controlled nucleation for the regulation of the particle size in monodisperse gold suspensions. Nature. 1973;241(105):20-22.
- Schedin F, Lidorikis E, Lombardo A, Kravets VG, Geim AK, Grigorenko AN, Novoselov KS, FerrariAC. Surface-enhanced Raman spectroscopy of graphene. ACS Nano. 2010;4(10):5617-5626.
- Hao Q, Morton SM, Wang B, Zhao Y, Jensen L, Jun Huang T. Tuning surface-enhanced Raman scattering from graphene substrates using the electric field effect and chemical doping. Applied Physics Letters. 2013;102(1):011102.
Biography
 LAILA AL-QARNI completed her Master’s degree in Chemistry from King Abdul Aziz University in Saudi Arabia in 2009, where she started as a Teaching Assistant in 2008 and was promoted to Lecturer in 2009. Since 2015 she has been researching and studying at the New Jersey Institute of Technology, where she expects to receive her PhD in Physical Chemistry under the direction of Prof Zafar Iqbal for the use of SERS as a biosensor.
 ZAFAR IQBAL is a Research Professor in Chemistry at the New Jersey Institute of Technology (NJIT), and President of CarboMet, a company founded to commercialise nanotechnologies from his laboratory. Before joining NJIT Dr Iqbal was Senior Principal Research Scientist and Project Manager at AlliedSignal. Prior to that, he spent 10 years as a Research Scientist at the US Army’s Research and Development Centre in New Jersey. Dr Iqbal has been awarded the Army’s Paul A Siple Medal, an Alexander von Humboldt Fellowship, and is a Fellow of the American Physical Society. He has published over 225 papers in peerreviewed journals and been awarded 25 US patents on topics ranging from energetics to sonar sensors.