Evaluation of microbiological purified water trend using two types of control chart
Posted: 30 October 2018 | Mostafa Eissa (Hikma Pharmaceuticals) | No comments yet
The microbial population in water is dynamic and may change not only from day to day but also at different times of the day. Researchers have observed that this microbiological distribution usually follows the Poisson or Negative Binomial model.1

Data trending regarding the microbiological density of water provides a comprehensive and informative means of assessing the quality, stability and safety of the microbial community in water. Statistical process control (SPC) provides a useful tool to address these items quantitatively, which could be integrated with quantitative risk assessment tools.
Water is a crucial ingredient in many processes in the healthcare industry generally and the pharmaceutical sector specifically.2,3 Accordingly, the quality and safety of water are crucial parameters to be monitored regularly to ensure its suitability for use and consumption. Part of the inspection process includes assessing the microbiological quality of the processed water, such as purified water (PuW) of pharmaceutical grade.
A worked case study
A well-established water treatment plant that has operated for more than 10 years receives source water from the municipal city line and processes it through several stages before delivering the finished PuW to be dispensed and distributed through a healthcare facility. PuW from the return of the distribution loop was sampled on a daily basis during the first quarter of the year (Q1), covering January, February and March during working days. Water samples were tested using routine microbiological methods and the obtained results were interpreted as the number of CFU (colony forming units)/100ml.4 Data trending, SPC (standard plate count), Shewhart charts and result processing were carried out using Microsoft Office Excel 2007, XLSTAT Version 2014.5.03, GraphPad Prism Version 6.01 and Minitab® 17.1.0, which are being used concurrently in complementary projects on the same line.5-7
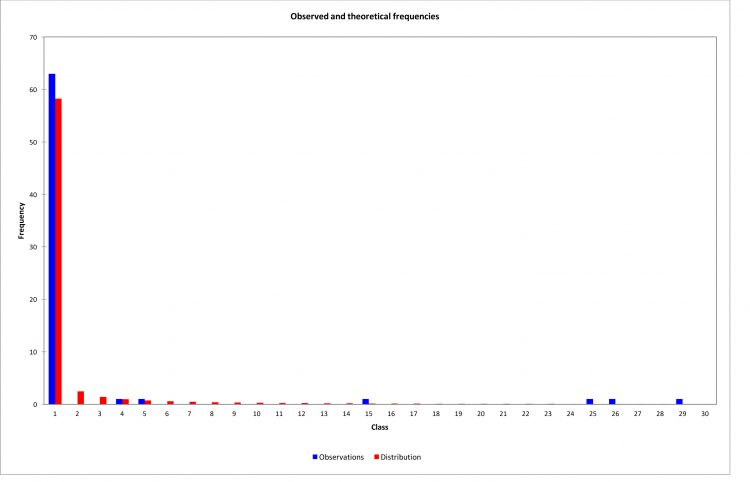
Figure 1: Frequency distribution comparison between the assumed negative binomial and the actual microbial distribution in purified water from loop return samples (using XLSTAT Version 2014.5.03).
Outcome of the microbiological monitoring of purified water
Although none of the waterborne pathogens were detected during the study period, a spiking in the bioburden was observed between day 33 and day 40 (one week) above the usual low trend of the examination of the loop return samples. Data showed non-Gaussian distribution and failed normalisation procedures at p = 0.01 through transformation recommended by previous studies.8,9 The best fitting distribution was Negative Binomial at significance level 0.01% – as illustrated in Table 1 – which followed the same assumption of bacterial distribution in water as other researchers.10-12 However, Figure 1 demonstrates the deviation of the observed distribution from the assumed distribution showing some extraneous readings above the equivalent expected distribution range. According to Figure 2, data failed to follow Poisson distribution and hence the application of the ordinary U chart may give false warning signal(s). Thus, the use of Laney modification to correct for overage dispersion should be implemented.
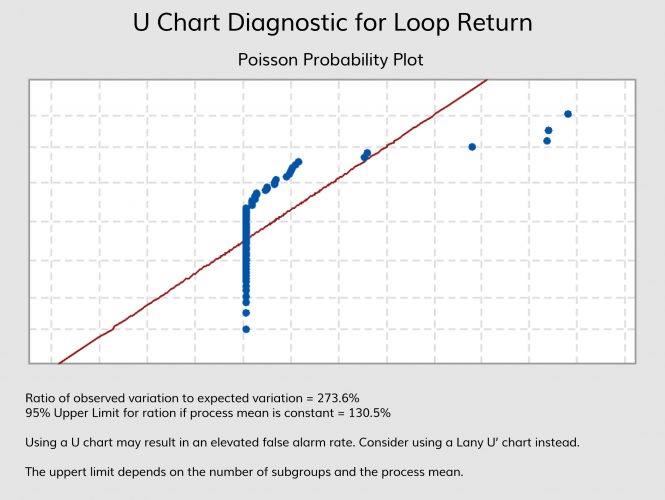
Figure 2: Test for evaluation of suitability of application of U chart directly or Laney U’ chart (generated using Minitab® 17.1.0).
Microbiological enumeration outcomes are considered as attribute data and can be trended using attribute type of control charts with Laney correction for over or under dispersion.14 However, there is evidence that both types of control chart (attribute and variable) may be equivalent in data processing in some studied cases.15 By analogy, applying both Laney U’ and Individual-Moving Range (I-MR) control charts – which are of attribute and variable types, respectively – showed that both Laney attribute and I variable yield the same control limits (CL) with the exception for the lower part of the graph where the microbial count is decreasing. Interestingly, due to the nature of bioburden data, quality control of microbiological nature is usually concerned with the upper half of the graph beyond the mean; ie, increasing microbial count. Thus, both charts may be sought as equivalent, while variable I-MR control charts may be more sensitive in detecting assignable-cause variations as it can detect eight different types of alarm compared to only four for attribute charts using a statistical software package.16
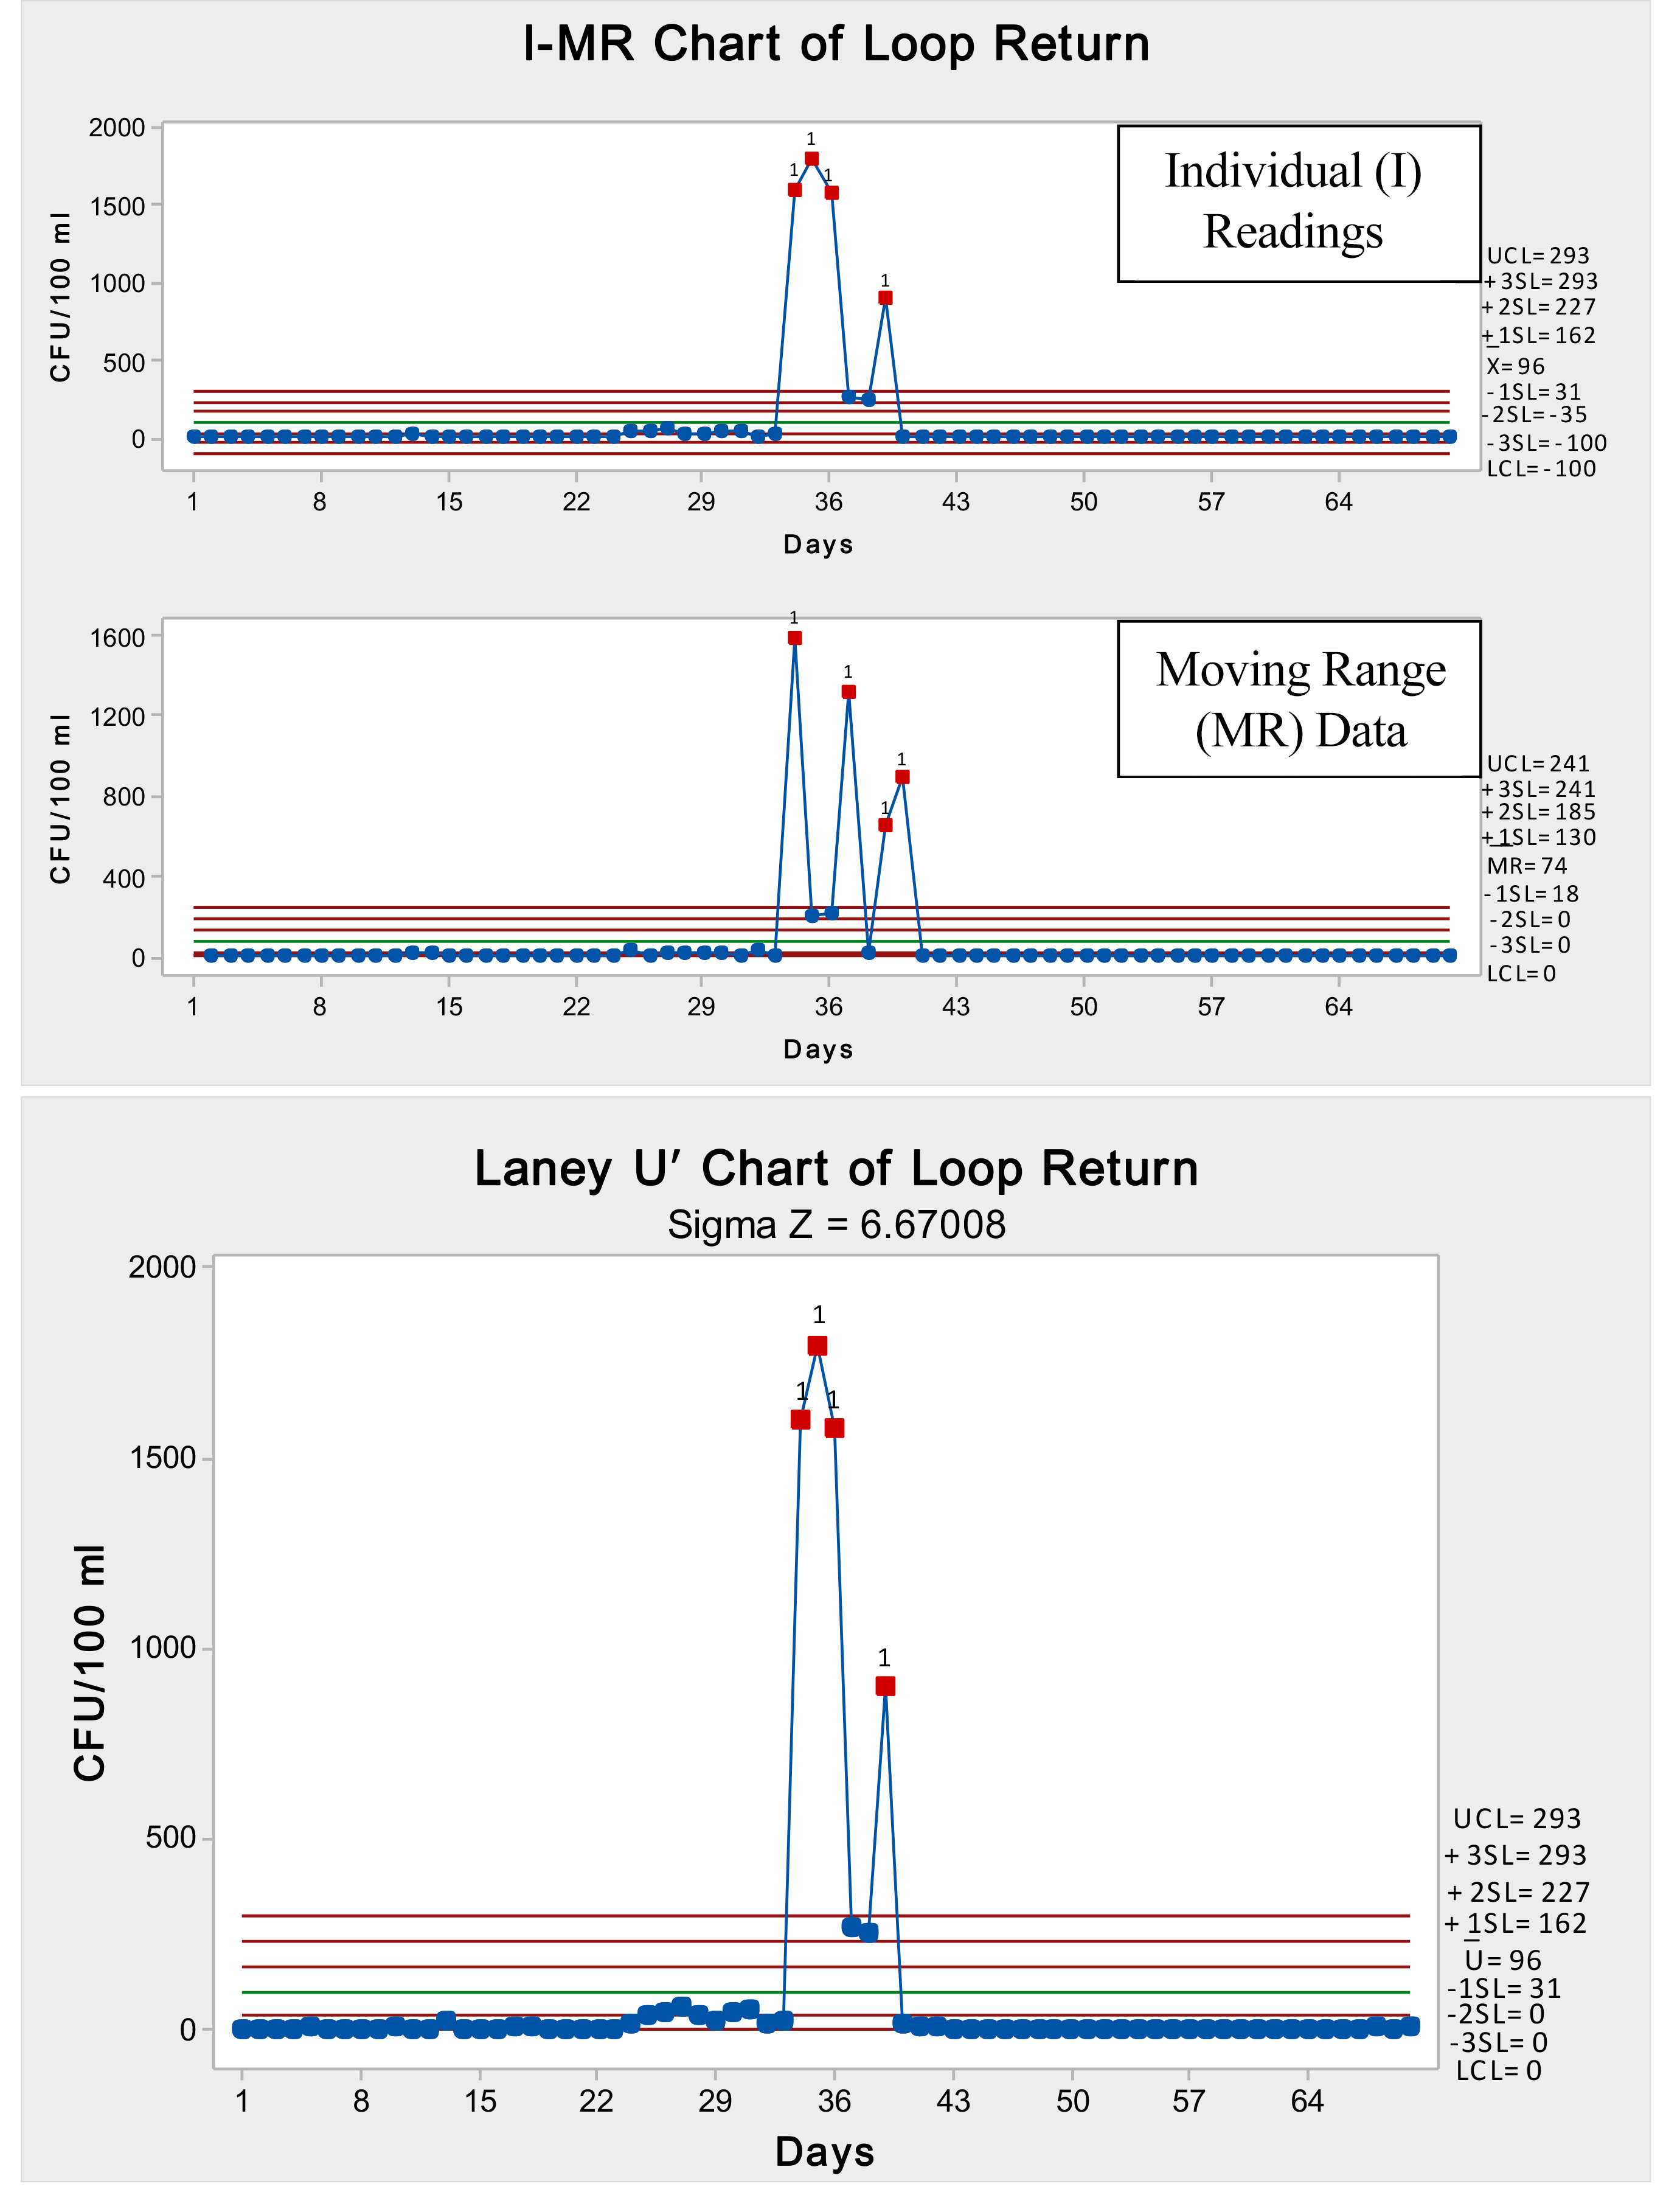
Figure 3: I-MR (upper graph) versus Laney U’ (lower graph) showing mean, control limits (CL), 1σ, 2σ and 3σ levels (generated using Minitab® 17.1.0).
Conclusion
Bioburden of PuW quality was in a state of statistical control, except for approximately a one-week interrupting period which experienced an abnormally elevated microbial count due to freak factors not pertaining to the normal process. This requires thorough investigation to guard against such aberrant results in the future and to set an appropriate corrective action and preventive action (CAPA). The present case showed that both Laney U’ and I-MR charts provided the same upper-half parameters for the control charts, which are critical of microbiological interest for the limits that should not exceed a certain value for alarm, trend and action criteria.
Column Statistics | Loop Return | Chi-square testΨ | |
Number of readings | 70 | Chi-square (observed value) | 58.3841 |
Minimum | 0.0 | Chi-square (critical value) | 63.1645 |
25th percentile | 0.0 | Number of degrees of freedom (DF) | 27 |
Median | 0.0 | p-value | 0.0004 |
75th percentile | 8.5 | α | 0.0001 |
Maximum | 1800 | Test interpretation | |
10th percentile | 0.0 | Null hypothesis H0: The sample follows a Negative binomial (2) distribution | |
90th percentile | 52 | ||
Mean | 96 | Alternative hypothesis Ha: The sample does not follow a Negative binomial (2) distribution | |
Standard Deviation | 353 | ||
Standard Error of Mean | 42 | As the computed p-value is greater than the significance level α = 0.0001, the null hypothesis H0 cannot be rejected. | |
Lower 99% CI† of mean | -16 | ||
Upper 99% CI† of mean | 208 | ||
Lower 99% CI† of median | 0.0 | The risk to reject the null hypothesis H0 while it is true is 0.04%. | |
Upper 99% CI† of median | 0.0 | ||
K2 | 88 | D’Agostino & Pearson omnibus normality test | |
P value | < 0.0001 | ||
Passed normality test (α = 0.01) | No | ||
P value summary | **** | ||
W | 0.30 | Shapiro-Wilk normality test | |
P value | < 0.0001 | ||
Passed normality test (α = 0.01) | No | ||
P value summary | **** | ||
KS distance | 0.46 | Kolmogorov–Smirnov (KS) normality test | |
P value | < 0.0001 | ||
Passed normality test (α = 0.01) | No | ||
P value summary | **** | ||
Coefficient of variation (CV) ‡ | 366.89% | Data deviates from the bell-shaped normal distribution as could be evident from skewness and kurtosis | |
Skewness | 4.1 | ||
Kurtosis | 16 | ||
Sum | 6737 | ||
Table 1: Goodness-to-fit and statistical analysis of microbiological results of PuW samples generated within 70 working days using XLSTAT Version 2014.5.03 and GraphPad Prism Version 6.01.
Ψ Poisson distribution assumption was discarded and the closest distribution that can approach fitting of the results was Negative Binomial of type 2 [13]. ‡ Relative standard deviation (RSD).
† Confidence Interval: 99% likelihood that the interim covers the populace parameter.
References
- El-Shaarawi AHB. Bacterial Density in Water Determined by Poisson or Negative Binomial Distributions [Internet]. PubMed Central (PMC). 2018 [cited 6 September 2018]. Available from: https://www.ncbi.nlm.nih.gov/pmc/articles/PMC243648/
- Essam Eissa M. Study of Microbial Distribution from Different Processing Stages in Purified Water Production Plant of Pharmaceutical Manufacturing Facility. Research & Reviews: Journal of Microbiology and Virology. 2016; 6(1): 31–45.
- Essam Eissa M. Investigation of Microbiological Quality of Water from the Feed Source to the Terminal Application in the Healthcare Facility: A Case Study. Health Research. 2018;2(1):16.
- Ashour MS, Mansy MS, Eissa ME. Microbiological environmental monitoring in pharmaceutical facility. Egypt Acad J Biolog Sci. 2011;3(1):63-74.
- Eissa M, Abid A. Application of statistical process control for spotting compliance to good pharmaceutical practice. Brazilian Journal of Pharmaceutical Sciences. 2018;54(2).
- Eissa M. Evaluation of Quality Characteristics and Process Stability for Pharmaceutical Dosage Form Using Attribute Control Charts. IJAMS. 2016. Dec 28;1(01).
- Eissa ME. Role of Statistical Process Control of Pharmaceutical Product to Monitor Consistency of the Manufacturing Operation. EC Pharmacology and Toxicology. 2018;6:439-44.
- Eissa ME, Mahmoud AM, Nouby AS. Control Chart in Microbiological Cleaning Efficacy of Pharmaceutical Facility. Dhaka University Journal of Pharmaceutical Sciences. 2016. Jun 28;14(2):133-8.
- Eissa M. Shewhart Control Chart in Microbiological Quality Control of Purified Water and its Use in Quantitative Risk Evaluation. UK Journal of Pharmaceutical Biosciences. 2016. Feb;4(1).
- Christian RR, Pipes WO. Frequency distribution of coliforms in water distribution systems. Applied and Environmental Microbiology. 1983. Feb 1;45(2):603-9.
- Haas CN, Heller B. Statistics of enumerating total coliforms in water samples by membrane filter procedures. Water Research. 1986. Apr 1;20(4):525-30.
- El-Shaarawi AH, Esterby SR, Dutka BJ. Bacterial density in water determined by Poisson or negative binomial distributions. Applied and Environmental Microbiology. 1981. Jan 1;41(1):107-16.
- McFeters GA. Drinking water microbiology: progress and recent developments. Springer Science & Business Media; 2013 Mar 7.
- Eissa ME. Application of Laney control chart in assessment of microbiological quality of oral pharmaceutical filterable products. Bangladesh Journal of Scientific and Industrial Research. 2017. Oct 3;52(3):239-46.
- Eissa ME. Variable and Attribute Control Charts in Trend Analysis of Active Pharmaceutical Components: Process Efficiency Monitoring and Comparative Study. Experimental Medicine. 2018. (1):31-44. DOI: 10.31058/j.em.2018.11003
- Minitab 17: Getting started with Minitab 17. Minitab Inc.; 2013.
Biography
MOSTAFA EISSA is Quality Compliance Section Head at Hikma Pharma Egypt. He joined the company – formerly ALKAN-pharma – in 2004 as a Quality Control Microbiologist. In 2009 he was promoted to Senior Microbiologist in 2009 and Microbiology Supervisor the following year. In 2013 he was appointed Microbiology Section Head. He has written a range of articles, which are published in scientific and cultural journals and magazines.
The rest of this content is restricted - login or subscribe free to access
 Thank you for visiting our website. To access this content in full you'll need to login. It's completely free to subscribe, and in less than a minute you can continue reading. If you've already subscribed, great - just login.
Why subscribe? Join our growing community of thousands of industry professionals and gain access to:
- bi-monthly issues in print and/or digital format
- case studies, whitepapers, webinars and industry-leading content
- breaking news and features
- our extensive online archive of thousands of articles and years of past issues
- ...And it's all free!
Click here to Subscribe today Login here
Issue
Related topics
Analytical techniques, Manufacturing, Research & Development (R&D)