

Spore.Bio illustrates an AI-native, rapid microbiological method (RMM) that offers simultaneous viable quantitation and microbial identification capabilities suited to a range of applications including bioburden tests, environmental monitoring, in-process, raw material and process water analyses.

Today’s rapid method technologies have numerous capabilities. They can detect the presence of diverse types of microorganisms or a specific microbial species, enumerate the number of microorganisms present in a sample, or identify microbial cultures to the genus, species and sub-species level. However, to our knowledge, there does not exist a rapid technology that provides simultaneous detection, enumeration and microbial identification, without pre-enrichment, viability staining or additional workflow steps. Until now.
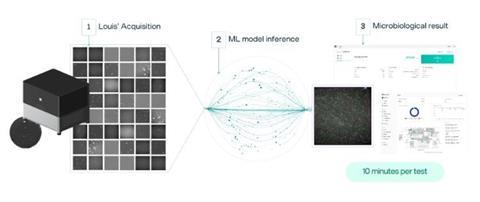
Overview of the Spore.Bio Louis technology
The Spore.Bio Louis System employs a transformer-based multimodal spectral imaging (TMSI) approach, integrating biophotonic hardware with artificial intelligence (AI)-based, deep machine learning models for microorganism detection. The technology collects viable organism signals in the visible, UV and near-infrared wavelengths. These signals are gathered as unique spectral fingerprints of the organisms at the single-cell level, which are fed into the models that were trained on thousands of real-world samples, representing millions of images. The end result is a rapid technology that operates without growth enrichment or labelling requirements, demonstrates compatibility across diverse sample matrices and enables simultaneous detection, quantitation and species-level identification within a unified analytical platform. Figure 1 depicts an overview of the Louis System.
The TMSI technology combines spectroscopic and spatial information to achieve single-cell resolution (400nm). The multispectral approach captures signals across six wavelengths under dual illumination at 405nm and 365nm, enabling the collection of both absorption data and intrinsic fluorescence from metabolic molecules such as NADH, flavins and porphyrin.
The combination of these molecular signatures, coupled with their spatial localisation within cells (eg, a signal stronger at the centre versus a diffuse signal within the cell), morphological aspect (eg, thickness of the membrane and shape of the organism) and their cumulative and relative fluorescence excitation intensities, generates a unique spectral signature that enables differentiation of microorganisms from inert particles or sample matrix components, alongside microbial identification at the species level.
This spectral data is used to train a transformer-based deep learning model. These models are a form of AI designed to analyse relationships in data by considering context – eg, spectral signals from nearby pixels within a microorganism, signals from adjacent particles, background pixels, etc. As such, these models can incorporate numerous variables to account for biological variability and were trained on millions of fields of view (FOV) across diverse matrices, stress conditions and environmental factors, broadening the spectrum of observed signatures. Among the conditions included in the models, Spore.Bio tested microorganisms artificially inoculated into or onto a variety of matrices, including Tryptone Salt diluent, various types of pharmaceutical process and food and beverage waters (eg, mineral, purified, rinse water), alcoholic beverages, surfaces in which the microorganisms were subsequently collected on swabs, and under stressed conditions (eg, after three days of inoculating microorganisms into mineral and purified waters).
To our knowledge, this is the first time a non-growth-based AMM/RMM has been trained to produce results as a CFU instead of a non-CFU signal
Additionally, the models accounted for dead cells as well as all non-viable particles and matrix components present in the test samples, including waters, beverages, environmental samples (particularly swab samples) and food dyes. The final result is reported as a colony-forming unit (CFU), as the model was trained to be comparable with the number of microorganisms recovered from the same inoculated samples using traditional methods. To our knowledge, this is the first time a non-growth-based AMM/RMM has been trained to produce results as a CFU instead of a non-CFU signal. We elucidate this strategy in a subsequent section of this whitepaper, supported by comparative microbiological data.
The general workflow begins with an initial filtration step of the test sample that captures all viable and non-viable particles larger than 0.4μm onto a single-use consumable composed of a polyethylene terephthalate (PET) membrane. An 8mm diameter membrane is used for simple matrices, while a 20mm diameter consumable is designed for more complex matrices, if needed – eg, when the sample contains higher concentrations of particles, such as 1-2 million particles/sample – to minimise clogging of the membrane which could compromise the technology’s ability to detect microorganisms.
Without the need for any growth enrichment or incubation step, the sample is immediately and directly scanned using the TMSI hardware, which acquires the spatial and spectral data that will be used to detect, enumerate and identify microorganisms present in the test sample. This data is processed on site by a model embedded in the hardware, providing CFU results per sample with a time-to-result (TTR) of seven minutes for the 8mm membrane and 45 minutes for the 20mm membrane.
A new signal that is comparable to the CFU
Many non-growth-based rapid methods have been known to report at least comparable or superior results when compared with traditional microbiology methods that utilise agar or broth media. In this case, the number of cell counts or detection events in the non-growth-based method may be greater than in the conventional assay. This has been understood to mean stressed, injured, dormant and/or viable but non-culturable (VBNC) cells were being recovered that may not necessarily grow in conventional media. For this reason, a direct correlation may not be possible between a CFU and a non-CFU signal.
Additionally, false positives may occur, where non-viable particles, interfering materials and/or background noise are identified as viable cells. This may result in acceptable test samples being identified as having contamination at levels above established acceptance levels when in fact, the samples are acceptable, from a microbiological contamination perspective.
To overcome these challenges, the Louis System has learnt to discriminate false positives from non-viable particles and only reports the presence of viable microorganisms, comparable to what would normally be detected and enumerated as a CFU. However, because the technology was initially trained to be comparable to the CFU, the current design is optimised to exclude the detection of organisms that would not grow on an agar plate – eg, VBNC. Spore.Bio is conducting extensive studies on VBNC, stressed and dormant microorganisms to determine the extent of VBNCs and if the existing model should be enhanced to detect these types of viable microorganisms.
A similar issue for non-growth-based methods is the potential to identify dead cells as viable microorganisms. Spore.Bio has completed a series of studies demonstrating that the signal from dead cells is discriminated out and are not reported as false positives, even in the presence of viable microorganisms. The results of these studies are presented in a subsequent section of this whitepaper.
Preliminary validation studies
Three rapid and alternative microbiological method validation guidance documents exist that the pharmaceutical industry has relied on for many years; namely, USP chapter <1223>, Ph. Eur. chapter 5.1.6 and PDA Technical Report #33 (TR33). PDA is in the process of finalising its 2026 revision to TR33 and the main author has previously presented these concepts at various technical conferences in the US and Europe.
Spore.Bio has performed validation studies for its early adopters according to the existing PDA TR33, USP and Ph. Eur. recommendations. Additional studies and statistical analyses, based on the company’s understanding of the upcoming revision to TR33, have been conducted. However, it should be noted that the studies described below present preliminary results from in-process design experiments using instrumentation and transformer-based deep learning models that continue to be optimised. As such, the data predict long-term system performance, although it is expected the additional optimisation work will further enhance system capabilities.
Accuracy
Accuracy was initially evaluated using a pure culture of Bacillus subtilis ATCC 6633 suspended in sterile Tryptone Salt broth. The suspension was diluted to provide a predicted challenge inoculum between 5 and 300 CFU. Aliquots of the suspensions were challenged in the LOUIS System (using the filtration workflow described above) and on Tryptic Soy Agar (TSA), the latter incubated for two days at 30-35°C. The same comparative approach was also performed using a mixed microbial suspension containing both a bacterium and a yeast, specifically B. subtilis and Candida albicans ATCC 10231.
The resulting CFU data from each method was compared against the predicted challenge inoculum levels and also between the methods. Both of these options are recommended in the upcoming revision to PDA TR33. When comparing the counts against the predicted challenge levels, the mean recovery per concentration together with its confidence intervals was established using a normal distribution (at each concentration separately) while making use of the logarithmic transformation of the recoveries. Non-inferiority was determined when the lower 95 percent confidence limit (LCL) for each spiked concentration level was above the non-inferiority margin of 70 percent. The results from this study are presented in Table 1.
Table 1. B. subtilis compared against the predicted challenge inoculum levels
| Inoculum Concentration(CFU/sample) | LOUIS System | Conventional Method | ||
|---|---|---|---|---|
|
Mean % Recovery |
95% LCL |
Mean % Recovery |
95% LCL |
|
|
5 |
191.8 |
132.7 |
175.7 |
147.8 |
|
25 |
155.5 |
134.3 |
202.3 |
185.8 |
|
50 |
154.9 |
136.9 |
176.1 |
164.4 |
|
100 |
142.2 |
117.8 |
181.8 |
173.9 |
|
300 |
136.5 |
126.3 |
122.8 |
116.5 |
Both the LOUIS System and the conventional method demonstrated non-inferiority when the recoveries were compared with the predicted challenge levels – ie, the 95 percent LCL was above 70 percent.
Separately, the recoveries from both methods were used to assess non-inferiority of the LOUIS System to the conventional method by using a Poisson distribution and calculating the ratios of the two means and the lower confidence limits at each spiked concentration. The same 70 percent non-inferiority margin was used in these analyses. The data from this study is presented in Table 2.
Table 2. B. subtilis comparing both methods
| Inoculum Concentration(CFU/sample) | Mean counts (CFU/sample) | Ratio LOUIS/Conventional Method × 100 | 95% LCL | |
|---|---|---|---|---|
|
Louis System |
Conventional Method |
|||
|
5 |
10.6 |
9.0 |
117.5 |
88.6 |
|
25 |
40.0 |
50.9 |
77.8 |
68.2 |
|
50 |
78.2 |
88.3 |
88.5 |
79.7 |
|
100 |
145.5 |
182.0 |
79.9 |
74.2 |
|
300 |
411.2 |
369.1 |
111.5 |
106.6 |
The recovery of B. subtilis in the LOUIS System was non-inferior to the recovery in the conventional method at all spiked concentrations except for the 25 CFU level, where the 95 percent LCL was just under the 70 percent non-inferiority margin. This discrepancy is not significant since the two challenge concentrations on either side of this data point (ie, 5 and 50 concentrations) exceeded the 70 percent acceptance criterion.
To demonstrate accuracy with mixed cultures, the same studies were repeated with suspensions composed of B. subtilis and Candida albicans. Tables 3 and 4 summarise the results.
Table 3. B. subtilis and C. albicans compared against the predicted challenge inoculum levels
| Inoculum Concentration(CFU/sample) | LOUIS System | Conventional Method | ||
|---|---|---|---|---|
|
Mean % Recovery |
95% LCL |
Mean % Recovery |
95% LCL |
|
|
5 |
248.2 |
160.7 |
137.7 |
99.0 |
|
25 |
167.2 |
129.5 |
147.0 |
128.2 |
|
50 |
126.0 |
107.9 |
131.7 |
114.5 |
|
100 |
112.5 |
101.2 |
117.0 |
104.4 |
|
300 |
108.5 |
97.8 |
106.9 |
98.6 |
Table 4. B. subtilis and C. albicans comparing both methods
| Inoculum Concentration(CFU/sample) | Mean counts (CFU/sample) | Ratio LOUIS/Conventional Method × 100 | 95% LCL | |
|---|---|---|---|---|
|
Louis System |
Conventional Method |
|||
|
5 |
14.6 |
7.4 |
196.2 |
148.2 |
|
25 |
44.3 |
37.3 |
118.8 |
103.4 |
|
50 |
64.3 |
66.9 |
96.2 |
86.3 |
|
100 |
113.6 |
118.1 |
96.1 |
88.6 |
|
300 |
328.4 |
322.3 |
101.9 |
97.1 |
The recovery of a mixture of B. subtilis and C. albicans in the LOUIS System was non-inferior to the recovery in the conventional method at all spiked concentrations.
Limit of quantitation (LOQ)
The same recovery data used in the Accuracy studies were used to determine the limit of quantitation (LOQ) in the LOUIS System. Here, we ran a weighted regression analysis in a Minitab statistical software program using the predicted spike concentrations between 5 and 300 CFU.
Because we did not include blank samples in our data set, we predicted the variance at a spike level of zero using a (standard) linear regression analysis on the sample standard deviations calculated for the spike levels. Then, the total variance and the standard deviation (SDEV) were calculated. The SDEV was used to determine an upper quantile at three times the SDEV, which is approximately at the significance level of 0.1 percent away from the intercept from the original weighted regression analysis. Translating this to a concentration level using the original weighted regression line, we calculated the LOQ.
Using the data from the Accuracy studies, the LOQ for B. subtilis was estimated to be 3.5 CFU. This was based on weighted regression analyses where and . Similarly, the LOQ for the B. subtilis and C. albicans mixture was estimated to be 9.0 CFU. This was based on weighted regression analyses where and . Overall, these initial studies demonstrated LOQs in the viable single cell range.
Linearity
Linearity can be defined as the ability to produce results that are proportional to the concentration of microorganisms present in the sample within a given range. An R2 value is an indirect measure of Linearity and generally speaking, an R2 larger than 90 percent indicates a good prediction of linearity. Although the larger the R2 value the less likely Linearity is violated, it is no guarantee that Linearity is true since it also depends on the range of spike levels being tested.
As such, additional tests for linearity are recommended. One such assessment is to apply a goodness-of-fit test to evaluate the appropriateness of Linearity by comparing the regression line with a more extensive model. For instance, one can add a quadratic term to the regression analysis. In this instance, the goodness-of-fit test should not be statistically significant (ie, the p-value should be ≥ 0.05).
Linearity across the range of the test was determined using the data from the Accuracy studies. From the weighted regression analysis described for LOQ, the estimated regression line (4.31+1.3907 × spike) for B. subtilis gave an estimated R2 = 96.50 percent, and the estimated regression line (10.99+1.0509 × spike) for the B. subtilis and C. albicans mixture gave an estimated R2 = 93.14 percent.
To determine if linearity was appropriate for the full range of spiked concentrations, the same weighted regression analysis for LOQ was performed as above, but this assessment included a quadratic term in the calculations. The resulting p-value for B. subtilis was 0.958, which was not statistically significant (the p-value was > 0.05), demonstrating linearity was appropriate for the full range of spiked concentrations. Similarly, the p-value for the B. subtilis and C. albicans mixture was 0.958, which also demonstrated linearity across the full range of spiked concentrations.
Is it dead or alive?
The LOUIS System was trained to differentiate live cells from dead cells. Figure 2 illustrates the analysis and spectral signal of live versus dead cell discrimination across seven distinct species. The multidimensional data was subjected to principal component analysis (PCA), an unsupervised statistical method, to generate a two-dimensional representation. The resulting clusters from the analysis are distinctly separated based on whether the organism is alive or dead (dead microorganisms are represented in blue and viable microorganisms are represented in black). This clear separation confirms the effectiveness of the spectral signatures in differentiating between the two groups.
Spore.Bio initially assessed the likelihood of the LOUIS System detecting dead cells by analysing the products from one of its early adopters in the alcoholic beverage industry. The products evaluated were two types of vermouth, which is an aromatised, fortified wine flavoured with botanicals that generally has an alcohol content of 15–18 percent. While vermouth starts with a wine base produced by yeast fermentation, the production process ensures no active yeast remains in the final, bottled product. In the case of Spore.Bio’s early adopter, Saccharomyces cerevisiae was the yeast used to manufacture the two types of vermouth and no viable yeast cells were expected to be present in the final products.
To test these assumptions, the entire contents of duplicate 500mL bottles of vermouth were separately filtered and processed in the LOUIS System. Similarly, the entire contents of duplicate 500mL bottles were filtered and plated onto Malt Extract Agar (MEA) and incubated for 48 hours at 30°C. This was repeated with the second type of vermouth, resulting in two replicates per type of test sample in both methods. Table 5 provides the results of this study.
Table 5. Vermouth study
| Inoculum Concentration | Sample | TYMC (CFU) | Total of cells (dead + viable) | |
|---|---|---|---|---|
|
Louis System |
Conventional Method |
|||
|
0 |
Vermouth A1 |
0 |
0 |
180 |
|
0 |
Vermouth A2 |
0 |
0 |
148 |
|
20 |
Vermouth A3 |
17 |
17 |
1,957 |
|
20 |
Vermouth A4 |
37 |
16 |
27,324 |
|
0 |
Vermouth B1 |
0 |
0 |
78 |
|
0 |
Vermouth B2 |
0 |
0 |
1,307 |
|
20 |
Vermouth B3 |
50 |
26 |
521 |
|
20 |
Vermouth B4 |
43 |
12 |
1,276 |
Zero CFU was detected in both the LOUIS System and the conventional agar plate methods. However, the total of dead cells was detected (but not enumerated) in the LOUIS System, specifically, 180 and 148 dead cells in one product, and 78 and 1307 dead cells in the second product. The discrepancy in the number of dead cells in the second product may be due to lot-to-lot or bottle-to-bottle variability, although this could not be confirmed. The dead cells were verified by manually examining the processed images and confirming the morphologies appear to be non-viable, large yeast cells.
A follow-up study was conducted to demonstrate that viable yeast cells, if present, would be detected and enumerated by both methods, and would be differentiated by the dead yeast cells that would be expected to be present in the product. The same procedure as described above was repeated, but low levels of Saccharomyces cerevisiae ATCC 9763 were inoculated into the products just prior to filtration and processing in the LOUIS System or plated on agar. The LOUIS System enumerated 17 and 37 CFU and the conventional method enumerated 17 and 16 CFU in the first vermouth product. The number of dead plus viable cells in this experiment was confirmed to be 1,957 and 27,324. Similarly, the LOUIS System enumerated 50 and 43 CFU and the conventional method enumerated 26 and 12 CFU in the second vermouth product. The number of dead plus viable cells in this experiment was 521 and 1,276.
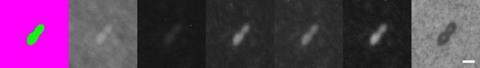

The top image of Figure 3 shows viable cells of Saccharomyces cerevisiae ATCC 9763, while the bottom image shows dead cells of the same species naturally present in the vermouth sample. The seven images display the model’s detection results alongside the corresponding camera captures. From left to right, the first image shows the bicolour detection mask generated by the model, followed by the camera images presented sequentially from Camera 5 to Camera 0 – each focusing on a distinct segment of the spectrum. In the bicolour view, live microorganisms (MO) are shown in green, while dead cells, particles or background are shown in purple. Each pixel is classified into one of these two categories. The white scale bar, 20 pixels long, corresponds to 5µm.
Overall, microorganisms exhibit a higher signal than dead cells, as illustrated in Figure 3. However, a deeper analysis reveals that dead yeast cells are identified using Camera 4 (centred at 550nm). On this specific camera, dead microorganisms show an elevated signal-to-background ratio compared to live cells. This is likely due to the increased membrane porosity of dead cells, which facilitates a greater accumulation of matrix material within them.
These results clearly demonstrate that under the conditions of the test, the LOUIS System was able to differentiate and discriminate viable signals from non-viable or dead cell signals, eliminating the potential for false positives in the sample matrices evaluated. Regarding the observed wide range of dead cells in this experiment, we understand there can exist variability in the number of dead yeast cells in the finished product, which can vary from batch to batch and even from bottle to bottle.
Avoiding an identity crisis
Although there are numerous AMM/RMMs that can detect and/or enumerate microorganisms, most are unable to simultaneously identify these organisms to the Genus and species level. For example, growth-based methods will produce CFUs or growth in liquid media, which can then be subcultured for subsequent analyses, including microbial identification using a different test method, such as biochemical characterisation, 16S rDNA and next generation sequencing, fatty acid analysis, MALDI-TOF mass spectrometry or Raman spectroscopy. However, most commercially available, non-growth-based AMM/RMMs either do not have the direct capability to identify microorganisms or are considered destructive by design – ie, there is no process by which detected microorganisms can be used for further testing, including microbial identification.
Conversely, the LOUIS System is capable of generating spectral fingerprints of previously analysed microorganisms that allow for microbial identification if the system ‘sees’ the same spectral fingerprint in subsequent analyses. Accordingly, the LOUIS System can operate as a standalone microbial identification platform, in which pure cultures of microorganisms, such as those obtained from isolated colonies, can be introduced into the technology and a microbial identification to the species level acquired, provided that same microorganism has been previously analysed and added to the system’s spectral fingerprint library.
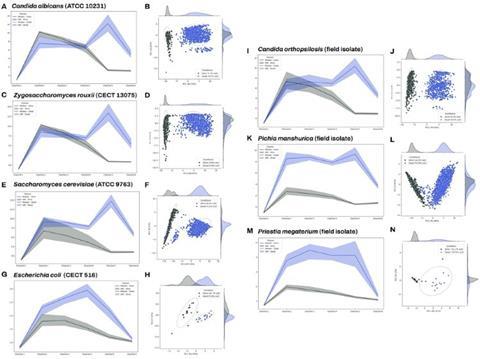
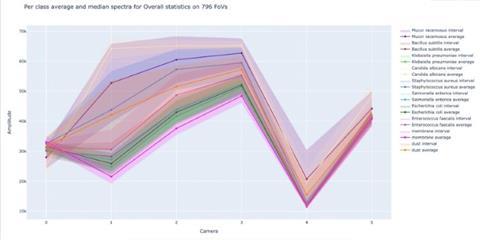
To assess the discriminative capabilities of the machine-learning model across a diverse range of microorganisms, Gram-positive and Gram-negative bacteria, yeasts and moulds were evaluated in the system based on their spectral signatures. Figure 4 illustrates the class-specific spectral signatures extracted across the six acquisition channels (cameras) and summarises the distribution of responses for each class over 796 fields of view. For each microorganism, the mean spectrum is shown together with an interval band (shaded area) reflecting within-class variability.
the machine-learning model leverages reproducible, class-dependent spectral fingerprints to enable microorganism discrimination at the single-object level”
Despite partial overlap between some organisms, the profiles exhibit distinct multichannel patterns (differences in relative intensity and curvature across channels), providing discriminative information beyond overall amplitude. Importantly, non-biological classes (eg, dust and membrane) display different response patterns, supporting the model’s ability to distinguish microorganisms from inert particles and matrix elements. Overall, the figure highlights that the machine-learning model leverages reproducible, class-dependent spectral fingerprints to enable microorganism discrimination at the single-object level.
To demonstrate this capability, a panel of microorganisms was selected based on their inclusion in the USP as growth promotion and method suitability organisms, as well as additional species requested to be tested by Spore.Bio’s early adopters. These were cultivated using conventional techniques, isolated on solid media and resuspended in a Tryptone Salt solution. A 50µL aliquot of the suspension was deposited onto the LOUIS System membrane consumable, filtered and introduced into the technology workflow. In addition to the panel of microorganisms used for inclusivity testing, non-target strains were incorporated for exclusivity testing. When the confidence level of the spectral fingerprint is above an internally specified acceptance criterion, a microbial identification is reported. Conversely, if the confidence level of the spectral fingerprint is below the acceptance criterion, the system indicates that the microorganism is not recognised by the model and no microbial identification is reported. The latter would be the case for a microorganism that has not been previously analysed and added to the system’s identification library. Table 6 provides a summary of the microorganisms used and the results of the study.
Table 6. Microorganism identification testing
| Microorganisms | Strain | # Replicates | Correct Identification | IncorrectIdentification | NoIdentification |
|---|---|---|---|---|---|
|
Bacillus subtilis |
ATCC 6633 |
3 |
100.0% |
0.0% |
0.0% |
|
Staphylococcus aureus |
ATCC 6538 |
3 |
100.0% |
0.0% |
0.0% |
|
ATCC 25923 |
3 |
66.7% |
0.0% |
33.3% |
|
|
CECT 59 |
3 |
100.0% |
0.0% |
0.0% |
|
|
Burkholderia cepacia |
CECT 322 |
3 |
100.0% |
0.0% |
0.0% |
|
CECT 4091 |
3 |
100.0% |
0.0% |
0.0% |
|
|
CECT 4137 |
3 |
66.7% |
0.0% |
33.3% |
|
|
Pseudomonas aeruginosa |
ATCC 10145 |
3 |
100.0% |
0.0% |
0.0% |
|
CECT 108 |
3 |
66.7% |
0.0% |
33.3% |
|
|
CECT 116 |
3 |
100.0% |
0.0% |
0.0% |
|
|
Pseudomonas fluorescens |
ATCC 13525 |
3 |
100.0% |
0.0% |
0.0% |
|
Escherichia coli |
CECT 99 |
3 |
100.0% |
0.0% |
0.0% |
|
CECT 434 |
3 |
100.0% |
0.0% |
0.0% |
|
|
CECT 516 |
3 |
100.0% |
0.0% |
0.0% |
|
|
Klebsiella pneumoniae |
ATCC 13883 |
3 |
100.0% |
0.0% |
0.0% |
|
Pluralibacter gergoviae |
CECT 857 |
4 |
100.0% |
0.0% |
0.0% |
|
Salmonella enterica |
ATCC 14028 |
3 |
66.7% |
0.0% |
33.3% |
|
CECT 722 |
3 |
100.0% |
0.0% |
0.0% |
|
|
CECT 4155 |
3 |
100.0% |
0.0% |
0.0% |
|
|
Candida albicans |
ATCC 10231 |
3 |
100.0% |
0.0% |
0.0% |
|
CECT 1392 |
3 |
66.7% |
0.0% |
33.3% |
|
|
CECT 13118 |
3 |
66.7% |
0.0% |
33.3% |
|
|
Aspergillus brasiliensis |
CECT 2574 |
3 |
100.0% |
0.0% |
0.0% |
|
Overall |
- |
70 |
91.5% |
0.0% |
8.5% |
A total of 70 samples were analysed, involving multiple microorganisms. Six primary organisms were tested: Staphylococcus aureus, Burkholderia cepacia, Pseudomonas aeruginosa, Escherichia coli, Salmonella enterica and Candida albicans. For each of these microorganisms, three distinct strains were used, with three replicates per strain. Due to limited accessibility to a wider diversity of strains, only a single strain was tested for Pluralibacter gergoviae, Bacillus subtilis, Pseudomonas fluorescens, Klebsiella pneumoniae and Aspergillus brasiliensis. While most single-strain tests were conducted in triplicate, Pluralibacter gergoviae was tested with four replicates. Each replicate at the strain level was produced on the same day, on the same machine and by the same operator.
Across the 70 samples tested, the model provided an identification in 91.5 percent of cases, with all identifications being 100 percent correct to the species level. Strains that were not identified provided a response to the model that was below the internal threshold for an accurate identification. This was observed for only six replicates out of the 70 replicates examined.
We plan to address the model and improve confidence by significantly expanding our current training dataset over the coming months, with more species, strains and replicates per strain. We are confident the model can be improved, as multiple replicates provide correct identification in this study. The dataset size is expected to increase significantly in the near future.
The study demonstrates the LOUIS System is capable of providing a correct microbial identification from pure cultures when the strain’s spectral fingerprint is in the system’s microbial identification library”
The study demonstrates the LOUIS System is capable of providing a correct microbial identification from pure cultures when the strain’s spectral fingerprint is in the system’s microbial identification library. The next phase involves expanding the training library to enhance performance and broaden the panel of microorganism tests, including the integration of exclusion studies, in which strains absent from the database will not result in incorrect identifications.
Spore.Bio is in the process of further enhancing LOUIS’ capabilities to provide microbial identifications directly from detected and enumerated viable particles in addition to what was described above for pure cultures. This advancement will enable the industry to simultaneously detect, enumerate and identify microorganisms down to the species level in sample matrices. This can be accomplished within minutes of processing, eliminating the need for isolating colonies, pre-enrichment or staining. This capability, aptly named QuantID, will be available later in the year.
Overall, these studies confirm that the identification model can reliably differentiate a broad range of microorganisms, providing a clear path to further refinement for the identification of never-before-detected microorganisms through additional training and expanded strain diversity. Actually, the model has already been successfully implemented in a factory setting to rapidly identify critical species from environmental monitoring samples.
Separating total aerobic microbial count from total combined yeasts & moulds count
Our initial step towards QuantID has been the development of a multi-quantification test for bioburden, which simultaneously measures total aerobic microbial counts (TAMC) and total combined yeasts and moulds counts (TYMC).
USP <61> provides the requirements for the quantitative enumeration of mesophilic bacteria and fungi that may grow under aerobic conditions. The tests described are designed primarily to determine whether a substance or preparation complies with an established specification for microbiological quality. Because many substances that would be evaluated according to USP <61> have individual specifications for TAMC and for TYMC, it is expected to perform two tests and obtain two separate counts: one using Soybean-Casein Digest Agar for TAMC, and one using Sabouraud Dextrose Agar for TYMC.
When interpreting the results from the USP <61> tests, the TAMC is considered to be equal to the number of CFU found using Soybean-Casein Digest Agar; if colonies of fungi are detected on this medium, they are counted as part of TAMC. The TYMC is considered to be equal to the number of CFU found using Sabouraud Dextrose Agar; if colonies of bacteria are detected on this medium, they are counted as part of TYMC. However, when the TYMC is expected to exceed the acceptance criterion due to the bacterial growth, Sabouraud Dextrose Agar containing antibiotics may be used. This can be interpreted to mean one can use antibiotics to diminish the growth of bacteria on the yeast and mould medium to obtain a more accurate estimation of the number of yeasts and moulds in the test sample.
One way the pharmaceutical microbiology laboratory can realise efficiencies when performing USP <61> is to condense the TAMC and TYMC tests into a single workflow. Spore.Bio has enhanced the LOUIS System to accomplish this goal by training the system to separately report TAMC and TYMC results.
Working with its early adopters in the beverage industry, samples of commercially available mineral water were inoculated with Acinetobacter johnsonii (ie, a bacterial species that was previously isolated from the same mineral water used in this study), Candida albicans ATCC 10231 and Aspergillus brasiliensis ATCC 16404. The inoculated samples were processed in the LOUIS System and in the TAMC and TYMC conventional methods (ie, Plate Count Agar; PCA and MEA, respectively). A conventional plating on MEA was not performed for the yeast and mould. Table 7 shows the reported number of CFU/mL for both TAMC and TYMC.
Table 7. Bacteria and yeast testing in mineral water. ND = not done
| Challenge Organism | Inoculum Concentration(CFU/mL) | LOUIS System | Conventional Method | ||
|---|---|---|---|---|---|
|
TAMC (CFU/mL) |
TYMC (CFU/mL) |
TAMC (CFU/ml) |
TYMC (CFU/mL) |
||
|
Acinetobacter johnsonii |
50 |
54 |
0 |
68 |
0 |
|
50 |
77 |
0 |
69 |
0 |
|
|
150 |
151 |
0 |
113 |
0 |
|
|
150 |
96 |
0 |
145 |
0 |
|
|
150 |
108 |
0 |
100 |
0 |
|
|
150 |
83 |
0 |
182 |
0 |
|
|
250 |
352 |
0 |
251 |
0 |
|
|
250 |
339 |
0 |
276 |
0 |
|
|
500 |
536 |
0 |
500 |
0 |
|
|
500 |
872 |
0 |
675 |
0 |
|
|
Candida albicans ATCC 10231 |
100 |
88 |
90 |
115 |
ND |
|
250 |
288 |
258 |
309 |
ND |
|
|
1,000 |
998 |
1,170 |
950 |
ND |
|
|
Aspergillus brasiliensis ATCC 16404 |
50 |
43 |
36 |
33 |
ND |
It was expected that the bacterial challenge would only be detected by the TAMC methods and not the TYMC methods (ie, in the LOUIS System and the conventional method). This is what was observed: both the LOUIS System and the conventional plate count methods recovered bacterial TAMC CFUs in the range of the inoculum concentrations. No bacterial CFUs were recovered on the TYMC agar and no CFUs were reported as TYMC in the LOUIS System. This demonstrated the LOUIS System was able to differentiate the bacterial signal from a yeast and mould signal and report the counts in the appropriate model.
Likewise, it was expected that the yeast and mould challenges would be detected in both the TAMC and TYMC methods, as the TYMC would be a component of the TAMC. Both the LOUIS System and the conventional plate count methods recovered fungal TAMC CFUs in the range of the inoculum concentrations. In fact, similar recoveries were observed for the LOUIS TAMC and TYMC, which we would expect based on the manner in which the models were designed. These data clearly demonstrate the ability of the LOUIS System to provide both a TAMC and a TYMC similar to what is required in the compendia when testing non-sterile pharmaceutical dosage forms. The difference is that the LOUIS System can do this in a single rapid assay, where the compendia test requires two types of growth media to arrive at the same conclusion, but with a time to result up to five days later for a TAMC result, and up to seven days later for a TYMC.
Additional studies are planned to use a mixture of bacteria and yeast/mould and using the agar media specified in USP <61>, to demonstrate TAMC will be reported for both types of microorganisms, but only the yeast/mould will be reported as TYMC.
Summary
The pharmaceutical industry would benefit from an alternative microbiological method that affords a rapid time to result while providing simultaneous viable quantitation and microbial identification. The Spore.Bio LOUIS System is a novel AI-driven, high-resolution optical microbiology technology that delivers each of these attributes for a wide range of applications, including bioburden tests, environmental monitoring, in-process, raw material and process water analyses, and later this year, finished product sterility testing.
The company’s next steps will focus on its full primary validation and the assessment of a broader selection of strains, including viable but nonculturable (VBNC) and stressed cells. Additionally, comparability will be demonstrated for bioburden and sterility testing across a diverse set of pharmaceutical dosage forms, filtrable and non-filtrable matrices, such as powders, vaccines, small and large molecules. As the LOUIS System is already in place with several early adopters for finished product and environmental testing, deployment within the pharmaceutical industry is expected to accelerate throughout 2026.
About the authors
Michael J Miller, Vice President, Scientific & Regulatory Affairs, Spore.Bio
Dr Michael J Miller is the President of Microbiology Consultants, and the owner of rapidmicromethods.com, a website dedicated to the advancement of rapid methods. He is an internationally recognised microbiologist and subject matter expert in pharmaceutical microbiology and the design, validation and implementation of rapid microbiological methods. Dr Miller has authored over 100 technical publications and presentations in the areas of microbiology, ophthalmics, disinfection and sterilisation, and is the editor of the PDA’s Encyclopedia of Rapid Microbiological Methods. He was the chairperson for the revision of PDA Technical Report #33: Evaluation, Validation and Implementation of New Microbiological Testing Methods.
Maxime Mistretta, CTO & Cofounder, Spore.Bio
Maxime Mistretta is a Founder and the current CTO & Application Lead at Spore.Bio. A scientist specialising in the intersection of Machine Learning (ML), hardware, and biology, he spearheads R&D, from developing foundation models to deployment and IP strategy. His work expands Spore.Bio’s portfolio across industrial and clinical use cases, as well as new frontiers. He is also responsible for scaling and structuring the infrastructure to accelerate the global deployment of the company’s solutions.
Arthur Vive, Research Lead, Spore.Bio
Arthur leads research initiatives at Spore.Bio, building core machine learning models and fostering a research culture aligned with business impact. An engineer trained at Centrale Paris and a statistician at the University of Chicago, he previously spent seven years at Oracle designing and scaling advanced ML systems for major advertisers. At Spore, he applies this expertise to mission-driven AI, focused on detecting pathogens in hours instead of days.
Dr Marine Pottier, Microbiology Lead, Spore.Bio
Dr Marine Pottier is a microbiologist and subject matter expert in microbial detection technologies, antimicrobial resistance, and omics sciences. As Lead Microbiology at Spore.Bio, she oversees the development of proprietary databases for training AI detection models on industrially relevant flora, adapts the technology to new use cases (including sterility testing, pathogen detection, and species identification), and validates method performance against regulatory reference standards. She also co-supervises a PhD thesis in partnership with the Institut Pasteur.
Ludovic de Boilevin Kayl, Senior Research Data Scientist, Spore.Bio
Ludovic is currently a Senior Research Data Scientist at Spore.Bio, where he develops artificial intelligence solutions to transform quality control in microbiology using deep learning, computer vision, and scalable data engineering, from R&D through industrial deployment.
He completed a PhD in applied mathematics at Inria Paris and Sorbonne Université and engineering studies at Centrale Paris, developing strong technical skills in mathematics and computing (optimization, numerical simulation, algorithmic development, and software engineering). He has published around ten papers in peer-reviewed journals, presented at international scientific conferences, and contributed to projects spanning fundamental research and industrial applications.
Valentina Di Proietto, Senior Research Data Scientist, Spore.Bio
Valentina recently joined Spore.Bio as a Senior Research Data Scientist to accelerate R&D and push the boundaries of machine learning models. She holds a PhD in Mathematics and conducted research at top institutions across Europe, Canada, and Japan, publishing multiple peer-reviewed papers in arithmetic algebraic geometry and speaking at international conferences.
After being promoted to Senior Lecturer, she transitioned to applied data science, captivated by its potential for real-world impact. She previously worked as a Data Scientist at Tribun Health and Owkin, designing and deploying deep learning models on multimodal patient data (histopathology images, clinical records, and genomic data) to predict cancer outcomes. She led several academic and pharmaceutical collaborations resulting in publications and, with two teammates, won a Kaggle gold medal in the UBC-OCEAN competition for classifying ovarian cancer subtypes.
Ali Keshavarzi, Data Scientist, Spore.Bio
Ali holds a PhD in AI and computer vision for medical imaging, specializing in anatomically consistent 3D airway-tree modeling from chest CT scans. His research focused on robust deep learning strategies (domain adaptation, curriculum learning) and topology-/structure-aware objectives, with applications to large-scale clinical data. His work has been recognised with Best Poster and Travel Awards and multiple competitive fellowships (IEEE, Hi! PARIS, E4H), a full merit-based Master’s scholarship, and a fully funded PhD, with his research selected among the top 16 IP Paris DeepTech laureates.
Alexandre Banon, Data Scientist, Spore.Bio
Alexandre is a Data Scientist at Spore.Bio, focusing on solving complex problems through data analysis and machine learning, with an emphasis on practical and scalable solutions, a role he has held for the past year and a half.
Prior to Spore.Bio, he spent four years in a startup developing pathogen diagnostic solutions, gaining a strong end-to-end understanding of data projects, from raw data and experimentation to production-ready models and process optimization, by working across biological sample preparation, spectroscopy, and machine learning.
Maïwenn Lefebvre, Microbiology Engineer, Spore.Bio
Maïwenn Lefebvre is a Microbiology R&D Engineer specialising in microbial quantification in complex matrices and serving as the microbiology referent across multiple industrial use cases at Spore.Bio. At just 22, she drives the development of microbiology strategies for challenging samples (beverages, powders, production environments, etc.), designing pretreatment protocols and generating critical data for Spore.Bio’s next-generation detection models.
Olivia Traore, Microbiology Lab Technician, Spore.Bio
Olivia Traoré is a Research Assistant at Spore.Bio, specialising in applied microbiology and high-quality data generation to support the development of next-generation microbiological detection technologies. Originally from Clermont-Ferrand, she holds a DUT in Biological Engineering and brings over 7 years of experience as a microbiology technician in the food and cosmetics industries, having worked at TERANA and SICAF COSMETIQUES. This experience has given her strong expertise in quality control microbiology and delivering reliable results at scale in regulated environments.
At Spore.Bio, Olivia is a key contributor to the identification project, where she designed and implemented the experimental workflow and generated the core dataset. Her work enables species-level identification of microorganisms from isolated colonies on agar plates. Her strength lies in bridging rigorous laboratory execution with structured data generation, ensuring robustness, reproducibility, and scalability of experimental pipelines.
Emilia Humeau, Microbiology Lab Technician, Spore.Bio
Emilia is a laboratory technician in microbiology, leveraging her industrial experience in the R&D team at Spore.Bio since September 2023. After obtaining her DUT and a bachelor’s degree focused on agri-food in La Rochelle, she spent four years at Laïta, one of France’s largest dairy groups, analyzing the microbiological quality of various food products and the environment. Her knowledge ensures Spore.Bio’s work aligns with current practices in the agri-food industry.


No comments yet