High content imaging subpopulation analysis for phenotypic drug discovery
Posted: 19 June 2008 | Jonathan Low and Louis Stancato, Department of Cancer Growth and Translational Genetics, Eli Lilly and Company, Indianapolis | No comments yet
Phenotypic drug discovery (PDD) has come of age – again. Using a microscope to observe a cell, one of the oldest techniques available to a cellular biologist dates back to the 17th century studies of Antony van Leeuwenhoek and his characterisation of ‘animalcules’. These early analyses, which simply described the appearance of a cell or group of cells, are the basis for today’s phenotypic assays. Although this early work might seem irrelevant when compared to the powerful array of tools that modern science brings to bear on a problem, the use of cellular phenotype as a method of scientific investigation evolved over time into the primary method of drug discovery up through the 1970s. Cellular phenotypes and the phenotypic changes induced upon compound treatment were commonly followed in both basic science and drug discovery[1-3] and even led to the development of early forms of automated data acquisition and analysis[4].
Phenotypic drug discovery (PDD) has come of age – again. Using a microscope to observe a cell, one of the oldest techniques available to a cellular biologist dates back to the 17th century studies of Antony van Leeuwenhoek and his characterisation of ‘animalcules’. These early analyses, which simply described the appearance of a cell or group of cells, are the basis for today’s phenotypic assays. Although this early work might seem irrelevant when compared to the powerful array of tools that modern science brings to bear on a problem, the use of cellular phenotype as a method of scientific investigation evolved over time into the primary method of drug discovery up through the 1970s. Cellular phenotypes and the phenotypic changes induced upon compound treatment were commonly followed in both basic science and drug discovery[1-3] and even led to the development of early forms of automated data acquisition and analysis[4].
Phenotypic drug discovery (PDD) has come of age – again. Using a microscope to observe a cell, one of the oldest techniques available to a cellular biologist dates back to the 17th century studies of Antony van Leeuwenhoek and his characterisation of ‘animalcules’. These early analyses, which simply described the appearance of a cell or group of cells, are the basis for today’s phenotypic assays. Although this early work might seem irrelevant when compared to the powerful array of tools that modern science brings to bear on a problem, the use of cellular phenotype as a method of scientific investigation evolved over time into the primary method of drug discovery up through the 1970s. Cellular phenotypes and the phenotypic changes induced upon compound treatment were commonly followed in both basic science and drug discovery[1-3] and even led to the development of early forms of automated data acquisition and analysis[4].
Although early phenotypic discovery was successful in bringing drugs into the marketplace, in the 1980s the pharmaceutical industry widely switched its focus to a target-based approach in which large chemical libraries were screened against individual enzymatic targets in vitro. This target-based approach to drug discovery (TDD), used in conjunction with high throughput screening and combinatorial chemistry, has remained the industry standard for several decades. Recently, however, productivity in pharmaceutical research and development, as measured by the number of new medical entities (NME), has been declining and it is clear that methods complementary to TDD must be employed5,6. In addition to advances in instrumentation, informatics, and chemical libraries, PDD is now used as an additional method to bring novel therapies to market. PDD is an ideal complement to TDD, where the focus is on a compound’s effect on a single target in vitro, but ignores potential effects on other targets, both positive and negative.
Although many successful compounds have been, and will continue to be, launched using the target-based approach (and its focus on the disruption of specific biological events), PDD places increased emphasis on the overall biological response (phenotype) and allows a pathway driven, holistic approach incorporating multiple potential targets and processes. This resurgence in PDD also increases the possibility of identifying and successfully advancing compounds previously missed or rejected using target-based screens. For example, compounds previously ignored due to lack of efficacy at a single target, or conversely, deemed ‘promiscuous’ in their activity, may now have a path forward for lead generation. In effect PDD strategy dictates that the cell itself serves as a model for a particular disease state, and essentially becomes the ‘target’. The likelihood of identifying compounds with a unique mechanism of action is therefore increased relative to TDD where targeting proteins in the absence of cellular context limits so-called ‘druggable’ space. The total overall phenotypic effect of a compound acting in this manner in a PDD assay in vivo may be more desirable due to synergy between its effects across multiple targets, than that of a compound with a greater affinity to a single target (typically identified in TDD). In this way compound families perhaps initially rejected due to so-called promiscuity may become beneficial tools, or even starting points for eventual lead generation.
As mentioned, the integration of PDD with current high throughput screening and combinatorial chemistry techniques is an ideal method to open up target space by interrogating the cell as a whole. High content imaging (HCI), including recent advances in data acquisition, analysis, and interpretation is reinvigorating the field of PDD. This technique, combining simple microscopy with modern immunofluorescent technology and data reduction tools, allows for an unparalleled view of cellular processes and therefore demonstrates a treatment’s phenotypic effect more thoroughly than ever before. In addition to the technological advancements in the field of HCI, development of extremely powerful techniques such as genome-wide cDNA expression systems and gene knock-down technology (siRNA, shRNA, and anti-sense oligonucleotides) lend themselves to exploitation of this technology for pharmaceutical development and open up new insights into cellular function and disease progression. As the number of NMEs registered with the FDA declines, the systems-level integration of HCI and PDD with existing methods of target-based discovery and systems biology are one way in which the pharmaceutical industry may reverse this trend7,8.
Although HCI advancements in the past decade have increased the use of phenotypic approaches to drug discovery, there is still room for improvement in how this technology is used to elucidate changes across a population of cells. A current limitation in the use of HCI technology is that although users more frequently employ multiple markers in a single assay, they only observe the effects of treatment on the cellular population as a whole. Many current high content imagers generate population data from each individual cell in a well, but these data are most commonly displayed as an aggregate of the total population. While this approach is an acceptable method for detecting an average effect on a population or trend, it does not discern how individual cells respond to treatment. As a result, the operator fails to identify the potential subpopulations that respond differentially to treatment and how those differing subpopulations may relate back to the disease state. These total population reads can therefore be misleading; for instance a treatment generating a large effect in a small subset of cells creates a similar result at the population level as a treatment with a small effect in each cell in the population. In this way, total population based HCI assays offer no advantage to less sophisticated techniques such as whole cell ELISAs. However, with current informatics tools the analysis of HCI data is not only possible but advantageous. These characterisations of the differing subpopulations which do not move in unison can be critical in diseases where a subset of the population responds differently to treatment, but is responsible for driving the disease, such as in the case of cancer stem cells9.
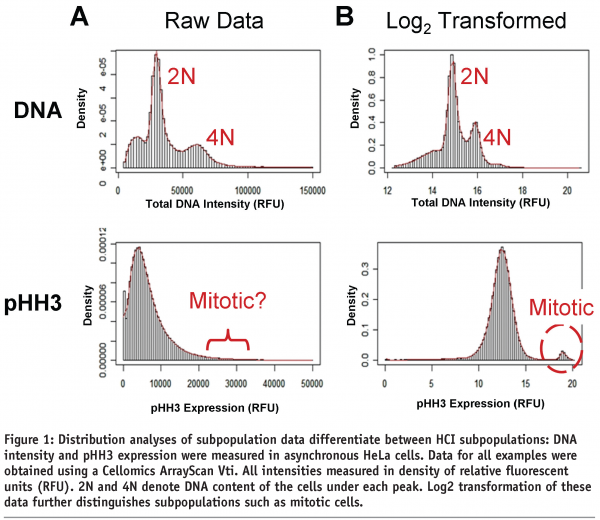
The first step in the process of data analysis is to observe the distribution of the cells across a single parameter. The cell cycle, with its multiple well characterised subpopulations in the G1, S, G2, and M phases, serves as an excellent simple illustration of subpopulation analysis. As an example, untreated HeLa cells were stained with Hoescht dye to determine DNA content, and with an antibody recognising the mitotic sentinel, phosphorylated histone H3 (pHH3) (Figure 1). As the cells replicate their DNA in S phase DNA content increases and remains high until mitotic division, while pHH3 peaks in mitosis as the cells condense their nuclear material. A simple distribution of the DNA content and pHH3 expression in these cells suggests, as expected, that there are multiple populations represented (Figure 1A). Transformation of those same data using a Log2 transformation converts a multiplicative scale into an additive scale and further distinguishes these populations by reducing the influence of outliers such as those caused by cell clumps (Figure 1B)10. These simple univariate distributions of data begin to distinguish one subpopulation from another, but are limited in terms of data content due to the focus on single endpoints.
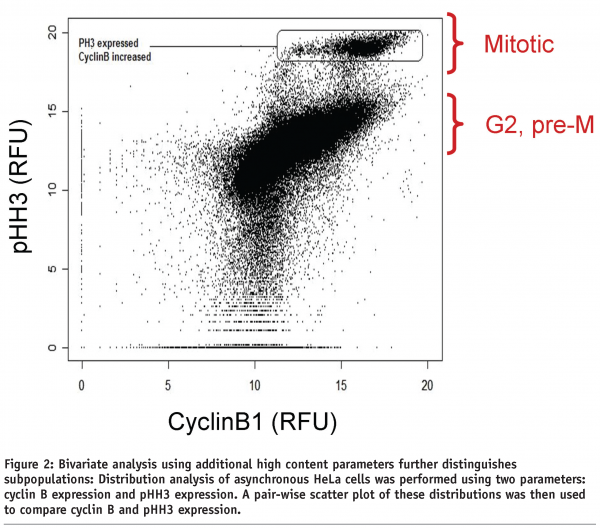
Although analysis of lone attributes may simplify HCI data analysis, subpopulations can be further examined across multiple parameters using a bivariate analysis. The addition of more than one parameter both strengthens the statistical confirmation and potentially describes additional subpopulations that may have been missed using a univariate analysis. For example, HeLa cells were stained for both cyclin B1 expression, expressed in both the G2 and M phases of the cell cycle, and pHH3 expression, to further define the cell cycle phase for each cell in the population (Figure 2). The addition of the second parameter in this case further confirms the data observed with one parameter but, more importantly, detects a subpopulation consisting of cells in the G2/M stage of the cell cycle. Bivariate analysis is a useful tool for picking out one specific phenotype and confirming it with multiple markers, but even in this example additional subpopulations which may significantly affect the biology of the disease remain undetected.
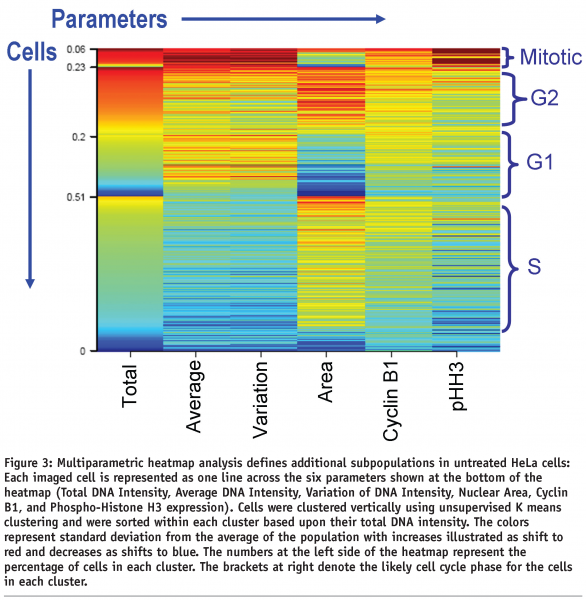
The relatively simple characterisations of populations and population shifts are useful in initial compound screening, primarily due to the simplicity of analysis, storage and cataloguing of large numbers of percentage population measurements rather than raw image data. However, the key to understanding the subtle changes in cellular populations comes from the inclusion of additional parameters that further define the phenotype. The subpopulations present in a heterogeneous population of cells, delineated through a simultaneous combination of multiple HCI parameters, are then differentiated using unsupervised K-means clustering. As in Figures 1 and 2, the nuclei of HeLa cells were stained (via the Hoescht dye binding to DNA) to determine their size, total, average, and variation of intensity. The cells were also immunostained for the presence of Cyclin B1 and pHH3 (Figure 3). These six parameters distinguish 4 distinct cell cycle subpopulations from the total imaged population (~1000 cells – it has previously been reported that a minimum of 600 cells provide a statistically significant HCI sampling)10. This relatively simple statistical technique detects multiple subpopulation phenotypes and shifts in those subpopulations under differential treatment conditions. These subpopulation characterisations are useful to a wide range of screening settings and have been used at Eli Lilly to characterise differential subpopulations in settings ranging from cell cycle, apoptosis, angiogenesis, and tumor progenitor cells. In several cases the insights developed using subpopulation analysis identified both potential novel targets for drug discovery and compounds that had been previously overlooked in traditional target-based assays.
The combination of target-based drug discovery with modern HCI and subpopulation informatics analyses represent powerful tools for the identification of lead compounds, and also create opportunities for collaboration between large pharmaceutical companies and entities unable to make the investments necessary to build a phenotypic screening capability. Rather than invest in the considerable resources necessary to build an effective HCI-based phenotypic lead generation engine, one can envisage a scenario whereby industry-academic partnerships emerge that allow for the testing of the novel chemical diversity available world-wide in well developed phenotypic disease models. Such collaborations will likely further increase the productivity of the pharmaceutical sector by advancing molecules through the development process, as well as offering technology and expertise to smaller laboratories to whom HCI would otherwise be unavailable.


References
- F. Kendall et al: Nuclear morphometry during the cell cycle. Science 196, pp.1106-1109, 1977.
- S.L. Schor et al: Changes in the organization of chromosomes during the cell cycle: response to ultraviolet light. J Cell Sci 17, pp.539-565, 1975.
- M. De Brabander et al: Ultrastructural immunocytochemical distribution of tubulin in cultured cells treated with microtubule inhibitors. Cell Biol Int Rep 1, pp.177-183, 1977.
- C. Nicolini et al: Objective identification of cell cycle phases and subphases by automated image analysis. Biophys J 19, pp.163-176, 1977.
- B. Booth & R. Zemmel: Prospects for productivity. Nat Rev Drug Discov 3, pp.451-456, 2004.
- D.C. Swinney: Biochemical mechanisms of New Molecular Entities (NMEs) approved by United States FDA during 2001-2004: mechanisms leading to optimal efficacy and safety. Curr Top Med Chem 6, pp.461-478, 2006.
- P. Lang et al: Cellular imaging in drug discovery. Nat Rev Drug Discov 5, pp.343-356, 2006.
- J. Low et al: Prioritizing hits from phenotypic high-content screens. Curr Opin Drug Discov Devel 11, pp.338-345, 2008.
- F. Li et al: Beyond tumorigenesis: cancer stem cells in metastasis. Cell Res 17, pp.3-14, 2007.
- J. Low et al: High-Content Imaging Analysis of the Knockdown Effects of Validated siRNAs and Antisense Oligonucleotides. J Biomol Screen, 2007.
Issue
Related topics
HCS (High Content Screening), Phenotypic drug discovery (PDD)


