

Isothermal calorimetry in the pharmaceutical sciences
Posted: 13 June 2013 | | No comments yet
Fifty years ago, isothermal microcalorimetry (IMC) was a means to determine thermodynamic data (principally values for enthalpies of formation or reaction to assist in the calculation of Gibb’s Free Energy functions and entropies). These data were used in the compilation of tables of thermodynamic values, for use in evaluating, inter alia, reaction feasibilities, reaction extents (effectively equilibrium constants) and, indeed, reaction enthalpies. For these measurements, an experimental timescale of 30 minutes was considered long. The applications of IMC have developed and expanded considerably over the years, to the point where it can be considered a real-time process monitor with application to virtually all areas of pharmaceutical development. Accompanying this evolution has been a significant growth in the availability of commercial instruments (in contrast to the previous practice of individual, laboratory designed and built instruments).

The pharmaceutical industry, while having some interest thermodynamic data, has much greater interest in the kinetics of processes (particularly to assigning shelf lives). The advent of commercial instruments and the availability of the accompanying better thermostats have allowed a rapid and hugely significant growth in the application of calorimetry to the rates / kinetics of processes. The practical outcome of kinetic studies is, additionally, an insight into mechanisms of reaction. Why should these be of particular interest to the pharmaceutical industry?
As has been stressed before1 calorimeters make no demands on a reacting system except that there be a reaction and since virtually all reacting systems are accompanied by a change in heat content or enthalpy, any process can, in principle, be followed in a calorimeter. Furthermore, measurement does not physically interfere with the sample (i.e. the technique is non-destructive and non-invasive and hence the sample studied changes during the course of the experiment only in the way it would were it maintained under the conditions prevailing in the instrument for the same investigation time). All physical forms can be investigated and any sample, provided that it can be fitted into one of the reaction chambers, can be studied (see1 for details of ampoule, perfusion, titration, flow designs etc). ‘Long’ reactions are now perceived as being on the order of days not minutes as earlier.
This review, therefore, concentrates on the development of IMC for the study of diverse systems of interest to the pharmaceutical industry through appropriate development of analysis of calorimetric data (power (W, or Js-1) versus time (s), see1 for further details). It will cover, in an introductory manner, the controlling equations and their application to issues such as long-term stability evaluation, photostability of NCEs and of medicines, compatibility, crystallinity / amorphicity evaluations, bioassay and biostability etc.
The simplest application of IMC is to place the sample of interest, typically a potential drug substance, into an ampoule and record the heat changes occurring – it is possible to control both the temperature and/or relative humidity and so to mimic likely long-term storage or short-term accelerated conditions. Qualitatively, the absence of a significant (say, greater than 1 μW) power suggests that the sample is stable with respect to its environment, while a larger power indicates that some process is occurring. The question then reduces to the nature of the process(es) involved. Often the power derives from something reasonably innocuous, such as establishment of equilibrium moisture contents, and so there may not be a stability issue. Otherwise, the power may arise from chemical reaction or some sort of physical change, such as recrystallisation of an amorphous matrix or change in polymorphic form. Identification of the actual process by inspection of the calorimetric data alone is usually difficult, unless the system is reasonably well understood in advance, and so some post-calorimetric analysis is often required, be that visual observation or some type of assay. For example, Figure 1 shows the power time data recorded for two pharmaceutical emulsions (the dotted lines represent the arbitrary ±1 μW limit mentioned above). The data on the top graph remain below 1 μW at all times, while the power data on the bottom graph start outside this limit. Qualitatively, this suggests that one formulation is stable and the other unstable. Visual inspection of the samples following removal from the calorimeter reveals that the unstable formulation phase separated while the stable formulation did not.
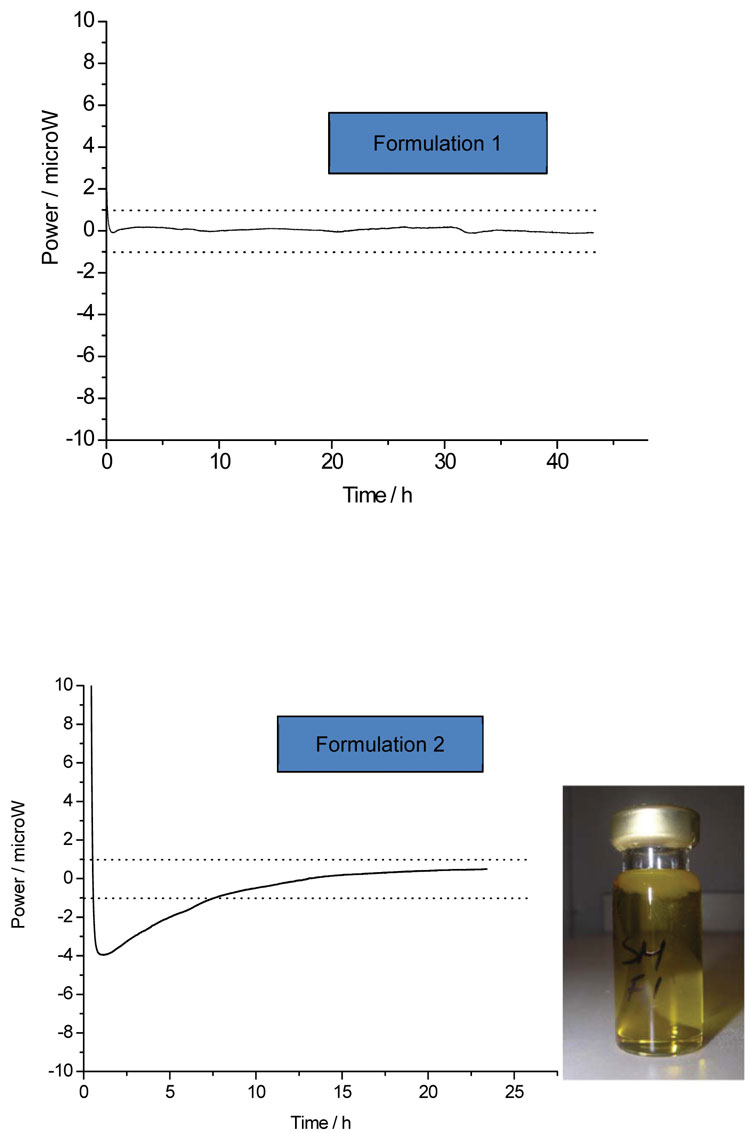
Figure 1: The calorimetric data for two emulsions. One sample (top) appears stable (no power) while the other shows a significant power (bottom) and so appears unstable – when removed from the instrument the unstable emulsion had phase-separated (inset photo)
Of course, sometimes quantitative assessment is the desired outcome. Again, calorimetric data are of use because measurements are made in real-time and so reflect reaction kinetics. Analysis is relatively straightforward if only one process is occurring, but becomes more challenging when reaction events occur simultaneously (in which case, the experiment or sample may need to be reconfigured so that one process predominates). Since most processes are either zero- or first-order, examples are given of the interpretation of each.
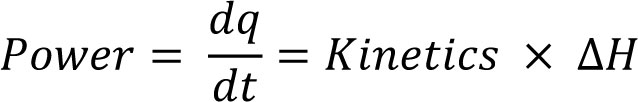
Interpretation commences by recognition of the fact that the power data recorded by the calorimeter are described by the (integrated) reaction kinetics multiplied by the reaction enthalpy (ΔH):
Eq.1
Hence, the reaction kinetics of the process or processes occurring must be known in order to affect quantitative analysis (an approach for dealing with analysis when the underlying kinetic scheme is not know is discussed below).
Starting with zero-order kinetics, the calorimetric power is described by:
Eq.2
![]()
where V is the volume (or mass) of the sample2. Data recorded for a zero-order process will appear as a horizontal power, displaced from zero, (an example for nifedipine is shown in Figure 2). Although they are conceptually the simplest reactions to describe in quantitative terms, the rate constant, k, and reaction enthalpy, ΔH, occur as a product so the value of either k or ΔH is required to evaluate the other, which complicates analysis. The rate constant is the easiest parameter to determine with analytical methods, so one method of analysis is to determine the rate constant separately and then determine the reaction enthalpy from Equation 2. We recently discussed a number of direct calculation methods2 although those are a little complex to include here.
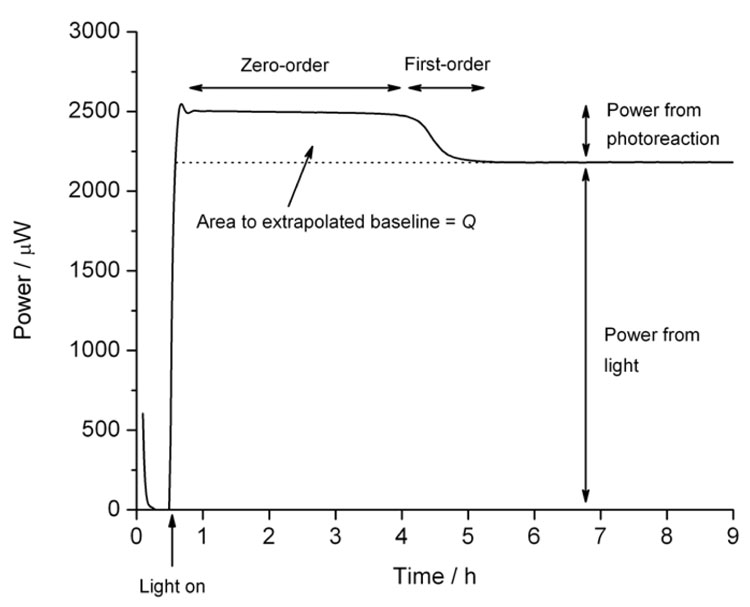
Figure 2: Calorimetric data for the photolysis of nifedipine showing a zero-order phase, a first-order decay as the substrate is exhausted, and the baseline caused by the light source
Although they are often structurally complex, biological reagents often react according to zero-order kinetics, which is why IMC has traditionally found application to biological samples. An example is the ureaurease reaction. The great majority of enzymes are associated with surfaces, cellular systems and, in general, complex biological subjects. In common with simple enzyme processes, microbes can be made subject to the behaviour described by the Michaelis-Menten kinetic form; i.e. they will perform a zero order reaction if supplied with an excess quantity of a single substrate. Thus if, for example, a microbe is inoculated into excess buffered glucose it will respire in a zero order manner. The power developed is proportional to the number of cells present, and importantly, that are capable of metabolising and hence this technique can form the basis of a counting method for cellular systems. This has been shown to be successful in the diagnosis of bacteriuria (urinary tract infection)3. The bacterial load in a single urine sample can be counted in around 20 minutes – indeed the evaluation of urine samples in a busy hospital pathology laboratory could be performed (in a multi-channel instrument) in the working day. This evaluation included antibiotic sensitivity testing of those samples that were assessed as positive (because addition of an antibiotic to which the organisms are susceptible will result in cell death and, as a consequence, zero power). Note here that antibiotic sensitivity testing can be performed on only the positive samples, eliminating the unnecessary work and expense involved in testing the 80 per cent or so of negative samples received.
The next most commonly encountered kinetics are first-order, for which calorimetric power is given by:
Eq.3

where all the terms are as defined above save for [A]0 which is the quantity of material available for reaction1. First-order processes will appear as an exponential decay to baseline and if only one process is occurring (say, the simple hydrolysis of a compound in water) then analysis is straightforward – plotting ln (power) versus time should result in a straight line of slope –k, Figure 3. The reaction enthalpy can then be determined directly from Equation 3.
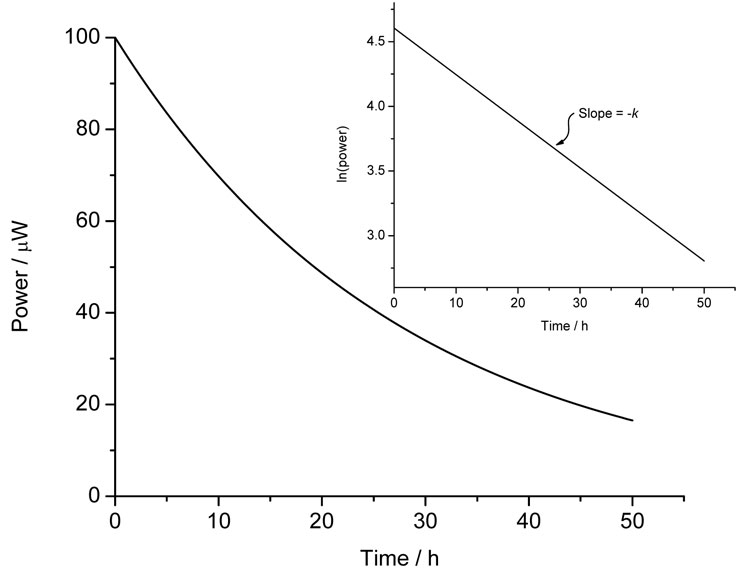
Figure 3: Calorimetric data for a first-order process and (inset) the ln(power) versus time plot
Of course, real drug products are often complex, heterogeneous mixtures in which many processes may be occurring simultaneously. Calorimetric investigation of such materials will typically result in complex power traces for which interpretation is more challenging. One option is to simplify the sample, say by removing one or more components, to try and isolate each process, which will then often proceed with first-order kinetics. Where this is not possible, quantitative analysis is still possible, if the underlying processes are known. In the case where there are several independent processes proceeding in parallel, then the data are simply described by the linear sum of the kinetics. For instance, two unrelated first-order processes would be described thus:
Eq.4
![]()
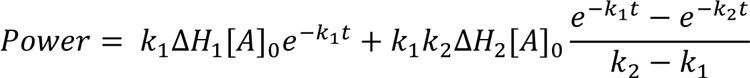
where A and B are the species reacting. Similar equations can be constructed for however many processes are occurring. Equation 4 has been used to quantify the stability of mixed parabens solutions in water4. The situation becomes slightly more complex if one compound can degrade via more than one pathway (common in photolysis for instance). Assuming two possible reaction routes, then the calorimetric power is described by:
Eq.5
![]()
The data in Figure 4 show the hydrolysis of ampicillin sodium in pH8 buffer and the fits to Equations 3 and 5. Although subtle, close inspection reveals that the simple, single step model does not describe the data as well as the two-path parallel model. This example gives a small insight into the power of calorimetric analysis – had the reaction pathway(s) been unknown, fitting the data to a number of models and looking for the simplest model that satisfactorily describes the data would indicate the underlying number and type of reaction steps.
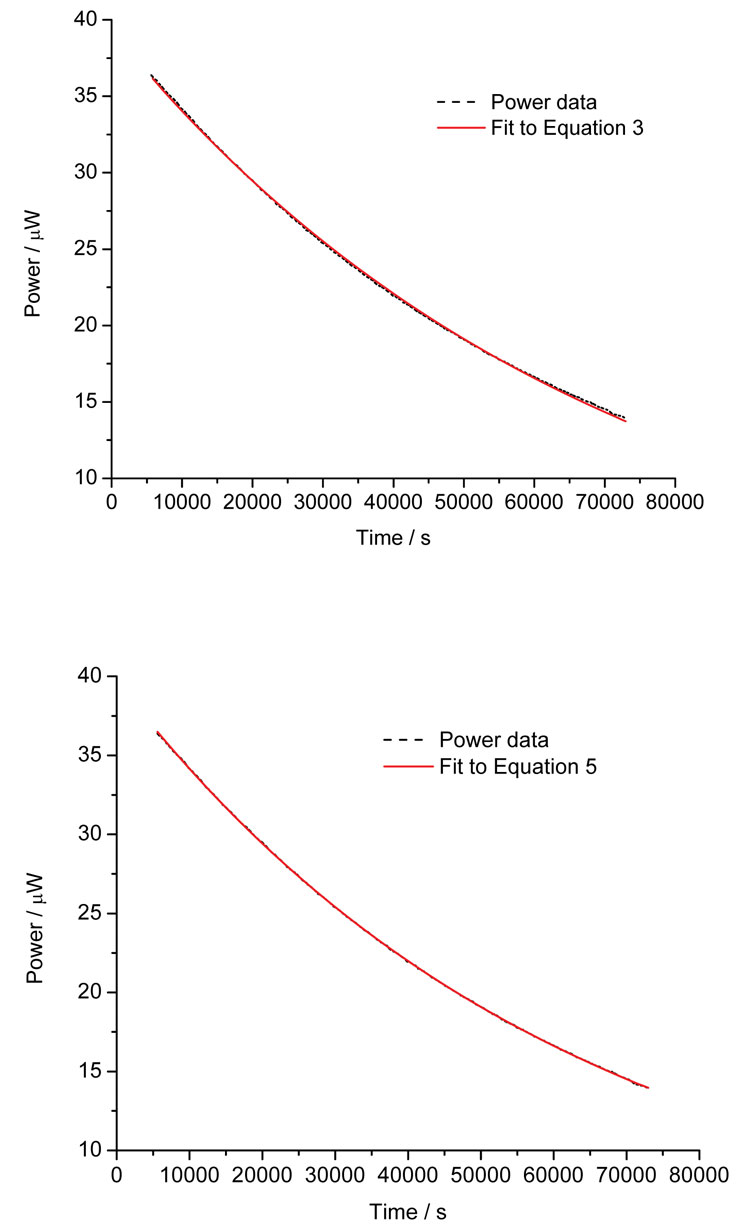
Figure 4: Calorimetric data for the hydrolysis of ampicillin sodium salt at pH8 and the fit to Equation 3 (top) and Equation 5 (bottom)
A related, and common, reaction pathway involves progression via a number of consecutive steps5. In this case, the product from one reaction step feeds into the next, leading to a kinetic expression of the form:
Eq.6
Again, this assumes only two first-order reaction steps. As the number of steps increases, so does the complexity of the model1,5. The use of this model has been applied to the acid catalysed hydrolysis of potassium hydroxylamine trisulphonate5.
The same principles can be applied to the analysis of solidstate reactions, such as crystallisation and conversion between polymorphic forms6. In this case, kinetic schemes based on molecularity (such as those introduced above for reactions in solution) are inappropriate, because of the vastly reduced mobility of the reacting species, and so expressions based on the fraction of reaction (α) are used instead. For instance, a general model that frequently describes solid-state reactions is:
Eq.7
![]()
where Q is the total heat released once reaction has been completed and the superscripts m and n are parameters related to reaction mechanism.
Sometimes, however, the data returned from calorimetric investigation can appear very complex in shape (for instance, Figure 5 shows the growth of S. aureus in simulated wound fluid). How best to analyse such data? One approach is to fit the models introduced above and see if a reasonable fit can be obtained. Another is to apply chemometric analysis (using principal component analysis, PCA)7. Where many processes occur, such as in the case of bacterial growth, it is possible to fit to multiple Gaussian peaks (because the growth pattern for organisms is based on the sequential utilisation of nutrients in the growth medium). Figure 5 shows the results of multiple peak analysis, the blue lines representing the individual peaks and the red line the sum of those peaks – the correlation to the raw data is remarkable.
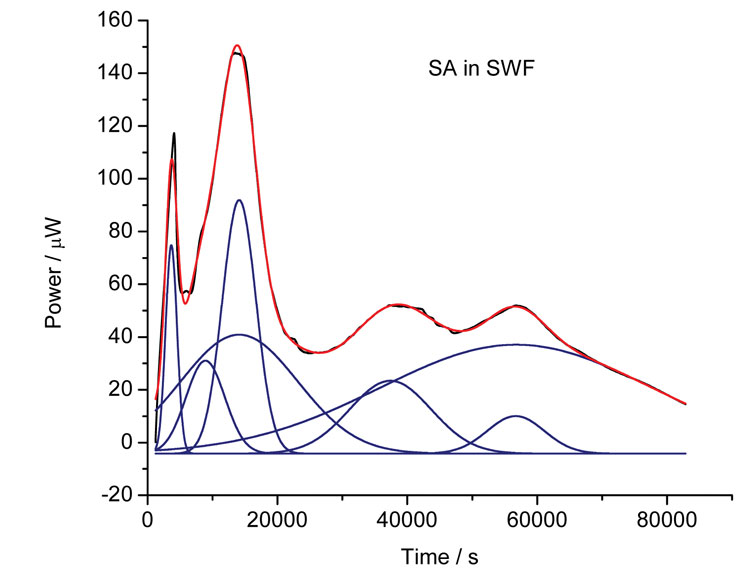
Figure 5: Calorimetric data for the growth of S. aureus in simulated wound fluid (black line) and the outcome from multiple Gaussian peak fitting (blue lines – individual peaks, red line – sum of individual peaks)
Calorimetric investigation of bacterial systems has been extended to include determination of bioactivity for raw drug material, formulated medicines and mixtures of drugs. The common finding is that such assays take only a few hours and the calorimetric record is of the real time interaction between organism and drug. Whilst this assay has been performed, it is only with the advent of the kinetic analysis described above that it will become possible to analyse these reactions – and this is the first, and necessary, step in describing the whole of the interaction mechanism. The potential to extend this technique to the identification and quantitative evaluation of synergic drug combinations has also been explored and the technique lends itself to routine assay work. For instance, addition of methicillin to a medium containing a sample of S. aureus would allow the distinction to be made between insensitive and sensitive bacteria, and as a consequence identification of MRSA strains. Considerable quantities of data on such growing cellular systems exist, although analyses overwhelmingly describe these systems through the organismal growth rate. It will be of considerable interest to apply the kinetic analysis outlined here to the study of these systems with respect to changes in the concentration and nature of the substrates upon which the organism grows (such studies are under way in our laboratory).
One limitation of current instruments is that they are not, in general, equipped to deal with high throughput demands. However, recent innovation has resulted in multi-channel instruments (typically up to 48 channels), which will vastly increase throughput and will hopefully expand the application of IMC to the pharmaceutical sciences.
References
- Gaisford, S., O’Neill, M.A.A. Pharmaceutical isothermal calorimetry. Informa Healthcare (New York) 2007, ISBN 0-8493-3155-2
- Sousa, L.A., Beezer, A.E., Hansen, L.D., Clapham, D., Connor, J.A., Gaisford, S. Calorimetric determination of rate constants and enthalpy changes for zero-order processes. J. Phys. Chem. B. (2012) 116:6356-6360
- Beezer, A.E., Miles, R.J., Shaw, E.J., Willis, P. Antibioticsensitivity testing by flow microcalorimetry. Experientia (1979) 35:795-796
- Skaria, C.V., Gaisford, S., O’Neill, M.A.A., Buckton, G., Beezer, A.E. Stability assessment of pharmaceuticals by isothermal calorimetry: Two component systems. Int. J. Pharm. (2005) 292:127-135
- Gaisford, S., Hills, A.K., Beezer, A.E., Mitchell, J.C. Thermodynamic and kinetic analysis of isothermal microcalorimetric data: Applications to consecutive reaction schemes. Thermochim. Acta. (1999) 328:39-45
- Sousa, L.A., Alem, N., Beezer, A.E., O’Neill, M.A.A., Gaisford, S. Quantitative analysis of solidstate processes studied with isothermal microcalorimetry. J. Phys. Chem. B. (2010) 114:13173- 13178
- O’Neill, M.A.A., Beezer, A.E., Tetteh, J., Gaisford, S., Dhuna, M. Application of chemometric analysis to complexity in isothermal calorimetric data. J. Phys. Chem. B. (2007) 111:8145-8149
Biographies
Anthony E. Beezer has over 50 years’ research experience in calorimetry at the Universities of London (Chelsea, Royal Holloway, UCL), Kent and Greenwich. He has written two books, and had over 300 refereed papers published. He has been awarded by the Swiss Thermal Analysis and Calorimetry Society, twice by the US Calorimetry Conference and received the International Society for Biological Calorimetry Lavoisier Medal. In 2012, he was awarded the ICTAC-Setaram award for lifetime achievement.
 Simon Gaisford is a Reader in Pharmaceutics. He joined the School in 2003, having previously been a Lecturer in Pharmaceutical Science at the University of Huddersfield. He undertook his PhD at the University of Kent at Canterbury, under Professor AE Beezer and then held Postdoctoral Research Assistant posts at the School with Profs DQM Craig and G Buckton. Dr Gaisford is a Founding Partner and Director of Kuecept Ltd, Honorary Teaching Fellow at the University of Manchester, Honorary Treasurer (and Past Chair) of the Thermal Methods Group and Committee Member of the ICSC (both Royal Society of Chemistry). He has published 56 papers, six book chapters and two authored books.
