Development of a NIRS method for quantification of a minor polymorphic form
Posted: 24 February 2017 | Stephanie Brookes (AstaZeneca) | No comments yet
Near-infrared spectroscopy (NIRS) is used by the pharmaceutical industry for a wide variety of applications, including the identification of drug substances, products and raw materials; tablet assays; uniformity of content; water content; solid state form; and process analytical technologies…

It benefits from being rapid, high throughput, non-destructive and suitable for use by non-specialist operators. It is ideal for good manufacturing practice analysis and has been accepted by regulatory authorities. However, the disadvantage of NIRS is that methods often require the use of complex multivariate models and large libraries of standard spectra, particularly for quantitative or product methods. In addition, it requires that periodic maintenance is carried out to ensure the continued suitability of the models1
Historically, it has not been possible to directly transfer quantitative models from one instrument to another without the use of correction standards or algorithms to account for instrument-to-instrument differences. Instead, quantitative models are traditionally transferred to after lengthy re-building of the calibration libraries on the new instrument, possibly requiring new standards to be prepared. However, advances in instrument technology now mean that direct transfers are feasible in certain cases.
This case study discusses how AstraZeneca has been able to perform a direct transfer of a quantitative model for a minor polymorphic form in a drug product between two Thermo Antaris MDS NIR analysers, without the need for a correction algorithm. The transfer was completed between two instruments of very different ages and with slightly different electronics – the donor instrument being an Antaris I system in excess of ten years of age and the receiving instrument being a new Antaris II system.
Method background
Quantification of a minor polymorphic form within a formulation is technically very challenging as analysis must be carried out in the solid state. In the example discussed here, it was necessary to develop and validate a method to rapidly and accurately detect and quantify a minor polymorphic form of the active pharmaceutical ingredient (API) within a capsule formulation. Despite a drug loading of only 10% w/w and a significant spectral contribution from the excipients, NIR was shown to be highly sensitive to the polymorphic form of the API within this formulation. This is illustrated in Figure 1 in which the area of spectral discrimination between the desired polymorph A and the unwanted polymorph B is highlighted.
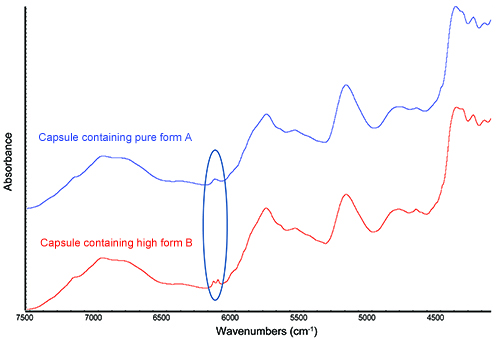
Figure 1: NIR spectra of capsules containing the desired polymorphic form A and the unwanted polymorph B.
Based on this strong spectral discrimination for the two forms the decision was made to develop a reflectance NIR method for quantification of form B. A Thermo Antaris I MDS NIR analyser, with integrating sphere sampling accessory, was employed for this purpose. Fifteen separate batches of capsules were manufactured, each spiked with a different level of polymorph B, for the development and validation of this model. These batches were divided into three sets: a calibration set, a model test set and a fully independent validation set. The validation set was prepared with different lots of API, excipients and capsule shells to the other two sample sets. The large size and non-circular shape of this capsule meant that it was not possible to sample an entire capsule in a single reflectance measurement. Each capsule was therefore sampled by acquiring three individual reflectance measurements, each in a different orientation. The individual measurements were then averaged to provide a single mean spectrum for each capsule, as illustrated in Figure 2 and Figure 3.
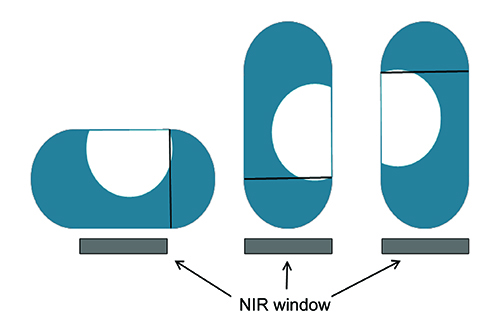
Figure 2: Schematic of NIR sampling regime.
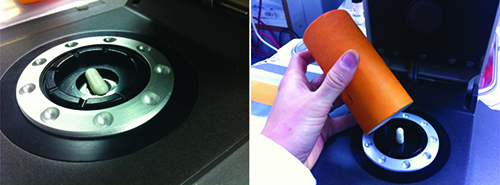
Figure 3: Capsule sampling using the integrating sphere accessory.
A partial least squares (PLS) calibration model was built using the TQ Analyst software package, to predict the form B content in new samples. Spectral pre-processing, including taking a second derivative, standard normal variate (SNV) and mean centering, was applied to remove background and physical effects and normalise the data. The model range was limited to the area showing the greatest differentiation between the two forms, 5,800cm-1 to 6,252cm-1. Overlaid processed spectra of the calibration standards clearly show the spectral dependence on form B concentration, as illustrated in Figure 4. The calibration data gave a standard error of calibration (SEC) of 1.11%. This model was validated using the independently prepared set of validation standards, also spiked with known concentrations of form B. These independent validation samples gave a standard error of prediction (SEP) of 1.47%.
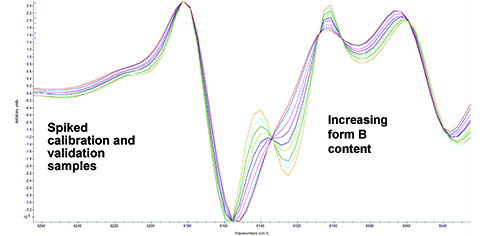
Figure 4: NIR spectra (second derivative) of spiked calibration and validation capsules demonstrating the dependence on polymorphic form.
Typically, NIR models for drug product would employ large spectral libraries designed to contain all expected product variability. As no primary reference method exists to accurately quantify the level of form B within a given capsule, this was not achievable and the method was therefore calibrated and validated using artificially prepared spiked capsules that cannot contain the desired natural product variation.
In order to ensure the validity and accuracy of this method for independent samples it was necessary to apply strict outlier limits. An outlier screening was developed utilising a classification model generated within the TQ Analyst software. The discriminant analysis classification technique was used to determine whether an unknown spectrum matched the defined calibration spectra by computing the unknown’s distance from the centre of each class of standards in Mahalanobis distance units. The limits for the Mahalanobis distance value check were defined based on the distance values obtained for the calibration and validation samples and set to ensure that only samples that gave similar spectra to the calibration standards were quantified by the model. Using this criterion a Mahalanobis distance value of <1.8 was required to give a pass result.
Transfer of the method between instruments
The original method for detection and quantification of form B in capsules was built and validated on a single development instrument, an Antaris I MDS NIR analyser. As the project progressed through development it became necessary to transfer this method to a new Antaris II MDS NIR analyser in operations. The decision was made to investigate whether this could be achieved by direct model transfer. Spectra of calibration standards were transferred to the new instrument together with the TQ analyst methods for both outlier detection and quantification.
Validation of the transferred model was performed using the independently prepared validation standards, spiked with known levels of form B, which were used to validate the original model. Six capsules from each validation batch were analysed on both the donor and the receiving instrument. The capsules were numbered and separated such that each capsule could be directly compared; for example, the result labelled 12% form B replicate 1 applied to the same capsule on both donor and receiving instrument.
The RMSEP between the two data sets was 0.92%. This was significantly less than the standard error of prediction (SEP) of the method at 1.47%. The difference between the two values obtained for each capsule fell within expected prediction errors and there was no trend between the two data sets. These data demonstrated that there was no significant difference between the results obtained using the donor instrument and those produced by the receiving instrument.
A statistical evaluation of instrument bias was carried out using a paired t test for the mean of the donor and receiving instruments. A summary of the t test results is presented in Figure 5 and Figure 6. The results demonstrate that the mean of the donor instrument is not significantly different to the mean of the receiving instrument at the 95% confidence level.
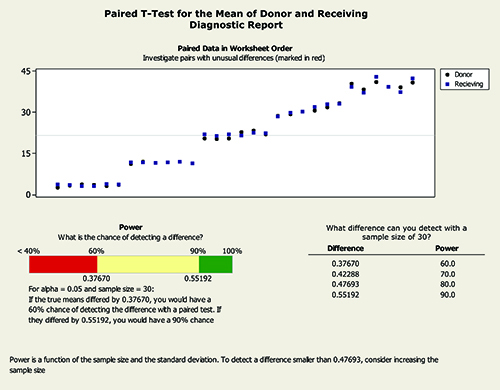
Figure 5: Paired t test for mean of donor and receiving instruments.
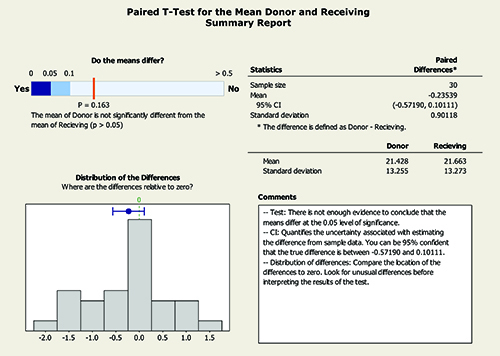
Figure 6: Summary of paired t test for mean of donor and receiving instruments.
Including the level of form B as a factor in the model accounted for both the differences between instruments and the levels in the standards. A summary of this statistical evaluation is presented in Figure 7. Using this approach, the confidence interval for the difference in instrument means was (-0.29 to +0.76) % form B. This met the internal AstraZeneca acceptance criteria that the difference in instrument means was not more than 1% and that the confidence interval for the difference in instrument means included the ideal value of zero.
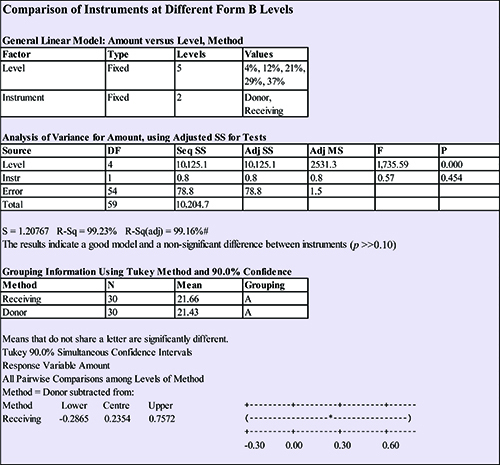
Figure 7: Comparison of instruments at different form B levels.
The classification model for outlier detection was used to demonstrate that the spectra of all validation samples, acquired using the receiving instrument, were a good fit for the calibration model. All samples generated a Mahalanobis distance value of <1.8 and were, therefore, shown to fall within the model space. In order to provide a visual assessment of instrument bias, a principle component analysis model was generated for the calibration samples using the standard model pre-processing and spectral range.
The spectra from both the donor and receiving instruments were projected onto the Hotellings T2 95% confidence limits for principal components 1 and 2. In this model, principal component 1 was dominated by the level of form B and principal component 2 was dominated by sampling variability. The scores plot is presented in Figure 8. The plot demonstrated that within each form B level there was a spread of physical or sampling variation in PC2, however the data points for the two instruments completely overlapped and there was no bias or offset between the two data sets.
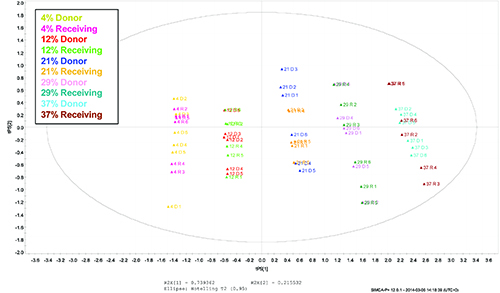
Figure 8: Scores plot showing the relative positions of data acquired using the donor and receiving instruments within the model space.
Conclusion
Advances in instrument technology now mean that in certain circumstances direct transfer of complex, multivariate, quantitative NIR models between instruments is achievable.
In the case study discussed in this article, a method to quantify a minor polymorphic form of an API, within a complex capsule formulation, has been successfully transferred between a Thermo Antaris I MDS NIR analyser and a Thermo Antaris II MDS NIR analyser. Statistical tests have been used to show that the same models on both the donor and receiving instruments gave equivalent results without the need for corrective algorithms or correction standards. The ability to perform a direct transfer has greatly simplified the transfer process for this GMP method and also saved considerable time and expense in the preparation of new calibration and validation standards.
Biography
 STEPHANIE BROOKES obtained a Masters degree in chemistry from Oxford University in 2000 and joined AstraZeneca Pharmaceuticals in the same year where she specialised in vibrational spectroscopy. Stephanie uses Raman, FTIR, NIR and imaging, together with multivariate analysis, to probe a variety of characteristics of both drugs and formulated products. Her work includes developing quantitative methods for polymorphic form, imaging to assess formulation homogeneity, structural assessment of solid state changes, developing methods for counterfeit detection and investigating production problems. She also has considerable experience in the area of particle sizing and the application of materials science to formulation development.
Reference
- European Medicines Agency Guideline on the use of Near Infrared Spectroscopy (NIRS) by the pharmaceutical industry and the data requirements for new submissions and variations. Ph Eur monograph 2.2.40 USP <1119> Near-Infrared Spectroscopy
Issue
Related topics
Analytical techniques, Near Infrared Spectroscopy (NIR), Technology