Applications of Raman, CARS and SRS imaging in dosage form development
Posted: 26 April 2012 |
The use of Raman spectroscopy in pharmaceuticals has grown enormously since its appearance on the scene in the 1980s1-4. While typical Raman spectroscopy setups are able to provide chemical and physicochemical information about the sample on the bulk level, most solid samples in the pharmaceutical setting may not be assumed to be homogenous, and many critical quality attributes, such as drug release for example, depend on component distribution. Thus, obtaining chemically and spatially resolved information about pharmaceutical samples is pertinent. Since Raman microscopy imaging made its debut in the pharmaceutical setting, the range of pharmaceutical applications for which the technique has been used has continued to grow5-7.
Briefly, Raman spectroscopy involves the detection of inelastic scattering of light associated with molecular vibrations. The resulting photons have a longer (Stokes scattering) or shorter wavelength (anti-Stokes scattering) than the incident photons. In the most common setup (with spontaneous Raman scattering), the Stokes effect is detected since it is stronger. Raman spectroscopy is related to (near- and mid-) infrared spectroscopy since both techniques probe molecular vibrations, but there are several practical differences, which are due to the different molecular phenomena behind Raman scattering (polarisability change during vibration) and infrared absorption (dipole moment change, for more detail see e.g.8,9,5 for a brief explanation). While near-infrared and mid-infrared micro – scopy may also be used to gain chemically and spatially resolved information about samples, Raman microscopy has some advantages which include:
- A slightly higher lateral resolution (approximately 1 μm)
- A higher axial resolution and the possibility to analyse at specific depths within samples
- A frequently higher relative sensitivity to active ingredients than excipients (since many active ingredients are aromatic and excipients typically are not)
- The lack of interference of water in Raman spectra
These advantages make Raman microscopy the vibrational spectroscopy imaging technique of choice in many situations. Disadvantages include possible sample heating, fluorescence interference with the Raman signal, and a slow spectral acquisition time due to the intrinsically weak spontaneous Raman scattering effect.
Different sampling setups are available to generate images9. The most common is based on point mapping and is often referred to as Raman mapping. In this setup, a point source is used to irradiate an area of sample and a Raman spectrum is recorded. Spectra are sequentially recorded at each pixel by changing the point of irradiation on the sample. To image an acceptably large area at a sufficient resolution may take hours or potentially days depending on the time required to acquire each spectrum with an acceptable signal-to-noise ratio. If a confocal Raman microscope is used, the sampling depth can be controlled, and spectra may also be recorded from within samples.
Two methods have been developed to increase imaging speed: global (wide-field) and line imaging. In global imaging, Raman scattering is detected simultaneously from many pixels in an area. The data at each pixel is univariate (total scattering is measured within a wavenumber window). This means an entire image can be obtained in minutes or possibly seconds. To probe different spectral regions, the wavenumber window is changed. While this method has the advantage of speed, it is less data rich (unless all spectral regions are probed and then the speed advantage is lost), spatial resolution is not quite as good, and since the setup precludes the incorporation of a pinhole, confocal imaging (and imaging at depth) is not possible. A hybrid of these two approaches is line imaging, in which multiple spectra are simultaneously recorded across a line on the sample. Spectra from sequential lines across the sample are recorded and combined to form an area. This approach is slower than global imaging (for a single spectral window in global imaging) but faster than point mapping5.
The frequently complex data set that is generated during Raman microscopy imaging necessitates careful selection of a suitable data analysis approach so that meaningful infor – mation is extracted. Univariate analysis (e.g. peak height, peak area, total Raman scattering in a spectral region, full width half maximum) is the most straightforward and is therefore used whenever possible. However, if spectral features unique to each component of interest are not sufficiently resolved due to highly overlapping spectral features, multivariate analysis (e.g. principal components analysis, partial lest squares analysis, multivariate curve analysis) is more feasible1,5,10,11. The most appropriate data analysis method depends on both the sample and research question. A useful tutorial review of multivariate data analysis approaches in pharmaceutics has recently been published12, in which the theory of the most commonly used methods for extracting information from Raman spectra are introduced and common applications outlined. Several publications are devoted to finding the best methods for analysing Raman microscopic imaging data from pharmaceutical systems13,14.
The following section highlights some of the applications of Raman microscopic imaging in dosage form development. In the final section, two derivatives of Raman microscopic imaging which recently entered the pharma ceutical setting are introduced: coherent anti-Stokes Raman scattering (CARS) microscopy and stimulated Raman scattering (SRS) microscopy. Their primary (but not only) advantage is their speed, increasing not only convenience, but also the possibility of monitoring dynamic systems.
Raman microscopy imaging applications in dosage form development
Raman microscopy imaging is well suited to high spatial resolution imaging of different constituents at the surface of solid dosage forms, and it has been used to image both active ingredient and excipient distribution in tablets10,13,15-19, as well as other dosage forms containing solids such as transdermal patches20,21, freeze dried powders22-24, inhalation powders25-27, stents28, vaginal rings29, and nasal spray suspensions30 (Table 1). Despite the potential speed advantage with global illumination imaging, the majority of studies have been conducted using point mapping, which tends to offer a better spatial resolution and the ability to resolve different components with entire spectra recorded at each point.

The effect of manufacturing method (e.g. extrusion, direct compression, fluid bed and high shear granulation), and processing conditions on component distributions and dosage form structure more generally has also been investigated with Raman microscopic imaging31-35. In a wide ranging study, Vajna et al prepared imipramine hydrochloride tablets using direct compression, fluid bed and high shear granulation and different granulation solutions, such that seven different manu – facturing conditions were employed32. Direct classical least squares analysis of the spectra resulted in constituent distributions in images that were consistently different between the different manufacturing methods. The structural differences observed in Raman microscopy images may be linked to critical quality attributes, for example dissolution behaviour31.
The sensitivity of Raman spectra to different solid state forms makes Raman microscopy imaging an excellent method to image not only different chemical components, but also solid state forms24,32,33. Confocal Raman microscopy has been used to investigate the phase separation and solid state form distribution of a lipophilic drug in lipid-based spray-dried inhalation powders25. By applying a classical least squares algorithm, the authors determined that the lipophilic drug loading affected both its solid state form and distribution in the powder. At a loading of 1.55 per cent w/w, the drug appeared homogenously distributed within the lipid particles, while at a loading of 7.3 per cent w/w, the drug partially separated from the lipid phase as crystals. Until recently, the investigation of the solid state forms with Raman spectroscopy has typically focused on qualitative and quantitative analysis on the bulk level1, however the distribution may be more important than overall content with respect to critical quality attributes such as adhesion of particles for inhalation36 or dissolution behaviour37.
Raman microscopy imaging is well suited to investigate these relationships. Raman microscopy is well suited for detecting low levels of active ingredient, since the Raman scattering of the drug is usually stronger than that of excipients. With this in mind, Šašić used point mapping combined with multivariate analysis (principal component analysis) and binarisation to identify the presence of and quantitatively determine the spatial distribution of alprazolam in tablets (0.4 and 0.8 per cent w/w content) in two batches of tablets10. The drug was not detectable using bulk Raman spectroscopic analysis. Statistical approaches to identify the minimum number of sampling points to reliably detect the active ingredient were investigated in a subsequent study38. The same principle may also be applied when detecting trace crystallinity. Widjaja et al employed Raman microscopy to detect low levels of crystallinity in pure drugs prepared by melting and quenching and amorphous drug / polymer mixtures prepared by hot melt extrusion. The authors used multivariate curve resolution approaches and were able to locate trace crystallinity in samples, even though they were x-ray amorphous39.
With a confocal microscope, the depth of different components and solid state forms may also be probed. Providing the temporal resolution is acceptable, 3D Raman microscopic imaging may also be used to probe dynamic systems, such as drug diffusion through stents28 or other membranes. Gotter et al used confocal Raman microscopy to image the diffusion of dithranol from white soft paraffin into an artificial acceptor membrane, intended to mimic skin40. The area of a Raman peak due to the drug was used to determine concentration at different depths (apparent depths 1.5 to 49 μm) within the membrane over time. The authors used the analysis to determine when a new application of the formulation would be appropriate. They also included a discussion on determining the actual sampling depth and depth resolution, which is a complex function involving the refractive index of the sample materials and the optical setup41-43. Not all manuscripts show evidence of considering this issue. Recording spectra from within the sample is typically restricted to a few tens of micrometres at most.
In some situations, larger depths may be investigated by cutting cross-sections. This approach was used to image the changing component distribution in a sustained release dosage form during dissolution testing44. Solid lipid extrudates composed of theophylline anhydrate, tripalmitin as a matrix former, and polyethylene glycol 10000 as a pore former were analysed using Raman point mapping to determine the component distributions in cross-sections before and during dissolution testing (Figure 1).

Peak area analysis revealed that all three components were present as crystalline particles within the extrudate (Figure 1b, above). During dissolution testing, a receding drug boundary was observed, though it was not uniformly receding (Figure 1c, above). The water soluble polymer rapidly dissolved and diffused from the matrix and was not observed in any of the Raman spectra after 30 minutes, leaving pores in which the drug could dissolve and diffuse from.
Imaging with CARS microscopy and SRS microscopy
As mentioned earlier, one of the drawbacks of conventional Raman microscopy, particularly in the point mapping arrangement, is the sometimes painfully slow data acquisition, which may run into hours or even days for a single image. Recently, two coherent Raman imaging techniques, namely coherent anti- Stokes Raman scattering (CARS) microscopy and stimulated Raman scattering (SRS) micro – scopy, have made their pharmaceutical debut (Table 2), following on the heels of their entry into the biomedical setting as a means for label-free imaging45-47.

These techniques allow an imaging speed many orders of magnitude faster than Raman point mapping and even global imaging based on spontaneous Raman scattering, because the Raman scattering is stimulated through the use of two laser beams (often referred to as pump and Stokes) collinearly overlapped and focused on the sample. One of the two laser beams (usually the higher energy pump) is tuned such that the difference in their wavelengths matches a vibrational resonance in the molecule of interest, which leads to an enhanced polarisa – tion in the molecule. An anti-Stokes signal (at a shorter wavelength than the pump laser beam) is generated which is detected in CARS microscopy. In SRS microscopy, the intensity of one of the beams is modulated and the resulting intensity modulation of the other beam signal is detected. In the most common setup, molecules may be detected by tuning one of the laser beams (in this respect the techniques are most similar to global imaging in which a single wavenumber region is detected at once). The theory behind these techniques is explained in detail elsewhere46,48,49, with a description for pharmaceutical scientists and an overview of pharmaceutical applications of these and other non-linear imaging approaches in a recently published review50.
A superior lateral and axial resolution may also be obtained with coherent Raman imaging, and interference from (one-photon) fluor – escence may be avoided. SRS has been used to image multiple excipient distributions in tablets produced by different manufacturers containing amlodipine besylate and different excipients. All the excipients could be chemically resolved, except corn starch and lactose monohydrate due to similar Raman signals in the spectral region probed51. Recently, hyperspectral CARS microscopy has been used to improve chemical and solid state form selectivity52.
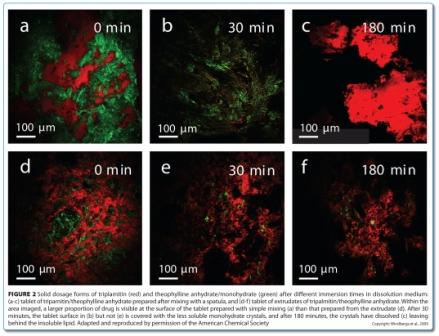
CARS microscopy and SRS imaging are ideally suited to imaging dynamic systems, including samples in aqueous media, which opens up the possibility of chemically selective real time imaging during dissolution testing, and even manufacturing. CARS microscopy has been used for in situ imaging of drug release and solid state changes in oral dosage forms during dissolution testing53,54. Binary matrices containing theophylline anhydrate and tripalmitin were imaged in real time in a flow through cell. The matrices were prepared using two different mixing methods: solid lipid extrusion and mixing with a spatula. The loss of drug due to dissolution was observed in both matrices (Figure 2). However, the surfaces of the matrices were quite different during the dissolution process. For the extrudates, only drug dissolution was observed (Figure 2e). For the physically mixed tablets, the surface became covered in the less water soluble theophylline monohydrate crystals through a solvent-mediated transformation (Figure 2b and Figure 3), with these crystals subsequently dissolving (Figure 2c).

The simultaneous analysis of the dosage form in a flow through cell with CARS microscopy and drug concentration in solution with UV absorption may be performed to gain new insights into (changing) dosage form factors that affect drug dissolution and release. CARS microscopy has also been used to image paclitaxel release and phase separation in polymer films of different compositions, intended as films for drug eluting stents55,56.
With a view to better understanding the fate of lipid based dosage forms after administration, multiplex (broadband) CARS imaging has been used to monitor the fate of lipid-based drug delivery systems during digestion57. The authors were able to image in situ the lypolysis of glyceryl trioleate and crystallisation of the product in a lipase containing emulsion. They also imaged the dissolution of ergosterol in mixed micelles forming during lipid digestion, and the concentration of vitamin D and progesterone in emulsion droplets during digestion.
The laser intensities used in coherent Raman imaging may also generate other nonlinear phenomena which can be detected, such as second harmonic generation (useful for resolving crystalline and amorphous materials), and if any of the compounds exhibit two photon fluorescence this may also be detected. When multiple phenomena are monitored simultaneously, this is commonly referred to as multi-modal imaging.
Conclusion
These studies demonstrate that Raman microscopic imaging is being widely adopted for optimised dosage form development. The chemically, physicochemically, spatially and even temporally resolved data provides a level of understanding that is often not achievable using uncoupled microscopy and spectroscopy. Very often, the information can be directly linked to critical quality attributes, such as drug release, content uniformity or particle adhesion. CARS and SRS microscopies provide exciting possibilities for imaging at speed. It is expected that the use of all forms of Raman imaging in the pharmaceutical setting will continue to accelerate, especially CARS and SRS microscopy, which are still in their infancies in the pharmaceutical setting and are continuing to undergo technological developments (e.g. hyperspectral CARS and SRS imaging for increased spectral sensitivity to different components) which will further increase their value in the pharmaceutical setting.
References
1. Strachan CJ, Rades T, Gordon KC, Rantanen J. Raman spectroscopy for quantitative analysis of pharmaceutical solids. Journal of Pharmacy and Pharmacology. 2007; 59(2): 179-92
2. McGoverin CM, Rades T, Gordon KC. Recent pharmaceutical applications of Raman and terahertz spectroscopies. Journal of Pharmaceutical Sciences. 2008; 97(11): 4598-621
3. Rantanen J. Process analytical technology applications of Raman spectroscopy. Journal of Pharmacy and Pharmacology. 2007; 59: 171-7
4. Wartewig S, Neubert RHH. Pharmaceutical applications of Mid-IR and Raman spectroscopy. Advanced Drug Delivery Reviews. 2005; 57(8): 1144-70
5. Gordon KC, McGoverin CM. Raman mapping of pharmaceuticals. International Journal of Pharmaceutics. 2011; 417(1-2): 151-62
6. Gowen AA, O’Donnell CP, Cullen PJ, Bell SEJ. Recent applications of chemical imaging to pharmaceutical process monitoring and quality control. European Journal of Pharmaceutics and Biopharmaceutics. 2008; 69: 10-22
7. Gendrin C, Roggo Y, Collet C. Pharmaceutical applications of vibrational chemical imaging and chemometrics: a review. Journal of Pharmaceutical and Biomedical Analysis. 2008; 48: 533-53
8. McCreery RL. Raman spectroscopy for chemical analysis. New York: John Wiley & Sons, Inc.; 2000
9. Salzer R, Siesler HW, editors. Infrared and Raman Spectroscopic Imaging: John Wiley & Sons, Inc.; 2009
10. Šašić S. Raman mapping of low-content API pharmaceutical formulations. I. Mapping of alprazolam in Alprazolam/Xanax tablets. Pharm Res. 2007; 24(1): 58-65
11. Gendrin C. Pharmaceutical applications of vibrational chemical imaging and chemometrics: A review. Journal of Pharmaceutical and Biomedical Analysis. 2008; 48(3): 533-53
12. Rajalahti T, Kvalheim OM. Multivariate data analysis in pharmaceutics: A tutorial review. International Journal of Pharmaceutics. 2011; 417(1-2): 280-90
13. Zhang L, Henson MJ, Sekulic SS. Multivariate data analysis for Raman imaging of a model pharmaceutical tablet. Analytica Chimica Acta. 2005; 545(2): 262-78
14. Vajna B, Farkas A, Pataki H, Zsigmond Z, Igricz T, Marosi G. Testing the performance of pure spectrum resolution from Raman hyperspectral images of differently manufactured pharmaceutical tablets. Analytica Chimica Acta. 2012; 712(0): 45-55
15. Šašić S. An in-depth analysis of Raman and nearinfrared chemical images of common pharmaceutical tablets. Applied Spectroscopy. 2007; 61(3): 239-50
16. Šašić S, Clark DA. Defining a strategy for chemical imaging of industrial pharmaceutical samples on Raman line-mapping and global illumination instruments. Applied Spectroscopy. 2006; 60(5): 494-502
17. Clarke FC, Jamieson MJ, Clark DA, Hammond SV, Jee RD, Moffatt AC. Chemical image fusion. The synergy of FTNIR and raman mapping microscopy to enable a more complete visualization of pharmaceutical formulations. Analytical Chemistry. 2001; 73(10): 2213-20
18. Šašić S. Parallel imaging of active pharmaceutical ingredients in some tablets and blends on Raman and near-infrared mapping and imaging platforms. Anal Methods. 2011; 3(4): 806-13
19. Widjaja E, Seah RKH. Application of Raman microscopy and band-target entropy minimization to identify minor components in model pharmaceutical tablets. Journal of Pharmaceutical and Biomedical Analysis. 2008; 46(2): 274-81
20. Sakamoto T, Matsubara T, Sasakura D, Takada Y, Fujimaki Y, Aida K, et al. Chemical mapping of tulobuterol in transdermal tapes using Microscopic Laser Raman Spectroscopy. Pharmazie. 2009; 64(3): 166-71
21. Armstrong CL, Edwards HGM, Farwell DW, Williams AC. Fourier transform Raman microscopic study of drug distribution in a transdermal drug delivery device. Vibrational spectroscopy. 1996; 11(2): 105-13
22. Padilla AM, Chou SG, Luthra S, Pikal MJ. The study of amorphous phase separation in a model polymer phase-separating system using raman microscopy and a low-temperature stage: Effect of cooling rate and nucleation temperature. Journal of Pharmaceutical Sciences. 2011; 100(4): 1362-76
23. Padilla AM, Ivanisevic I, Yang Y, Engers D, Bogner RH, Pikal MJ. The study of phase separation in amorphous freeze-dried systems. part I: Raman mapping and computational analysis of XRPD data in model polymer systems. Journal of Pharmaceutical Sciences. 2011; 100(1): 206-22
24. Vajna B, Farkas I, Farkas A, Pataki H, Nagy Z, Madarász J, et al. Characterization of drug–cyclodextrin formulations using Raman mapping and multivariate curve resolution. Journal of Pharmaceutical and Biomedical Analysis. 2011; 56(1): 38-44
25. Schoenherr C, Haefele T, Paulus K, Francese G. Confocal Raman microscopy to probe content uniformity of a lipid based powder for inhalation: A quality by design approach. European Journal of Pharmaceutical Sciences. 2009; 38(1): 47-54
26. Steele DF, Young PM, Price R, Smith T, Edge S, Lewis D. The potential use of Raman mapping to investigate in vitro deposition of combination pressurized metereddose inhalers. The AAPS journal [electronic resource]. 2004; 6(4)
27. Šašić S, Harding L. Global illumination Raman chemical imaging of a combination of two drug molecules in a dry powder inhaler formulation. Anal Methods. 2010; 2(10): 1528-35
28. Belu A, Mahoney C, Wormuth K. Chemical imaging of drug eluting coatings: Combining surface analysis and confocal Raman microscopy. Journal of Controlled Release. 2008; 126(2): 111-21
29. Bell SEJ, Dennis AC, Fido LA, Malcolm RK, Sirimuthu NMS, Toner CF, et al. Characterization of silicone elastomer vaginal rings containing HIV microbicide TMC120 by Raman spectroscopy. Journal of Pharmacy and Pharmacology. 2007; 59(2): 203-7
30. Doub WH, Adams WP, Spencer JA, Buhse LF, Nelson MP, Treado PJ. Raman chemical imaging for ingredientspecific particle size characterization of aqueous suspension nasal spray formulations: A progress report. Pharm Res. 2007; 24(5): 934-45
31. Windbergs M, Haaser M, McGoverin CM, Gordon KC, Kleinebudde P, Strachan CJ. Investigating the relationship between drug distribution in solid lipid matrices and dissolution behaviour using raman spectroscopy and mapping. Journal of Pharmaceutical Sciences. 2010; 99(3): 1464-75
32. Vajna B, Farkas I, Szabó A, Zsigmond Z, Marosi G. Raman microscopic evaluation of technology dependent structural differences in tablets containing imipramine model drug. Journal of Pharmaceutical and Biomedical Analysis. 2010; 51(1): 30-8
33. Nagy ZK, Balogh A, Vajna B, Farkas A, Patyi G, Kramarics A, et al. Comparison of electrospun and extruded soluplus®-based solid dosage forms of improved dissolution. Journal of Pharmaceutical Sciences. 2012; 101(1): 322-32
34. Vajna B, Pataki H, Nagy Z, Farkas I, Marosi G. Characterization of melt extruded and conventional Isoptin formulations using Raman chemical imaging and chemometrics. International Journal of Pharmaceutics. 2011; 419(1–2): 107-13
35. Šašić S, Loranger SI, Johnson BA. Characterizing the structure of pharmaceutical granules obtained by wet granulation with varying amounts of water via Raman chemical imaging. Applied Spectroscopy. 2011; 65(11): 1291-9
36. Bérard V, Lesniewska E, Andrès C, Pertuy D, Laroche C, Pourcelot Y. Affinity scale between a carrier and a drug in DPI studied by atomic force microscopy. International Journal of Pharmaceutics. 2002; 247(1-2): 127-37
37. Priemel P, Grohganz H, Gordon K, Rades T, Strachan C. Correlating recrystallisation with dissolution behaviour. European Journal of Pharmaceutics and Biopharmaceutics. Submitted
38. Šašić S, Whitlock M. Raman mapping of low-content active-ingredient pharmaceutical formulations. Part II: Statistically optimized sampling for detection of less than 1% of an active pharmaceutical ingredient. Applied Spectroscopy. 2008; 62(8): 916-21
39. Widjaja E, Kanaujia P, Lau G, Ng WK, Garland M, Saal C, et al. Detection of trace crystallinity in an amorphous system using Raman microscopy and chemometric analysis. European Journal of Pharmaceutical Sciences. 2011; 42(1–2): 45-54
40. Gotter B, Faubel W, Neubert RHH. FTIR microscopy and confocal Raman microscopy for studying lateral drug diffusion from a semisolid formulation. European Journal of Pharmaceutics and Biopharmaceutics. 2010; 74(1): 14-20
41. Everall N, Lapham J, Adar F, Whitley A, Lee E, Mamedov S. Optimizing depth resolution in confocal Raman microscopy: A comparison of metallurgical, dry corrected, and oil immersion objectives. Applied Spectroscopy. 2007; 61(3): 251-9
42. Everall NJ. Modeling and measuring the effect of refraction on the depth resolution of confocal Raman microscopy. Applied Spectroscopy. 2000; 54(6): 773-82
43. Everall NJ. Confocal Raman microscopy: Why the depth resolution and spatial accuracy can be much worse than you think. Applied Spectroscopy. 2000; 54(10): 1515-20
44. Haaser M, Windbergs M, McGoverin CM, Kleinebudde P, Rades T, Gordon KC, et al. Analysis of matrix dosage forms during dissolution testing using raman microscopy. Journal of Pharmaceutical Sciences. 2011; 100(10): 4452-9
45. Evans CL, Xie XS. Coherent anti-Stokes Raman scattering microscopy: chemical imaging for biology and medicine. Annu Rev Anal Chem. 2008; 1: 883-909
46. Freudiger CW, Min W, Saar BG, Lu S, Holtom GR, He C, et al. Label-free biomedical imaging with high sensitivity by stimulated Raman scattering microscopy. Science. 2008; 322(5909): 1857-61
47. Oheim M, Michael DJ, Geisbauer M, Madsen D, Chow RH. Principles of two-photon excitation fluorescence microscopy and other nonlinear imaging approaches. Advanced Drug Delivery Reviews. 2006; 58(7): 788-808
48. Cheng J-X. Coherent anti-Stokes Raman scattering microscopy. Applied Spectroscopy. 2007; 61(9): 197–208
49. Cheng J-X, Xie XS. Coherent anti-Stokes Raman scattering microscopy: instrumentation, theory, and applications. Journal of Physical Chemistry B. 2004; 108: 827-40
50. Strachan CJ, Windbergs M, Offerhaus HL. Pharmaceutical applications of non-linear imaging. International Journal of Pharmaceutics. 2011; 417(1-2): 163-72
51. Slipchenko MN, Chen H, Ely DR, Jung Y, Carvajal MT, Cheng J-X. Vibrational imaging of tablets by epidetected stimulated Raman scattering microscopy. Analyst. 2010; 135(10)
52. Fussell AL, Garbacik ET, Güres S, Offerhaus HL, Kleinebudde P, Strachan CJ. Application of hyperspectral coherent anti-Stokes Raman scattering microscopy to pharmaceutics 1. Bios SPIE Photonics West, Conference 8226, Multiphoton Microscopy in the Biomedical Sciences XII; 2012; San Franciscio, USA; 2012. p. Paper 8226-144
53. Jurna M, Windbergs M, Strachan CJ, Hartsuiker L, Otto C, Kleinebudde P, et al. Coherent anti-Stokes Raman scattering microscopy to monitor drug dissolution in different oral pharmaceutical tablets. Journal of Innovative Optical Health Sciences. 2009; 2(1): 37-43
54. Windbergs M, Jurna M, Offerhaus HL, Herek JL, Kleinebudde P, Strachan CJ. Chemical imaging of oral solid dosage forms and changes upon dissolution using coherent anti-Stokes Raman scattering microscopy Analytical Chemistry. 2009; 81(6): 2085–91
55. Kang E, Robinson J, Park K, Cheng JX. Paclitaxel distribution in poly(ethylene glycol)/poly(lactide-coglycolic acid) blends and its release visualized by coherent anti-Stokes Raman scattering microscopy. Journal of Controlled Release. 2007; 122(3): 261-8
56. Kang EN, Wang HF, Kwon IK, Robinson J, Park K, Cheng JX. In situ visualization of paclitaxel distribution and release by coherent anti-stokes Raman scattering microscopy. Analytical Chemistry. 2006; 78(23): 8036-43
57. Day JPR, Rago G, Domke KF, Velikov KP, Bonn M. Labelfree imaging of lipophilic bioactive molecules during lipid digestion by multiplex coherent anti-stokes raman scattering microspectroscopy. Journal of the American Chemical Society. 2010; 132(24): 8433-9
58. Docoslis A, Huszarik KL, Papageorgiou GZ, Bikiaris D, Stergiou A, Georgarakis E. Characterization of the distribution, polymorphism, and stability of nimodipine in its solid dispersions in polyethylene glycol by micro-Raman spectroscopy and powder x-ray diffraction. The AAPS Journal. 2007; 9(3): 43
59. Fujimaki Y, Matsubara T, Sakamoto T, Sasakura D, Miura T, Takekawa M, et al. Distribution of ethenzamide and other ingredients on granule surfaces studied by Raman microspectroscopy and mapping. Pharmazie. 2009; 64(5): 316-22
60. Furuyama N, Hasegawa S, Hamaura T, Yada S, Nakagami H, Yonemochi E, et al. Evaluation of solid dispersions on a molecular level by the Raman mapping technique. International Journal of Pharmaceutics. 2008; 361(1-2): 12-8
61. Karavas E, Georgarakis M, Docoslis A, Bikiaris D. Combining SEM, TEM, and micro-Raman techniques to differentiate between the amorphous molecular level dispersions and nanodispersions of a poorly watersoluble drug within a polymer matrix. International Journal of Pharmaceutics. 2007; 340(1-2): 76-83
62. Lin WQ, Jiang JH, Yang HF, Ozaki Y, Shen GL, Yu RQ. Characterization of chloramphenicol palmitate drug polymorphs by Raman mapping with multivariate image segmentation using a spatial directed agglomeration clustering method. Analytical Chemistry. 2006; 78(17): 6003-11
63. Meléndez PA, Kane KM, Ashvar CS, Albrecht M, Smith PA. Thermal inkjet application in the preparation of oral dosage forms: Dispensing of prednisolone solutions and polymorphic characterization by solid-state spectroscopic techniques. Journal of Pharmaceutical Sciences. 2008; 97(7): 2619-36
64. Poutiainen S, Pajander J, Savolainen A, Ketolainen J, Järvinen K. Evolution of granule structure and drug content during fluidized bed granulation by X-ray microtomography and confocal Raman spectroscopy. Journal of Pharmaceutical Sciences. 2011; 100(12): 5254-69
65. Ward S, Perkins M, Zhang J, Roberts CJ, Madden CE, Luk SY, et al. Identifying and mapping surface amorphous domains. Pharm Res. 2005; 22(7): 1195-202
About the author
Clare Strachan is Senior Lecturer of Pharmaceutical Sciences at the School of Pharmacy, University of Otago.