Primary validation of the growth direct bioburden system and media
Posted: 30 October 2020 | Abu Manju (Eindhoven University of Technology), David Jones (Rapid Micro Biosystems), Edwin van den Heuvel (Eindhoven University of Technology), Jaime Brosseau (Rapid Micro Biosystems), Niloufar Parsaei (Rapid Micro Biosystems) | No comments yet
This article presents statistics required to validate rapid microbial methods (RMMs) according to the requirements in the most recent version of European Pharmacopoeia (EP) 5.1.6. The validation methods for bioburden test application performed are also described.

Introduction
In 2015, Murphy and Schwedock1 published a paper outlining the statistics to be used to validate an RMM. Since that time, new versions of the US Pharmacopoeia (USP) and the EP have been published with updated statistics. The current EP 5.1.62 chapter has more clearly specified the requirement for suppliers of RMMs to supply the formal validation data obtained using their method. The analytical testing is well defined in the chapter; however, the statistical analysis is not as clear. The USP have made an obvious choice to focus on equivalence or non‑inferiority for most of the validation parameters but is less clear on the role of the supplier. It is the goal of this paper to describe the validation methods for bioburden test application performed using the Rapid Micro Biosystems Growth Direct (GD) system and associated consumables. Experimental data obtained has been analysed using statistical methods that are in line with the EP and USP.
Growth Direct
The GD system for rapid microbial enumeration is designed to automate the incubation of the bioburden media plates and enumerate any colonies present on the media. The instrument comprises two automated incubators, robotic sample transport systems, an advanced imaging system, two computers (one for system control and the other for image analysis) and associated hardware and staging required for the handling of up to 679 Growth Cassette™ products. These products are plastic contact plate-style cassettes with specific mechanical and optical features that facilitate the automated handling and imaging process. They incorporate standard media depending on their application – TSA, R2A and SDA. Filtration funnels are supplied with black mixed cellulose ester membrane – 0.45-micron pore size – to improve the signal-to-noise ratio for the detection system. Both white membranes and the media itself can exhibit fluorescence at the critical wavelengths of the system and need to be removed or reduced through the use of the black membrane.
During the incubation phase, images of each cassette are taken at intervals of four hours, allowing organisms and debris that are naturally fluorescent under the excitation blue light of the imager to be detected in the green spectrum. The images are recorded by a charged coupled device (CCD) camera every four hours. Analysis of the behaviour of objects over the incubation time by proprietary growth rules of the vision analysis software allows the GD system to distinguish and enumerate the growing objects from the background and debris. Most of the pharmacopoeial organisms are detected in less than 16 hours and accurately enumerated by 24 hours. At the end of an assay, the system reports the number of growing objects found on the surface of the membrane in the cassette. The technology is a quantitative enumeration method and will be validated as such.
Material and methods
The validation of the GD system and dedicated consumables was performed in accordance with the full requirements of EP 9.2; 5.1.62 and USP 38/NF33 Ch <1223>.3 The data presented in this paper support the primary analytical performance validation of the GD system (eg, validation at the supplier). For subsequent site implementations, a subset of the analytical tests can be performed to verify the systems performance as an “automated compendial test”. The test requirements for “automated compendial” are described in USP Ch <1223>, the PDA TR334 technical report and in literature (Jones et al 2018).5
Materials
Testing was performed on:
- RMB TSA media part number BTSA-48
- Control media Millipore Milliflex TSA part number MXSMCTS48
- RMB R2A media part number BR2A-48
- Control media was Millipore Milliflex R2A part MXSMCRA48.
Incubation was performed on the GD system and the control method was conducted in standard incubators. All incubations were performed at 30-35°C for more than 48 hours. Challenge ATCC microorganism, reconstituted commercial preparations from BioBall®. Stock EM cultures, freshly grown, for the EM isolates and titer from a colonial suspension.
Methods: validation parameters
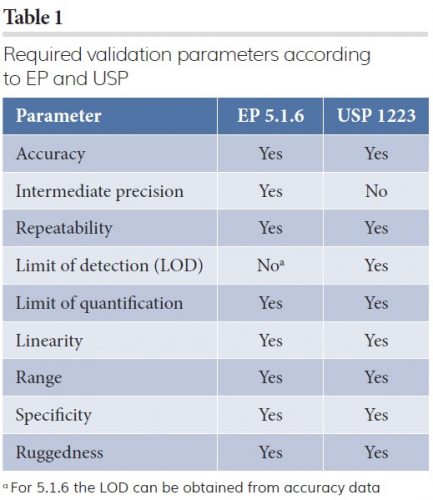
The parameters required to validate a quantitative analytical method according to the EP and USP are defined in Table 1.
- Accuracy of the test method is defined by the ability to accurately recover organisms with respect to a gold standard method. This means that the GD system must accurately culture and enumerate colonies on growth cassettes compared to results obtained on traditional media plates. The study investigated the accuracy of both the software (automated counts) and the manual counts.
- Precision consists of two separate components:
- Repeatability represents the variability of the test method under constant conditions (ie, when multiple replicates of the same test material are analysed by one person at one time)
- Intermediate precision represents the variability of the test method when performed on multiple samples from the same test material under various routinely changing conditions (eg, different operators, days).
- Linearity and range define the lowest to highest colony-forming unit (CFU) count that can be quantified with good precision and where the CFU counts are quantifiably or proportionally related to the sample dilution.
- The limit of detection (LOD) is the lowest level of CFU that can be confidently detected, while the limit of quantification (LOQ) is the lowest level of CFU that can be precisely quantified. The EP allows the LOD to be determined from the accuracy study. If the two methods are equivalent, the LOD of the rapid method will be the same as the compendial.
- Specificity is defined as the ability of the technology to accurately detect and enumerate the required range of microorganisms without generating false positives. Mixed organisms and stressed slow growing microorganisms are included in the validation study.
- Ruggedness is defined as the ability to change equipment, analysts and reagent lot number while still obtaining comparable results. This will coincide with intermediate precision.
Methods: experimental design
The experiment was designed to obtain all the required data in one series of experiments. The control compendial Milliflex funnels and media were used with manual analyst readings and incubations. For the GD method, using the system as an automated method to perform the colony enumeration. To minimise any variability in the manual enumeration method, three analysts read both the control samples and GD cassettes after the plates completed the automated count. The system only generated one result per cassette.
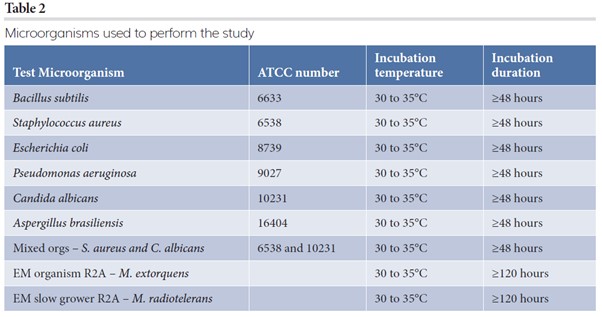
The representative test microorganisms (see Table 2) were prepared to cover the following range: 0.5CFU, 1CFU, 10CFU, 100CFU, 300CFU, 750CFU in 20ml of diluent, Fluid A. The 0.5CFU dilution was created to extend the dilution range to increase the probability of obtaining 1CFU. With 10 replicates the expectation is five tests with 1CFU and five tests with 0CFU – and an average 0.5CFU. The dilutions were created from two stock solutions by taking aliquots of different volumes. Ten replicates of each dilution on each media type were prepared by filtering 20ml of test sample through the membranes. Post filtration, the membranes were moved to the test media using the manufacturer’s recommended method. Negative controls were performed for each run. GD cassettes had the vision lids attached and loaded to the GD system. The Milliflex plates were capped and loaded to standard incubators. Upon completion of each test on the GD system the cassettes were collected for additional human enumeration of CFU. The manual read was performed by three independent analysts at the same time.
During execution with diluted cultures the experimental conditions were maintained to mitigate the possibility of cell numbers changing due to cell multiplication or death between test methods. The dilution series was divided between three operators for each series to reduce preparation time from start to finish and minimise any cell number changes.
For the intermediate precision study, S. aureus at two levels and both media (TSA and R2A) were used. Three analysts measured two spiked levels (50CFU and 150CFU) on five different days with 10 replicates at each test point. Media lots (n=3) and GD system (n=3) were also varied across days.
Methods: statistical approach1,6
The analysis for the accuracy data was conducted for each combination of type of organism and medium. For notational purposes we assume that observation Yhijk is the count for the kth test sample measured with method h (h=1: CMM; h=2: GDS), at spike level i (i=1: λ1=0.5CFU; i=2: λ2=1.0CFU; i=3: λ3=10CFU; i=4: λ4=100CFU) for analyst or reader j (j=1: analyst 1; j=2: analyst 2; j=3: analyst 3). For the GD system there are no analysts (j=1). We have denoted the spike level by λ_i and we assume that it is independent of method, analyst and sample. The count data Yhijk were analysed using Poisson regression. We assume that the expected or mean count is given by:
(1)
![]()
With log, the natural logarithm, ph the detection proportion and ηh the linearity coefficient of method h. Enumeration of microbiological method h is perfect when the following conditions are satisfied: the level of spike λi is exact, ph=1, and ηh =1.
The analysis of the precision study assumes a mixed effects Poisson regression model for the observed counts. The combination of analyst, day and medium lot were taken together as one factor called the analytical run, since this combined factor may affect precision in routine testing. Analysis was conducted per spike level and medium. For each combination of spike level and medium, the observation Yhijk is the count for the jth test sample measured with method h (h=1: GDC; h=2: GDS) at analytical run i (i=1, 2, ….., 15). Given the effect Zhi of analytical run i for method h, it is assumed that the distribution of the count data Yhij is Poisson distributed with expected or mean count given by:
(2)
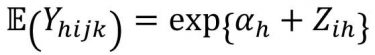
The effect Zhi of analytical run i for method h is considered random having a normal distribution with mean zero and variance σ2h. It quantifies the variability in enumeration that is additional to the Poisson variability from test samples, ie, run‑to-run variability.
Methods: evaluation of validation parameters
Linearity
Based on the mathematical form of the expected counts, the microbiological method is linear in the log scale, ie, the logarithm of the expected count is linear in the logarithm of the spike. To investigate the linearity, we will use the likelihood ratio test to compare the expected counts in (1) with expected counts of the form (Yhijk)=μhi (the saturated Poisson regression model). We will evaluate this goodness-of-fit for linearity for both microbiological methods to determine whether linearity or non‑linearity is consistent across the methods. The expected counts in (1) will also be compared with the observed counts using the R2 value to quantify goodness-of-fit and evaluate more practically possible violations of non-linearity in the log scale. We will also investigate the linearity coefficient, ie, test with the Wald test statistic null hypothesis H0: ηh=1 for method h. If this null hypothesis is not rejected, the expected counts is proportional to the spike level when the goodness-of-fit is not violated. We will also visualise the estimated expected counts in (1) with respect to the spiked levels.
Accuracy
Based on the statistical model in (1), the accuracy of the RMM is considered non-inferior with respect to the CMM whenever the expected count in (1) for RMM (h=2) is at least 70 percent of the expected counts for CMM (h=1) with 95 percent confidence. We will determine the range of spiked levels λ that would satisfy this definition of non-inferiority on the accuracy. The expected counts in (1) for both GD system and CMM methods will be visualised in one graph simultaneously in its original scale, for each organism and medium separately.
Limit of quantitation
The limit of quantitation for method h is determined by the lowest level of spike λ for which an observed count is unlikely (eg, one percent) to be equal to zero. For the Poisson regression analysis with expected counts in (1), the limit of quantitation is given by:
![]()
with q the level of confidence (0.99 IOR 99 percent). This limit will be estimated for both GD system and CMM methods rounded upwards to the nearest integer.
Repeatability and intermediate precision
Precision of the GD RMM is quantified by relative standard deviations (expressed in percentages). The repeatability is determined by the variability between test samples when all conditions can be seen as constant and the intermediate precision is the variability in test samples under controlled by variable conditions (analyst, day and media lot). Due to the assumption of the mixed effects Poisson model in (2), repeatability and intermediate precision are quantified as:
(3)
![]()
Besides reporting these measures of precision, the Wald test statistic will be used to test the null hypothesis H0 : α1 = α2 (equality of mean counts) and the likelihood ratio test will be used to test the null hypothesis H0 : σ21 1 = σ22 (equality of run‑to-run variability).
Results
The results are organised by the validation parameters: linearity, accuracy, limit of quantitation and precision.
Linearity
Tables 3 and 4 contain the results on linearity for TSA and R2A, respectively. It reports the p-value for the goodness-of-fit of the saturated Poisson model with the log linear model (column P-LRT). If the p-value is below 0.05, linearity is rejected and a linear relationship between the log expected count and the log spike is most likely violated. The column P-LC provides the p-value on proportionality, indicating if the expected counts are proportional to the original spike level. If the p-value is below 0.05, proportionality is most likely violated. The R2 (expressed in percentage) indicates how well the log linear model predicts the observed counts. A value larger than 95 percent indicates good prediction levels of the estimated model.
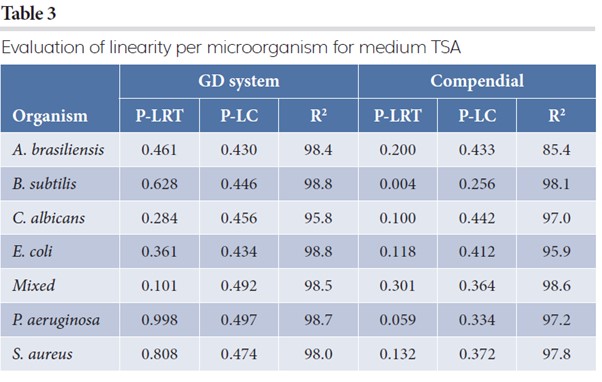
Linearity in the log scale is never rejected for the automated GD at significance level of 0.05. For the CMM, linearity in the log scale was violated five times at significance level of 0.05. The linearity coefficient is never different from the value one for both GD and CMM (all p-values are larger than 0.05), indicating that the expected counts are proportional to the spike level (when the goodness-of-fit is not violated). The R2 values for the GD are all above 95.8 percent and show that the log linear model is a good approximation for describing the counts.
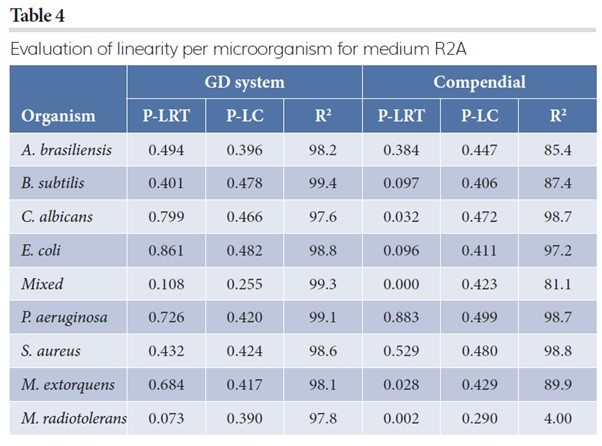
For many microorganisms on both media, the R2 values of the compendial method are at the same level as the GD method, but not for testing the conditions: A. brasiliences at medium R2A (85.4 percent), TSA (85.4 percent), B. subtilis (87.4 percent), mixed strain (81.1 percent), M. extorquens at medium R2A (89.9 percent) and M. radiotolerans at medium R2A (4.0 percent). It should be noted that M. radiotolerans did not grow on the compendial R2A media from the supplier.
Non-inferiority for accuracy
Table 5 reports the results on the minimal level of CFUs for which non-inferiority on accuracy is satisfied. It represents a range of spike levels for which the recovery of the GD system is at least 70 percent of the CMM (with 95 percent confidence). The table shows that for most conditions a recovery of 70 percent or more is obtained at very low spike levels but guaranteed for all conditions at spike levels of at least 5CFUs.
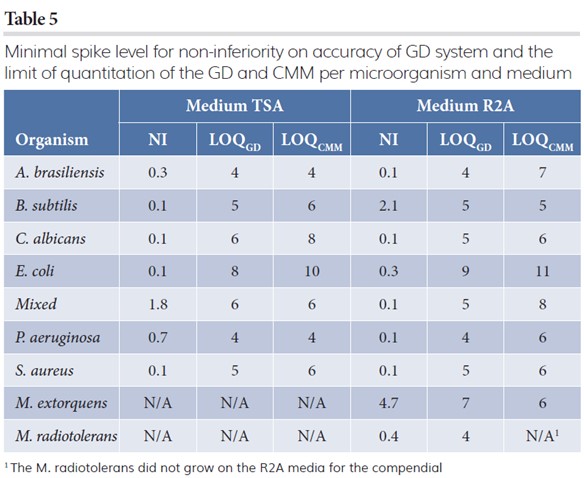
Limit of quantitation
Table 5 also reports the limit of quantitation, ie, the lowest estimated level of CFU for which it is unlikely (with one percent) to observe zero counts when the test sample contains the reported level of organisms on average. The results show that the estimated limits of quantitation for the GD system is less than or equal to the compendial, except for testing M. extorquens and M. radiotolerans at medium R2A, where CMM has a lower limit of quantitation. Nevertheless, the GD and CMM have similar limits of quantitation.
Precision
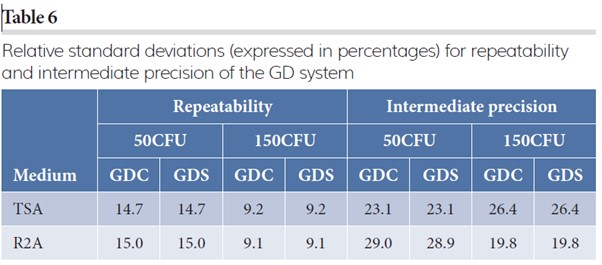
The P-values for the hypothesis on expected counts (H0 : α1 = α2) for the two GD systems were never rejected (TSA 50CFU: p = 0.999; TSA 150CFU: p = 0.999; R2A 50CFU: p = 0.971; R2A 150CFU: p = 0.981). However, the hypothesis for the run-to-run variability (H0 : α1 = α2) is rejected for both spike levels at both media (p < 0.001). Therefore, the measures of precision will be calculated for both methods separately. Table 6 reports these measures of precision on the four different conditions.
The measures of precision between the two GD systems are very similar. The intermediate precision is less than twice the repeatability, indicating a limited influence of run-to-run variability. Note that relative standard deviations below 30 percent is typically considered appropriate for microbiological methods and in vivo bioassays.
Conclusion
The data presented in this paper support the primary validation of the GD system’s bioburden media, TSA and R2A, for the quantitative detection of microorganisms relevant to the pharmaceutical industry. The experimental design and analysis were performed according to the requirements of the EP 5.1.6 and the USP Ch <1223>. The technology has passed all the key parameters to validate an RMM for use in the pharmaceutical QC testing arena. It also demonstrates equivalent or better results than a commercial compendial method.
Within each of the pharmaceutical alternative microbiological methods chapters there is a reference to the performance of a risk assessment to determine the validation required for the implementation of a new method. Both chapters allow for a reduced validation/verification with adequate justification – see EP 5.1.6 Section 3-2-3 Primary Validation: “Depending on the type of alternative method, relevant validation criteria shall be selected from the list below”. In the USP Ch <1223>, the GD technology is classed as an automated compendial method, requiring only a verification of the counting method followed by a method suitability study.
About the authors

Professor Edwin van den Heuvel studied mathematics at the University of Amsterdam where he also obtained his PhD in mathematical statistics. He has been working as a consultant on quality control and quality improvement and has been a director of a statistical unit in a pharmaceutical company for more than eight years. He has also worked as a professor of medical statistics at the University of Groningen. Currently, he is a professor of statistics and a vice dean at Eindhoven University of Technology. Edwin is an all-round research statistician with a broad range of expertise and specialises in the analysis of complex structured datasets.

Abu Manju studied for his bachelor and MSc in Statistics at the University of Chittagong, Bangladesh and obtained his PhD in Biostatistics from Maastricht University in the Netherlands. After his PhD, he worked in the pharmaceutical company MSD (known as Merck & Co in the US) for two years. He also worked as a part-time lecturer in Statistics at the Wittenborg University of Applied Sciences. Currently, he is a postdoc at the University of Eindhoven and his expertise and specialisation are in the pharmaceutical statistics, count data analysis and measurement system analysis.

David Jones, PhD has more than 20 years of experience with rapid microbial detection technology, laboratory instrumentation development and laboratory management. He has extensive experience of both the European and US markets. He is currently Director of Technical Marketing and Industry Affairs at Rapid Micro Biosystems. David has authored a number of papers on the validation of new technologies. He is also on the TR33 committee updating the guidelines to pharma for validation of rapid microbiology.
Co-authors:
Jaime Brosseau and Niloufar Parsaei, Rapid Micro Biosystems
References
- Murphy, Thomas, Schwedock, Julie, Nguyen, Kham, Mills, Anna and Jones, David; Evaluation of PDA Technical Report No 33. Statistical Testing Recommendations for a Rapid Microbiological Method Case Study PDA J Pharm Sci and Tech 2015, 69 526-539
- EP 9.2, 5.1.6 Alternative Methods for Control of Microbiological Quality, page 4339-4348
- USP 38/NF 33 General Chapter <1223>, Validation of Alternative Microbial Methods, page 7667-7681
- PDA Technical Report 33 (Revised), 2013, Evaluation, Validation and Implementation of Alternative and Rapid Microbial Methods
- Jones, D.L., Cundell, T.; Method Verification Requirements for an Advanced Imaging System for Microbial Plate Count Enumeration, PDA Journal of Pharm Sci and Tech
- Anscombe FJ, The transformation of Poisson, Binomial, and Negative-Binomial Data, Biometrika Trust, 1946, 35(3/4): 246-254.