Article 6: qPCR data analysis 2 – Controls and Troubleshooting
Posted: 12 December 2009 | Tania Nolan, Global Manager of Applications and Technical Support, Sigma-Aldrich and Stephen Bustin, Professor of Molecular Science, Centre for Academic Surgery, Institute of Cell and Molecular Science, Barts and the London School of Medicine and Dentistry | No comments yet
The tremendous increase in the number of laboratories using qPCR and publications relying on qPCR data are testament to the rapid uptake of this technology. When preceded by reverse transcription (RT-qPCR) it is regarded as the reference technique for validation of previously derived data such as from microarray studies and as the output with which to measure transcript changes after pathway disruption such as by transfection with siRNA or shRNA.
The tremendous increase in the number of laboratories using qPCR and publications relying on qPCR data are testament to the rapid uptake of this technology. When preceded by reverse transcription (RT-qPCR) it is regarded as the reference technique for validation of previously derived data such as from microarray studies and as the output with which to measure transcript changes after pathway disruption such as by transfection with siRNA or shRNA.
The tremendous increase in the number of laboratories using qPCR and publications relying on qPCR data are testament to the rapid uptake of this technology. When preceded by reverse transcription (RT-qPCR) it is regarded as the reference technique for validation of previously derived data such as from microarray studies and as the output with which to measure transcript changes after pathway disruption such as by transfection with siRNA or shRNA.
The rapid adoption of the technology is, in part, due to the simplicity with which data are derived. An RT-qPCR experiment requires the combination of PCR primers, cDNA template and DNA polymerase in a suitable buffer, as for legacy PCR but with the addition of either a DNA binding dye such as SYBR Green I dye, or a fluorescent labelled oligo positioned between the two primers (see previous articles in this series [1-5] for details of assay design and choice of detection chemistry). For such an apparently simple technique there are a substantial number of books, articles and conferences discussing the minutiae. It is remarkably difficult to cause the assay to fail completely, making the generation of amplification plots and Cq values almost inevitable. The challenge is to evaluate the data and ensure it represents the original biological question.
Incorporation of the recommendations from the previous articles[1-5] into a standard operating procedure will go some way towards generating amplification plots that are the results of efficient qPCR assays and accurately relate to the original nucleic acid sample. Nevertheless, the process of analysing these data is vulnerable to misinterpretation and should be approached with care equal to that exercised during the wet lab processes.
The correctly formed amplification plot and the process of analysing data were described in the previous article5. A further challenge is to identify those amplification plots that fail to meet the previously described criteria and to interpret these data in order to gain understanding of the failing reaction.
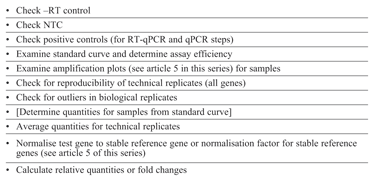
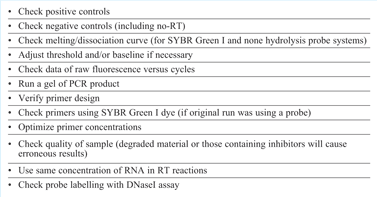
In the same way that we proposed adoption of an SOP for assay design4 and running qPCR/RT-qPCR experiments it is also important to adopt a procedure for data analysis (see Table 1) and troubleshooting (see Table 2). It is worthy of note that both of these processes have common first steps; examination of data derived from control reactions. Complete assurance of the quality of data is only possible if the correct controls have been included alongside the experimental samples.
The Power of Controls
It is an undeniable truth that controls and standards take up space on the plate and along with the process of optimisation, require additional reagents and an investment of time in order to select the most useful targets. Maybe this could be adopted as a general judgement for all science: When correctly performed all scientific investigation requires investment. The rewards of good science are incalculable; absolute security that the experimental data is as reliable as it can possibly be. When problems do occur the examination of controls facilitates a rapid understanding and resolution of the issue.
The inclusion and analysis of controls simply requires a logical approach. When the reverse transcription reaction is set up (one step or two step) a mock reaction containing no RT enzyme may also be processed in parallel. This is particularly important when genes that are present at low levels are to be examined or when the genes of interest are encoded from several genetic copies. It is of minimal importance if the assays have been designed to span an intron exon boundary such that gDNA copies are not amplified or detected in qPCR. When the minus RT control is processed through a mock RT, no cDNA is produced. Therefore when this sample is included in the downstream PCR process, any signal detected could be due to detection of gDNA targets. However these data must be considered alongside the data derived from the No Template Control (NTC). The NTC is a mock qPCR reaction and is best constructed as the last sample to be handled so that any contamination is more likely to be detected. The temptation to prepare and cap these tubes first to avoid detecting contamination should be resisted, while ensuring experiments look clean this is merely a form of self-delusion and is sure to result in tears. For a “belt and braces” approach consider constructing two sets of NTC duplicates, one set being the first samples handled and one set as the last samples handled. When using a probe it is highly unlikely that none specific amplification products or primer dimers would be detected, unless gene families are being studied and so the final or second set is adequate. Therefore when using a probe system and a NTC is positive the most likely conclusion is that the reaction has become contaminated with specific template during the set up process. However, when using a DNA binding dye, a positive signal in the NTC could be due to either or both contamination and detection of non-specific products, most often derived from primer dimers. In this case a post reaction melt curve analysis of the NTC is informative (see Figure 1). Primer dimers are typically smaller and of non-uniform composition than the specific product. Analysis of the second derivation of the melt curve usually results in a broader peak at lower melting temperature than the specific product. Therefore the amplification products from a NTC with a positive Cq may contain a single product melting at high temperature (around 70-80°C) which would indicate that the reaction is contaminated with specific target, a single product melting at low temperature (around 50-60°C) indicating that primer dimers are being detected in the absence of specific target or two products melting to form two peaks which indicates that both contamination with specific product and primer dimers are evident. Discrimination of the melt profile of the specific product or primer dimer is much easier if this is referenced to a positive control. For some experiments the positive control can be difficult to define. Ideally this is a sample containing the target of interest in a condition that cannot fail to amplify. When the control is for the qPCR step this needs to be in DNA form since failure to amplify could be due to RT or qPCR steps. Positive controls for the qPCR step include cloned cDNA targets, purified PCR product, synthetic DNA of the amplicon sequence. Positive controls for the RT-qPCR process are restricted to RNA of predetermined quality from a sample that is known to express the target, in vitro transcribed targets or artificially produced RNA molecules. Positive controls are often the material used to produce a standard curve. Using the standard curve as the positive control has the added advantage that this also serves for quantification and also a tool by which to compare inter run variation.
A careful and logical examination of the controls detailed above will lead to an explanation for failed reactions in that the part of the experiment that has failed can be identified. A more detailed study of the qPCR data may help to understand more fully why the experiment has failed.
The power of raw data
The process of data analysis is best approached from an initial investigation of the raw data. With experience, viewing the raw data plots can be used to evaluate the assay.
Although relatively rare, the reaction that has totally failed can be the most challenging to troubleshoot. However, when the assay has failed completely, the raw data are still useful. The vertical positioning of the flat line on fluorescence versus cycle plot is informative: When working with SYBR Green I dye the initial background fluorescence should be close to zero because the unbound dye has very low background. When this is significantly higher than zero and little or no amplification is evident it is possible that the target concentration is too high resulting in template inhibition of the reaction. When this is close to zero other reasons for the failed reaction must be explored, as discussed below.
When using a probe there are further possibilities relating to the functioning of the probe.
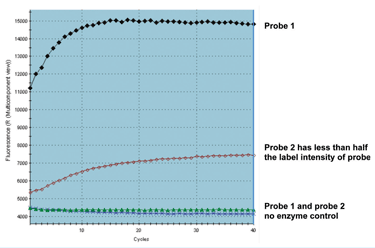
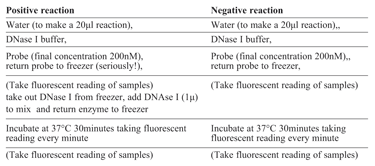
When a reaction containing a probe fails completely there is the additional possibility that the probe has failed to hybridise and/or be digested (for hydrolysis probes) or failed to adopt the required structural modification (for structural systems such as Molecular beacons or Scorpions). It may be that the increase in the probe fluorescence is not being detected by the qPCR instrument, possibly due to unsuitable label/quencher combination being used or to insufficient labelling or quenching. When the raw data for the amplification plots are examined, a probe with background fluorescence around zero raises the suspicion that there was not a functioning probe in the reaction mix. This may be due to inadequate labelling or incorrect label and detection choice (or the vague possibility that the scientist may have neglected to add the probe?). When the background is very high it is likely that the probe is inadequately quenched. Either of these can be demonstrated by performing a simple DNase I digest on a sample of probe (see Table 3). Extreme care must be observed when handling probes and DNase I. Hence combine the regents in the order given on Table 3 ensuring that the probe and DNaseI are NEVER in close proximity. Either incubate in the qPCR instrument and collect fluorescent data each minute or take an initial and final fluorescent reading (see Figure 1). It is helpful to set up reactions with and without DNaseI enzyme for both the probe under question and another one that is known to work well and has the same fluorescent label and quencher. The DNaseI serves to ensure that the probe is digested, separating the label from quencher and so this simple procedure should result in a significant increase in signal (see Figure 1).
If the positive control has a positive signal but some samples have failed to amplify the failed test sample must be due to a template problem (template quality was discussed in the first article of this series1). If the positive control has also failed to amplify and this is the first time the assay has been tested there are multiple alternatives for the failures. The most prudent course of action is to check the oligo sequences and ensure they are correct, especially that they target the correct strand and in the correct orientation[4]. Run a conventional electrophoresis gel of the products to determine whether there is amplification but no detection. Assuming that the theory is sound, repeat the reaction on the positive control samples (ie those that are known to be high quality template) or artificial amplicon templates using both SYBR Green I dye and the probe in parallel reactions. If the both SYBR Green I and probe reactions are negative the fault is likely to be primer design, whereas if only the SYBR Green I reactions are positive and the probe negative it is clear that the probe is at fault. (Of course, on some occasions both the SYBR Green I and the repeated probe reactions are positive and then the likely explanation for the first failure is pretty self-explanatory).
Alternative reasons for poor quality assays have been outlined in articles one to five of this series[1-5]. It has been made abundantly clear that high quality data are only achieved from the combination of high quality samples with high quality assays. It is essential that both of these are validated before processing the data and entering into statistical analyses. One of the greatest dangers of qPCR is that poor quality assays yield Cq values that can easily be subjected to statistical investigation. In order for the statistics to be meaningful the input must be fully controlled and validated.
The Power of High Quality Science
The processes of RT-qPCR or qPCR are most vulnerable to variation in the early stages of the process involving samples acquisition and processing and least vulnerable at the qPCR stage. Therefore, when considering experimental design these sources of variation should be considered. The highest source of experimental variance is at the biological level and so this is the step that requires the greatest number of replicates, as many as can be practically and economically managed. It is critical to refer to the statistical tests or one of several sources of support for data analysis[7-9] before entering the lab and determine the number of samples required to ensure the desired significance level is reached. The next most variable step (if required) is the RT process and so it is of value to replicate the RT on each biological RNA sample. When optimised, QPCR is the least variable stage of the process.
This series of articles has been designed to discuss each step of the RT-qPCR process. It has been illustrated that there are essential and desirable steps to ensure that every process is optimised.
Appropriate sample handling and extraction, RT and qPCR assay design and optimisation strategies are crucial aspects of the qPCR workflow. Sample processing procedures are required that stabilise transcript quantities, prevent target degradation and remove all factors that can inhibit downstream enzymatic reactions1. The choice of reverse transcription enzyme, priming and reaction protocol also influence transcript quantification2. Equally important are the processes required to analyse accurately the Cq or quantity values. Appropriate controls are absolutely required in order to have greater confidence in the value of the experimental data and also for the inevitable process of troubleshooting. The aim of every scientist is to investigate their chosen subject and communicate these findings via the peer review publication process. It has been our aim to facilitate that process by providing guidance here and elsewhere[6]. The hope is that the quality of publications containing RT-qPCR data will increase and retractions will be avoided, adding to genuine scientific progress.


Figure 1: Two probes were subjected to DNase I digestion alongside a no DNase I control. Probe 1 functioned well in qPCR and probe 2 very poorly. There is an increase in background fluorescence after digestion of both probes with a significantly higher yield for probe 1. It is apparent that probe 2 is inadequately labelled


Table 1: data analysis


Table 2: Troubleshooting


Table 3
References
- Tania Nolan and Stephen A Bustin. The Importance of Sample Quality for qPCR. Eur Pharm Rev. 1 (2009) 15-20.
- Tania Nolan and Stephen A Bustin. Reverse Transcription -A Necessary Evil. Eur Pharm Rev. 2 (2009) 15-20.
- Tania Nolan and Stephen A Bustin. qPCR Assay Design. Eur Pharm Rev. 3 (2009) 15-20.
- Tania Nolan and Stephen A Bustin. Optimisation of the PCR step of a qPCR Assay. Eur Pharm Rev. 4 (2009) 15-20.
- Tania Nolan, Jim Huggett and Stephen A Bustin. QPCR data analysis – Amplification Plots, Cq and Normalisation Eur Pharm Rev. 5 (2009).
- S.A. Bustin, V. Benes, J.A. Garson, J. Hellemans, J. Huggett, M. Kubista, R. Mueller, T. Nolan, M.W. Pfaffl, G.F. Shipley, J. Vandesompele, and C.T. Wittwer, The MIQE Guidelines: Minimum Information for Publication of Quantitative Real-Time PCR Experiments. Clinical Chemistry 55 (2009) 609-620.
- For further information email [email protected]
- http://www.biogazelle.com
- http://www.multid.se/genex.html


