

A significant comparison between collapse and glass transition temperatures
Posted: 29 September 2008 | | 1 comment
Rational freeze-drying process design is based on a representative and accurate measurement of the critical formulation temperature. To avoid product shrinkage or collapse, it is indispensable to control the product temperature just below this key temperature during primary drying. Over the last decades, DSC was routinely used to determine the glass transition temperature of the maximally freeze concentrated solute (Tg’), information which was then applied to freeze-drying process design. Recently, Freeze-Dry Microscopy (FDM) was introduced as a new technology to determine an even more representative critical temperature: the collapse temperature (Tc). Today, important technological improvements in FDM even allow more sophisticated observations of collapse behaviour and therefore, further cycle optimization.
Freeze-drying: a complex but important drying technology
Freeze-drying is a drying technique widely used to stabilise biopharmaceutical drug products like proteins and peptides. Many of these drugs must be administered as an injectable dosage form for medical treatment, but they cannot be stored over a longer time period since the active pharmaceutical ingredient (API) is physically and/or chemically unstable in aqueous solutions1. Although expensive, freeze-drying (or lyophilization) is a very gentle way of stabilizing these highly active molecules. Latest examples of important freeze-dried drugs on the world market are Xolair® (Omalizumab) for subcutaneous use with a humanized monoclonal antibody against allergic asthma2 and Remicade® (Infliximab) for the treatment of Chron’s disease, plaque psoriasis and rheumatoid arthritis3.
The freeze-drying process consists of three steps. The first step is the freezing phase which encompasses the application of a well-chosen freezing rate. The following step, denoted as ‘primary drying’ removes the ice in the freeze-concentrated solution by sublimation, a process which is commenced by lowering the chamber pressure and slight elevation of the shelf temperature. The water vapor is then re-sublimed at the (much colder) surface of the condenser coils or plates. Product temperatures during primary drying can usually be found between -35 and -20°C. Bound water in the product matrix is finally removed in the secondary drying step by further elevation of the shelf temperature at the same pressure conditions used in primary drying. In order to receive a mechanically stable cake with an acceptable storage stability of the API, a water concentration of 1% or less is required in most of the cases after secondary drying.4
To avoid loss of activity of the drug during the process, cryo- and lyo-protectants are commonly added to the API solution. Here, excipients typically used are sugars (e.g. trehalose), polymers (e.g. polyvinylpyrrolidione, PVP), surfactants, amino acids (e.g. histidine) and others5. Some APIs are stabilized by using crystalline matrices which serve as a rigid scaffold, while others are embedded in amorphous glasses formed by excipients like sugars and polymers.
What is the relevance of the critical formulation temperature?
The most time consuming step in a freeze-drying cycle is the primary drying step. Here, the heat provided by the shelves must be balanced by the heat removed by sublimation (steady state). The higher the shelf temperature, the higher the mass flow rate of ice from the product and therefore, the shorter the primary drying time interval (i.e. when all ice has been removed from the product). Due to the physico-chemical state of a formulation, the process is limited by a maximum allowable product temperature which must not be exceeded during this phase. This temperature is called the “critical formulation temperature” and depends on the type and total amount of the constituents of the aqueous formulation. The critical formulation temperature can be determined by several methods which are all based on an increase in molecular mobility in the product system. For crystalline systems, the maximally tolerable temperature is the eutectic temperature (Teut) which is commonly determined nowadays by Differential Scanning Calorimetry (DSC). Eutectic temperatures are high relative to glass transitions and processing of such formulations is easy. For amorphous systems, however, the critical temperature is represented by the glass transition temperature of the maximally freeze concentrated solute (Tg’) or the collapse temperature (Tc), depending on the applied analytical method. If the product is dried well above Tg’ or Tc, the excessive energy transfer leads to viscous flow of the dried, filament-like product structure adjacent to the sublimation interface. The amorphous structure in which the API is embedded collapses which, in some cases, means loss of stability of the API due to its elevated mobility.5
Tg’ and Tc do not represent the same experimental parameter: Tg’ by DSC is a measure of a heat flow difference between an empty reference pan and a sample pan containing a completely frozen structure. Ice is in close contact with the glassy phase during the entire experiment and is not removed by sublimation (atmospheric pressure). In turn, a Freeze-Dry Microscopy measurement imitates the freeze-drying process by applying controlled, low pressure conditions in a special freeze-drying stage which then allows to sublime ice from the sample. The difference between these two methods becomes obvious in the results obtained for the critical formulation temperature: Tc values are many times reported higher (2-5°C) than their corresponding Tg’ values.4 Here, Tc represents the higher and more relevant temperature for the optimization of freeze-drying cycles and formulations.
Freeze-Dry Microscopy: a brief historical perspective
Freeze-Dry Microscopy is the concept of observing the structural behavior of a given sample solution or formulation while drying it under a light microscope. Yet, the purpose of the procedure is not to obtain a stable product like it is for the freeze-drying process itself, but to collapse the product while measuring the momentary temperature. Therefore the sample is slowly heated (0.5-1.0°C/min) with a constant rate during the sublimation process. Modern systems use digital cameras to collect pictures which can be then analyzed using commercially available software.
Becoming now more and more standard in pharmaceutical research and development laboratories, Freeze-Dry Microscopy is known for over 40 years. In 1972, Bellows and King described a first method of how to measure the collapse temperature, but they did not yet use a microscope.6 This, however, was done in the following years: Flink and Gejl-Hansen published in 1978 a manuscript explaining the measurement methodology of two simple freeze-drying microscope stages.7 A fundamental study which investigated not only the collapse itself but also the mechanisms behind it was conducted by Pikal and Shah in 1990.11 Although their research was based on a special moxalactam formulation, many of their conclusions could be transferred on other systems. In 2004 Fonseca et al. determined the collapse temperature of freeze-dried Lactobacillus bulgaricus suspensions and gave practical advice by proposing a protocol for FDM measurements.8
Old vs. new: Impact of FDM equipment on collapse temperature measurements
Research during the last 2-3 years revealed that not only the measurement methodology, but also the equipment used for FDM plays a very important role to obtain reliable and representative results for collapse temperatures. Over the last decade, technical improvements in the FDM equipment were mainly realized in the quality of the microscope in conjunction with high quality analyzer/polarizer systems. Moreover, another key improvement has been established by switching from video camera systems to high resolution digital cameras mounted on top of the microscope. The freeze-drying stage (FDCS 196, LINKAM Scientific Instruments, UK), however, was only slightly improved over the years by establishing a motor controlled valve to allow pressure control within the drying chamber. To contrast the potential bias in Tc when using old and new microscopy and analyzer/polarizer equipment, five sample solutions were measured by Freeze-Dry Microscopy using (1) an old microscope (OLYMPUS BH-2) with a polarizer foil and (2) a new microscopy system (ZEISS AxioImager.A1) including a lambda plate for polarization. Note that the authors would like to mention that the key argument in this examination is the year of manufacture of the equipment and is not intended as a general quality discussion of the equipment of a given company. Table 1 summarizes important equipment components of both microscopy systems used in this study and compares their impact on the quality of the measured FDM temperatures.


Table 2 illustrates the collapse temperature data using the old and new equipment and applying the same experimental conditions as well as the corresponding glass transition temperatures (1/2 ΔCp) for four excipients (lactose, trehalose, PVP 40 kDa and histidine) and for b-galactosidase (API). In particular for the temperature of the onset of collapse (Toc), a bias of up to 3°C for PVP 40 kDa was detected. Toc commonly refers to the temperature where the first holes and gaps in the structure in the dried region adjacent to the sublimation front can be detected. At this temperature, the structure starts to undergo viscous flow, resulting in structural damage of the matrix. Since there is currently no commercial software available, the interpretation of the collapse behaviour and the detection of the Toc is user dependent. Here, the capability of a user to interpret the different phases of collapse is clearly a function of the experience of this user. In practice, a reliable mark for a more in-depth investigation of the collapse behaviour with elevated product temperature is the differentiation between Toc and a full collapse (Tfc). A full collapse may be defined as the point where no connection between the dried area and the structure at the sublimation interface is present (at a given temperature). Here, more recent microscopy equipment is helpful for experienced users as well as for beginners. Note that the possibility to observe a collapse by human eye is limited by the light source of the microscope (the brighter the picture the easier it is) and by the polarization filter. Polarized light and the resulting rainbow colors enable the user to differentiate between regular holes in the dried structure and holes resulting from viscous flow. Figures 1A and 1B reflect this situation, illustrating the Toc for lactose using the old and the new equipment. The better light source of the new microscope results in a Toc which is lower than the Toc detected with the old unit. A comparison between PVP 40 kDa and histidine data further underlines that the polarization filter of the newer microscope prevents the user from misinterpreting the holes in the structure relative to the image obtained from the polarization foil of the old OLYMPUS microscope (cf. Figure 1C, D).
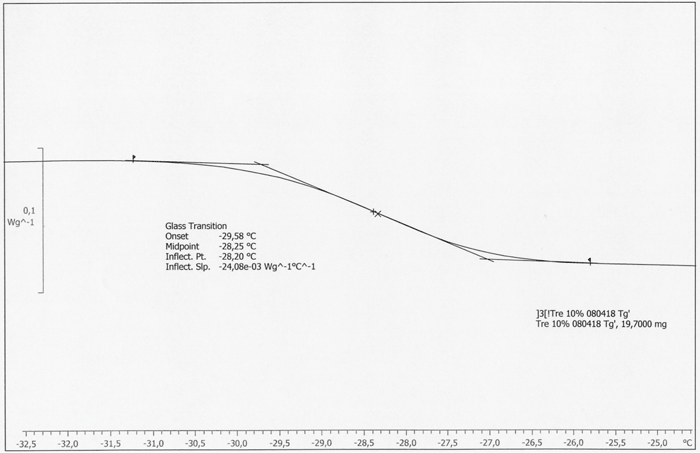
Figure 2: DSC curve of trehalose: inflection point at -28.20°C, midpoint at -28.25°C
Collapse and glass transition temperature: a comparison
Considering the relevance for formulation design and subsequent freeze-drying cycle optimization, there are merits and demerits for both Freeze-Dry Microscopy and Differential Scanning Calorimetry. A clear drawback of the DSC procedure is that this method examines a static phenomenon and does not delineate the “real” situation during primary drying of a freeze-drying cycle. FDM is more representative as it measures the temperature when the matrix at the sublimation interface undergoes viscous flow. Table 2 on page 75 summarizes those differences in methodology by providing Toc, Tfc and Tg’ data. Tg’ values are usually found lower than corresponding Toc temperatures. Tg’ therefore represents (for many formulations) the most conservative upper boundary temperature which can be used for cycle design. While this has, in principle, not a negative impact on the final product quality (a more conservative prediction of the collapse temperature may only result in a much longer freeze-drying process), the true optimization potential of the cycle will be neglected. In addition, DSC analysis of high concentrated protein formulations (e.g. monoclonal antibodies) may not provide reliable glass transition data since the ΔCp of proteins is extremely low. To account for such problems, elevated heating rates (> 20°C/min) are commonly used to achieve better resolution of a glass transition. However, it has already been reported in the literature that high heating rates shift the glass transition to higher (i.e. more positive) temperatures.9 This is, in turn, not representative for the freeze-drying processes where temperature changes are moderate over the time scale. A merit of DSC is that the evaluation by the instrument software is easy and the results are more independent of the user. However, several procedures can be used to evaluate Tg’: midpoint between two tangents (half ΔCp), inflection point of the curve or even the onset of the step change (cf. Figure 2). In many cases, where the glass transition curve is distorted due to enthalpy relaxation or overlapping crystallization of a component, these methods do not provide the same answer for Tg’. In some cases, more sophisticated techniques like MDSC (Modulated DSC) can be used, but the selection of appropriate experimental parameters and calibration of the DSC instrument may have even higher divergent effects.10 When it comes to sample throughput, DSC is clearly more convenient and more effective than Freeze-Dry Microscopy.

Deriving from the different measurement technique there is another important difference between Tg’ and Tc. Glass transition is a physical change that does not depend on the concentration of the substances in the solution, whereas for Tc a clear dependence on the total solid content of the single excipients in the sample was investigated. Pikal et al. noticed this correlation already in 199011, but it was investigated recently in much more detail for various excipients and total solid contents12. As a result, a formulation scientist needs to consider this collapse behavior when a placebo formulation for scale-up is developed. At the same time, this knowledge allows to optimize formulations by slightly changing the concentration of certain excipients.
The last and most important question is addressing the transferability of Tc (or Tg’) data to a freeze-drying cycle. While most recent reports indicate that some products may be freeze-dried well above Toc without significant loss of structure, it is still unclear if this observation is based on “translation” issues, based on the analytical or the process part.13 For example it is still common practice to use Toc as a measure of the critical temperature of a formulation. Instead it might be valuable to look at the entire “transition” (i.e. the range from Toc to Tfc) to better predict the product behavior during the cycle. In turn, very little information is available about the collapse behavior in a vial during primary drying, including atypical heat transfer to the product and an increase in product resistance over time (a true three dimensional system). A similar discussion may arise with glass transitions. Note that Tg’ is a temperature interval, rather than a single temperature. Preliminary discussions have started if even an “onset” or “endset” of a glass transition could be useful for process design. Clearly, further investigations are needed to better translate (or scale) this information obtained from the analytical instrument to a real freeze-drying process.
Conclusions
Freeze-drying is a well established drying procedure for biopharmaceuticals. The key parameter in primary drying is the critical formulation temperature which limits the maximum heat applicable to the product. New analysis techniques and instruments offer the opportunity to obtain better freeze-dried products and to cut cycle time. A representative measurement of the critical formulation temperature is mandatory for process optimization, considering that a 1°C increase in product temperature during a run may cut up to 13% of the primary drying time14. In the last decades, the glass transition temperature Tg’ was mainly used as the critical temperature. Today, it is known that the collapse temperature Tc much better represents the situation during drying and collapse. Therefore, the tool of Freeze-Dry Microscopy is of increasing importance for research and development purposes raising questions at the same time of the best methodology, best interpretation and best equipment. The results presented in this article indicate that an up-to-date transmitted light microscope with a polarizer/lambda plate system and a digital camera system clearly facilitates the detection of collapse and ensures more representative data. For comparison reasons and to better understand collapse behaviour of a given formulation, onset of collapse (Toc) and a full collapse (Tfc) should be evaluated.
References
- Franks, F. (1998). Freeze-drying of bioproducts: putting principles into practice. Eur. J. Pharm. Biopharm. (45), pp. 221-229.
- Xolair Home Page. http://www.xolair.com (accessed April 2008)
- Remicade Home Page. http://www.remicade.com (accessed April 2008)
- Costantino, H. R., & Pikal, M. J. (2005). AAPS Press series: Biotechnology: Pharmaceutical Aspects. Lyophilization of Biopharmaceuticals , 2.
- Wang, W. (2000). Lyophilization and development of solid protein pharmaceuticals. Int. J. Pharm. (203), pp. 1-60.
- Bellows, R. J., & King, C. J. (1972). Freeze-Drying of Aqueous Solutions: Maximum Allowable Operating Temperature. Cryobiology (9), pp. 559-561.
- Flink, J. M., & Gejl-Hansen, F. (1978). Two simple freeze drying microscope stages. Rev. Sci. Instrum. (49 (2)), pp. 269-271.
- Fonseca, F., Passot, S., Cunin, O., & Marin, M. (2004). Collapse Temperature of Freeze-Dried Lactobacillus bulgaricus Suspensions and Protective Media. Biotechnol. Prog. (20), pp. 229-238.
- Searles, J. (2004). Freezing and Annealing Phenomena in Lyophilization. In L. Rey, & J. May, Freeze-Drying/Lyophilization of Pharmaceutical and Biological Products (pp. 109-145). New York: Marcel Dekker, Inc.
- Hill, V.L., Craig, D.Q.M., & Felly, L.C. (1999). The effects of experimental parameters and calibration on MTDSC data. Int. J. Pharm. (192), pp. 21-32.
- Pikal, M.J., Shah, S. (1990). The collapse temperature in freeze drying: Dependence on measurement methodology and rate of water removal from the glassy phase. Int. J. Pharm. (62), pp. 165-186.
- Meister, E., & Gieseler, H. (2006). Evaluation of Collapse Temperatures by Freeze-Dry Microscopy: Impact of Excipient Concentration on Measured Transition and the Overall Dependence on Measurement Methodology. Proc. 5th World Meeting on Pharmaceutics and Pharmaceutical Technology, Geneva, March 27-30.
- Jiang, S., & Nail, S.L. (1998). Effect of process conditions on recovery of protein activity after freezing and freeze-drying. Eur. J. Pharm. Biopharm. (45), pp. 249-257.
- Tang, X., & Pikal, M. (2004). Design of Freeze-Drying Processes for Pharmaceuticals: Practical Advice. Pharm. Res. (21 (2)), pp. 191-200.
- Adams, G., & Ramsay, J. (1996). Optimizing the lyophilization cycle and the consequences of collapse on the pharmaceutical acceptability of Erwinia L-asparaginase. J. Pharm. Sci. (85), pp. 1301-1305.
- Pikal, M., & Shah, S.; unpublished data Eli Lilly & Co.
- Chang, B., & Randall, C. (1992). Use of subambient thermal analysis to optimize protein lyophilization. Cryobiology (29), pp. 632-656.
- Her, L., & Nail, S. (1994). Measurement of glass transition temperatures of freeze-concentrated solutes by differential scanning calorimetry. Pharm. Res. (11), pp. 54-59.
- Overcashier, D., Patapoff, T., & Hsu, C. (1999). Lyophilization of protein formulations in vials: investigation of the relationship between resistance to vapor flow during primary drying and small-scale product collapse. J. Pharm. Sci. (88), pp. 688-695.
- Österberg, T., & Wadsten, T. (1999). Physical state of L-histidine after freeze-drying and long-term storage. Eur. J. Pharm. Sci. (8), pp. 301-308.
- MacKenzie, A. (1966). Basic principles of freeze drying for pharmaceuticals. Bull. Par. Drug Assoc. (20), pp. 101-129.
- Levine, H., & Slade, L. (1998). Principles of “cryostabilization” technology from structure/property relationships of carbohydrate/water systems – a review. Cryo-Lett. (9), pp. 21-63.
Issue
Related topics
Related organisations
Linkam Scientific Instruments, University of Erlangen-Nuremberg

how to get a completely amorphous product wherein the cryo-protectant used is mannitol