PAT and scalable automation for bioprocess control and monitoring
Posted: 27 March 2007 | | No comments yet
This case study provides a comprehensive look at Talecris1 Biotherapeutics’ approach to PAT and automation followed by examples of PAT deployed on a bioprocess. It introduces the concept of integrated and scalable automation, provides a comparison of automation concepts and explains how the selected automation effectively supports initiatives such as PAT.
This case study provides a comprehensive look at Talecris1 Biotherapeutics’ approach to PAT and automation followed by examples of PAT deployed on a bioprocess. It introduces the concept of integrated and scalable automation, provides a comparison of automation concepts and explains how the selected automation effectively supports initiatives such as PAT.
This case study provides a comprehensive look at Talecris1 Biotherapeutics’ approach to PAT and automation followed by examples of PAT deployed on a bioprocess. It introduces the concept of integrated and scalable automation, provides a comparison of automation concepts and explains how the selected automation effectively supports initiatives such as PAT.
There has been considerable interest within the pharmaceutical industry with regard to the recently approved FDA guideline on PAT. In September 2004, the FDA issued their final guidance for the industry, “PAT – A Framework for Innovative Pharmaceutical Development, Manufacturing and Quality Assurance.” The guidance describes a framework for the “implementation of innovative pharmaceutical development, manufacturing and quality assurance.” The guidance extends beyond mere installation of process analysers – it encourages the application of process control, continuous improvement and knowledge management tools along with the vision of an exciting, new approach to pharmaceutical manufacturing and regulatory efficiency. PAT promises to deliver a ‘culture-change’ in the industry, which has too often treated innovation and productivity as step-children to regulation and compliance. With PAT guidance in place, manufacturing companies now have the FDA’s encouragement to adopt a new, risk-based regulatory framework that has its basis in scientific and engineering principles. Though as with any new initiative, questions are rife as to how to implement PAT; what is the best approach; and how to optimally enforce IT and automation strategies to support the PAT framework?
We were able to incorporate the ideas of the PAT initiative into a new biological process that our company developed and which is currently deployed at our facility in Clayton, North Carolina. Utilising this project as a case study, this article presents the approach to PAT that we adopted at this site, along with an automation strategy that we believe enhanced our PAT effort. The article begins by first explaining our interpretation and framework for PAT. We will then move on to discuss the role of automation and explain the concept of ‘scalable’ automation. After a brief introduction to the case study, we will compare automation concepts and explain the importance of having a sufficient automation infrastructure in place to support PAT. We will then present two examples from our case study to demonstrate the benefits of deploying PAT. The first example is centered on the operation and control of our Water for Injection (WFI) systems for our processes. The second example describes a reporting application that utilises the advantages of the automation infrastructure to provide a real-time comparison of parameters over multiple batches, also referred to as the fingerprinting of ‘golden batches’.
The PAT approach
The FDA guideline1 presents a very broad interpretation of what the Agency considers PAT to be. As a site, we are in the process of developing a well-documented ‘master-plan’ that defines our interpretation of the guideline and presents a roadmap for our company to follow while implementing PAT. The master plan defines the mission, vision, strategy and framework of our PAT effort. It also presents a blueprint-document that all PAT projects follow to ensure consistency across various PAT initiatives. Within the master plan, the PAT framework is detailed, which explains how a PAT opportunity is initiated, executed and evaluated. The framework is presented in Figure 1 and a detailed explanation of the proposed steps to a PAT implementation are provided in Panel 1.
The process of identifying, monitoring, analysing, controlling and reporting combined from the PAT approach. Once these discrete steps have been deployed, we expect to achieve the final goal of most PAT initiatives – process understanding. Understanding the process well, with critical points identified and controlled and all sources of variability under check, we can then reap the benefits of the PAT model. These benefits include, but are not limited to the following:
- Real-time quality assurance
- Right first-time and enhanced root cause analysis tools
- Reduced cycle times
- Yield improvement opportunities
- Faster time to market potential
- Decreased burden of final product testing
- Reduced manual testing
Role of automation
The model in Figure 1 underlines the importance of having automation in place, which can support the monitoring, modeling, controlling and reporting of the Critical Quality Attributes (CQAs) for any PAT effort. To implement PAT effectively, automation needs to support the effort of continuously and automatically collecting data – not just from the sensors directly associated with the process, but from all of the other factors that could influence the results. In other words, close integration with the control system becomes very desirable if decisions are being made on the basis of online measurements, while deviation handling capabilities are necessary to ensure process control. The control concept is based on the model of the so-called automation pyramid (Figure 2). The pyramid describes the layers and functions of automation beginning with the plant floor or field instrumentation and actuators. It can extend all the way up to the Manufacturing Execution System (MES) and Enterprise Resource Planning (ERP) level.
The idea behind the applied concept of ‘scalable’ automation is to put the basic infrastructure and functions for automation in place with every new project. This allows for higher levels of automation, including PAT functions, to be added later on in the project or even during the operational phase of the facility. The application of today’s ‘New Generation’ control system technology makes this control concept flexible, affordable and it allows for fast implementation. The ‘New Generation’ control system technology is based on open interfaces, modular configuration, qualification, as well as scalability. Thus, automating the process would start at the basic control level and then the described PAT principles would be applied (Figure 1, Panel 1). The more we understand our process, the more we can increase the level of automation to support the increased understanding. Automating a full batch process to start the project, it was felt, would result in a lot of re-work as the project progressed and process idiosyncrasies were better understood.
The case study
Figure 3 shows at a very high-level, the process flow for a newly implemented process at our facility. This process is the basis of our case study on PAT and scalable automation. The process flow is typical of biotherapeutics facilities and consists of numerous discrete steps, including dissolution, filtration, chromatography, ultrafiltration/diafiltration (UF/DF), nanofiltration, followed by formulation, filling and freeze drying. The chromatography and UF/DF skids comprise the heart of our process. In addition, there are numerous vessels, tanks, pH adjustment carts and Temperature Control Modules (TCMs) that we combined in the ‘balance of process’ environment. Two other vital components in the process are the CIP system and the WFI system. The CIP system, like chromatography and the UF/DF, is typically a skid-based system. The WFI system is probably the most crucial ancillary system in the process. WFI is utilised approximately 50 per cent of the time in the overall production process.
During normal production, data is collected at each step in the process and the results of each step are critical for normal sequential processing of the product. The chromatography and UF/DF skids (as with the CIP skids) are all typically automated in their operation and are controlled locally with local operator interfaces. The conventional approach until now has been to buy chromatography, UF/DF and CIP skids from different vendors usually with proprietary and differently configured/documented control systems installed on each skid. Besides lending itself to arduous data collection, communication (also referred to as ‘handshaking’) between the skids for optimal operation and process control is a huge and often costly challenge. Furthermore, understanding and reducing variability in the overall process became very difficult with so many different control platforms controlling the same process. In addition, the installation of skids from different vendors with individual control solutions would result in multiple, different operator interfaces (graphics design, colour codes, alarm handling/messages, commands and logins). We consider this a serious challenge for our production operators who have to operate multiple skids, control the non-skid related balance of process environment and interact with the utilities systems. Different operator interfaces not only cause inefficiencies, but can develop into a main source of operator errors.
Comparison of automation concepts
When we were tasked to develop the automation concept for our case study, we used the model of the Automation Pyramid to assess the different approaches available to us. For this article the two most extreme approaches to bioprocess automation will be discussed. As previously explained, pharmaceutical and bioprocess facilities usually consist of an assembly of skids from different vendors set in a process environment that supplies utilities, process aids, storage and cleaning. In Figure 4 automation concepts for the same process utilising skids from different manufacturers that are set in a process environment are compared. In the ‘islands of automation’ concept on the left of Figure 4, the option of having individual automation solutions for the skids and the environment is analysed. The skids are not interfaced with each other and have individual operator interfaces. The scalable automation concept on the right of Figure 4 presents the solution we selected for our case study. We worked with our skid manufacturers and system integrators to implement their automation and expertise on the same ‘new generation’ control system platform. Thanks to inherent scalability, modular approach and ease of configuration, these control solutions are also attractive to the skid manufacturers. In this concept we have individual skids that can be developed and tested stand-alone. Later on they can be applied to the process and play in concert with each other (imagine the ‘plug and play concept’ from your home and office computer world). Skid manufactures and integrators are required to utilise standardised and pre-qualified configuration modules, as well as to adhere to the same configuration rules (such as graphic standards).
Figure 4 uses the automation pyramid to compare both solutions layer by layer.
Automation concepts and PAT
Based on the comparison in Figure 4, the advantages of automating the entire process on one scalable control system platform became apparent to us. Not only for one skid, but across the entire process, scalable automation does the following:
- Fulfills the need to effectively access all sources of variability
- Provides a method to monitor the CQAs in a common format
- Provides a clear relation of data to the batch and process step information
- Allows for handshaking and interlocking between skids as well as common process and utilities systems
- These characteristics are imperative to enhance the PAT effort
The ‘islands of automation’ method of control system infrastructure (as depicted on the left in Figure 4) makes each one of the above mentioned characteristics complex on many accounts. It is difficult to collect and exchange data from five skids and supporting infrastructure systems. Once available, correlation of data becomes a huge challenge. Batch data are usually unavailable for the entire process, and the bottom line is that control is still being carried out with individual and non-interfaced control systems. So the final element of PAT, being control, based on real-time measurements to provide real time quality assurance, becomes difficult to implement.
Trending across an entire batch becomes possible if a centralised historian for data collection is added, but philosophies such as model predictive control are difficult to realise since the effects of one process step can rarely be correlated with another process step down the line.
After all these considerations including a total cost of ownership analysis, it was decided to implement the centralised and scalable automation approach. This lends itself very effectively to the PAT concept. Having installed all skids, the production equipment and the critical utilities systems on the same control system platform, we are able to do the following:
- Obtain all the process relevant data via one common interface
- Collect multiple pieces of real-time data to develop reports and even models
- Report on multiple batches using one common reporting engine
- Handle deviations from the process specifications in a timely manner
The last facet is achieved due to the fact that skids across the process have all the relevant information with regard to the entire process, as opposed to just operating with information regarding their own skid. With all systems on one common automation platform, we were truly able to lay the framework for deploying the entire breadth of PAT and begin to understand our process from an holistic standpoint.
Implementing the concept of scalable automation enabled us to install the framework for automation and PAT. This framework best provides information and tools to increase our process understanding. Since the expectation was to use data from the control system for process decisions and release of product, we ensured that the control system met all requisite Part 11 requirements.
With the scalable automation concept in place, we parsed our process into smaller more manageable sub-systems and deployed PAT principles on sub-systems when the opportunity presented itself. One such sub-system that benefited from the centralised automation concept and PAT principles was the WFI sub-system.
WFI example
Our site uses WFI as a solvent in processing its products, as a solvent in equipment and system cleaning processes, and as a significant component of many of its products (the product being considered for our case study is roughly 90 per cent water). A WFI system at our site is structured so that there is a centralised WFI generation with main distribution tanks, which then feed intermediate production, sub-distribution tanks. The intermediate production, sub-distribution tanks store WFI until production actually requires it. At that time, the main distribution loop starts re-feeding the intermediate sub-distribution tanks.
The requirements for WFI systems are set forth in the major pharmacopoeias: United States Pharmacopeia (USP), European Pharmacopoeia (EP) and Japanese Pharmacopoeia (JP). Figure 5 shows a still and main distribution tank that feed a utilities sub-distribution tank, which in turn feeds a production intermediate, sub-distribution tank. Production at our site uses water by opening and closing the valves into the main process. For the sake of illustration, we have just concentrated on one chromatography system and a UF/DF system, but the same process applies to most of the skids in the process.
WFI example –‘Non-PAT’ approach
Before we illustrate PAT and scalable automation applied to the WFI systems using centralised automation, we will take a look at the operation of the WFI systems without the application of PAT utilising the ‘islands of automation’ concept (WFI control system different from the skid control system). When production wants WFI, the production operator would have to confirm with the utilities operator whether WFI is available for use or not. Electronic requests via serial links or hardwired signals back and forth are options; however, both are susceptible to failure and are costly in a validated environment.
Upon receiving a request for WFI, the utilities operator would ensure that the critical parameters were within specifications and return production’s request, allowing them to use WFI. Production would then open the valve and use WFI for processing.
Among the major problems with this approach, a few in particular stand out: (1) The major problem is that if any Critical Quality Attributes go out of specification during production usage, there is no way for the production control system to take action until the operator manually stops the WFI flow into the process. In essence, there is no real time quality assurance; (2) Secondly, since the other skids are oblivious to the interactions of this skid with the utilities, there is no room for any sort of predictive control to occur.
WFI example with PAT and automation concept in place
Revisiting the WFI example from a PAT perspective, we started the deployment of the bandwidth of PAT at the first level – the identification of the CQAs. In the case of WFI, we utilised USP standards for chemistry and determined TOC, conductivity and return temperature as critical attributes that required monitoring. The next step was identifying where these measurements needed to be made to ensure sufficient WFI monitoring. Considering line sizes, system dynamics, etc., we placed online analysers (TOC and conductivity) at the returns of all tanks and loops. Figure 6 shows the placement of the analysers.
The next step was to monitor the analysers. Signals from the TOC and conductivity analysers were sent back to the utilities controller (note that the utilities and production DCS are now on the same platform). The signals in this example were 4-20 mA signals; however, the control system is compatible with all of the latest bus (i.e., fieldbus, profibus, etc.) technologies that could have been deployed. Alarm limits were set in the control system at values at or below the ‘out of tolerance’ limits. The alarms were identified as ‘GMP critical alarms’ and any out of tolerance alarm was reported in an integrated reporting package. Here, it is important to note that we relied on at least two years of operating experience with these online analysers (particularly TOC), before we began to completely rely on them for process decisions (e.g., automated interlocks and reduced sampling).
When production required WFI, a recipe parameter requests it from the utilities controller. Once the controller determines that conductivity, TOC and return temperature (the CQAs for the utilities systems) are within acceptable limits, it returns another recipe parameter to the production controller allowing it to open the valve and the production valve opens.
For example, if TOC exceeds the acceptable limits, interlocks automatically close the production valves and prevent production from using WFI. Real-time quality assurance of WFI is maintained throughout the entire production process. In addition, the other skids can take mitigative action to account for any deviations from the standard values.
The centralised automation concept also supports the generation of QA relevant reports, ad-hoc reports and offline analyses for the entire WFI system. This achieves the final aspect of the PAT idea – wherein we identify, monitor, control and report the CQAs.
The benefits of this approach of the WFI example, in our case, include:
- Real-time quality assurance with the constant monitoring of the CQAs
- WFI management is electronic. Online totalisers allow utilities to send WFI to its most critical users with advanced predictive information on how much will be needed for that phase of the recipe
- Strong reporting components allow for multivariate analysis
- Reduced manual testing. TOC and conductivity no longer requires daily testing due to constant monitoring of the centralised control system. This also eliminates the possibility of manual errors that occur during the processing of laboratory samples
The described online WFI monitoring and control provide the highest degree of assurance that WFI contamination does not impact production. In addition, we were able to cut our QC costs by replacing conductivity and TOC related manual chemistry testing.
The centralised and scalable automation concept provides the required infrastructure for the PAT based paradigm shift of our WFI utilisation philosophy. All the I/O in the centralised automation approach is wired directly to the new generation control systems with an integrated historian and reporting packages. All systems work in a virtual, shared network in such a way that data from all skids is available on a common platform. The centralised control system controls the entire process and facilitates the comparison of critical data from all skid-based systems on one platform. So now, all the skid information is available and if a critical parameter for WFI would trend toward an unacceptable limit, valves could be proactively shut off to mitigate the risk of contamination.
Another benefit of this approach was that using this example, we were able to implement PAT into the site in a phased manner with a quick-win and thereby build management confidence. Other opportunities such as rapid micro and real-time endotoxin analysers are under evaluation that would further improve the quality assurance of WFI. The important point here is that as analyser technology proves itself on site, we add it onto the centralised control system – thereby quality critical data is available on one control system, which facilitates easier deployment of the ‘control’ aspect of PAT.
Fingerprinting of golden batches
Within the scope of our case study, we were able to deploy an online reporting tool that provides a real-time comparison of parameters over multiple batches, also referred to as the fingerprinting of ‘golden batches’. It allows us to compare data with respect to time, process step or batch-ID over multiple batches, which greatly facilitates process monitoring and understanding. This reporting application fully utilises the centralised automation infrastructure previously discussed.
Our interpretation of a ‘golden batch’ is no different than the one shared by the rest of the industry – we considered a golden batch to be one that performs ideally with respect to cycle times, yield and quality. Our goal is to identify characteristics of this golden batch and control the parameters of interest so they fit the values of the golden batch. To truly understand all the dynamics of our process, we need to compare parameters over time, from batch to batch and then correlate these parameters with other parameters to analyse the various interactions in our process. Having a centralised automation concept gives us a strategic advantage in achieving this goal; in that we have information regarding all the parameters in one repository – the centralised historian. What we needed to do was find an effective way to utilise the data to help us understand the causes of variability in our process.
The tool we deployed sits on top of the historian and has access to all the batch and continuous data. The tool is a user-configurable tool that allows a user with appropriate privileges to select the points or the CQAs that the user wants to trend and compare. After navigating a few setup screens, it allows the user to select the batches of interest for comparison.
The user can drill down to the phase and unit level granularity if a particular CQA needs to be compared from one phase to the next phase (Figure 7). The net result is that a user can now obtain trends for that particular CQA across various batches/phases/units. The user can then compare this CQA with other CQAs to determine statistical correlations and obtain a greater understanding of the process. Once the process is better understood, the process can be automated to be controlled at the characteristics of the golden or ideal batch. Using this tool and the fact that all the data can be overlaid via one reporting engine, sources of variability can be understood and PAT implementation is further enhanced.
Conclusion
PAT promises to deliver a new culture to the pharmaceutical industry – a culture of innovation. Automation deployment needs to support this FDA encouraged effort by providing an infrastructure that fosters integrated data management and data analysis abilities across the entire process. This leads to improved process understanding, which in return allows for the implementation of additional automation and PAT functions where it is determined to be most beneficial for product safety and yield. The presented concept of scalable automation enables an efficient addition of these automation and PAT functions throughout the entire lifecycle of the facility.
The presented WFI example shows that the application of PAT and automation leads to increased product safety and efficiency. The ‘fingerprinting of golden batches’ example gives an exciting outlook on what the potential of today’s PAT and automation tools can provide us with.
This article not only focuses on the need to have a sufficient automation structure in place, it also emphasises the importance of defining and following a structured PAT approach. The FDA guideline on PAT describes a broad framework that allows pharmaceutical and biotech companies to define their approach to PAT considering their product and process characteristics, as well as their infrastructure and organisation. This article is written as a case study describing approaches and examples that have worked best for our needs at Talecris. As it is true for the entire pharmaceutical and biotech industry, PAT at our company is still in the process of being defined and structured with some very encouraging and real value-adding results.
_________________________________________________________________________________
Panel 1: Proposed steps to a PAT implementation
- Identify: this step includes the process of identifying an opportunity that would benefit from the PAT approach, as well as identifying the critical quality attributes that need to be monitored and controlled in the process. For a WFI system that may be Total Organic Carbon (TOC) and conductivity; for a chromatography process, it may be pH. Essentially, this process details the critical control points that directly impact product efficacy or quality.
- Monitor: the next step after identifying the critical quality attributes would be to monitor them. Monitoring is usually achieved using on-line instruments. Recent advances in on-line analytical instrumentation have encouraged more online monitoring of parameters of interest. The simple premise is that we cannot control something we cannot monitor. The monitoring step allows us to collect data for the CQA of interest and evaluate the effect of adjusting the CQA on the overall process efficacy.
- Analyse: the analysis step ensures that once we have identified our critical quality points and monitored them, we employ statistical analysis to determine how the critical quality attribute is related to the overall process efficacy. This step includes the development, verification and validation of any statistical models that could define the process. Experimental studies, engineering test plans and retrospective data analysis are methods that we employ to analyse the CQA relationship to the overall process.
- Control: after we have analysed the relationship between the CQA and overall process efficacy and developed any statistical models, the next step in the PAT effort would be to control the process to ensure that the CQA is within specified limits at all times. This is the most critical step of the PAT roadmap that essentially ensures that ‘real-time’ quality assurance is met.
- Report: the last step in the PAT implementation framework in our model is a reporting element. The reporting element encompasses any tools that aid in assuring that the process was in fact in control throughout the processing period. Reporting tools serve two purposes – they allow for data to be reported in a fashion that aids in developing process understanding, and they allow for any exceptions from the ‘ideal state’ to be documented in the final release records.
_________________________________________________________________________________
Abbreviations
CIP Clean-In-Place
CQA Critical Quality Attribute
EP European Pharmacopoeia
ERP Enterprise Resource Planning
JP Japanese Pharmacopoeia
MES Manufacturing Execution System
PAT Process Analytical Technology
TOC Total Organic Carbon
UF/DF Ultrafiltration/Diafiltration
USP United States Pharmacopoeia
WFI Water For Injection
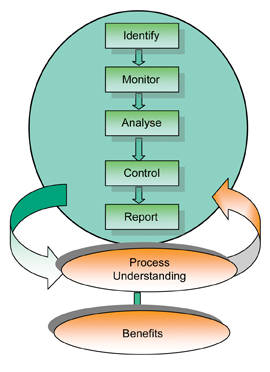

Figure1: PAT model for the Talecris Clayton Site
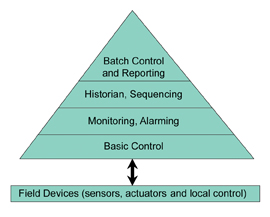

Figure2: Automation Pyramid
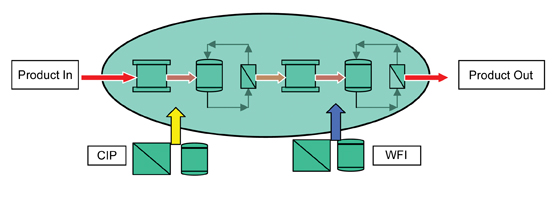

Figure 3: Process flow for new biological process
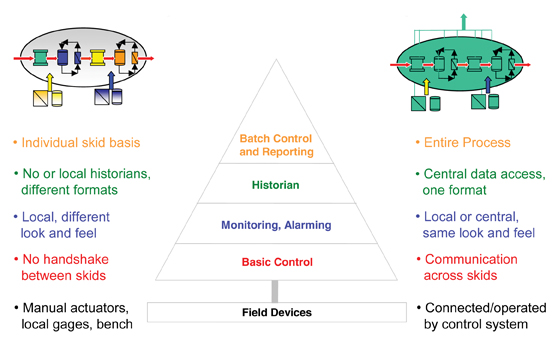

Figure 4: Comparison of automation concepts for new process
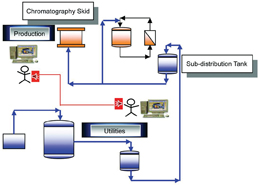

Figure 5: WFI system on site without PAT
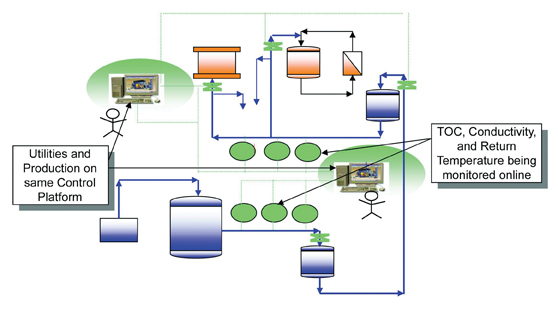

Figure 6: WFI example with PAT in place
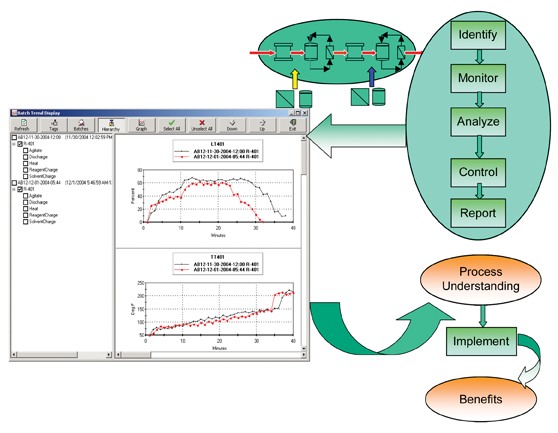

Figure 7: Fingerprinting of batches
References
- Talecris Biotherapeutics operates one of the largest sites dedicated to products that are derived from human blood plasma.
- FDA, “Guidance for Industry: PAT – A Framework for Innovation Pharmaceutical Development, Manufacturing and Quality Assurance,” Center of Drug Evaluation and Research, Food and Drug Administration.
- FDA, “Pharmaceutical cGMPs for the 21st Century: A Risk-Based Approach,” http://www.fda.gov/cder/gmp/index.htm.
- Cohen, Nissan, “Validation of a Water System for the 21st Century,” Pharmaceutical Engineering, July/August 1999.
Acknowledgement
Reprinted from the January/February 2006 issue of Pharmaceutical Engineering


