Real-time PCR gene expression profiling
Posted: 25 January 2007 | | No comments yet
Real-time PCR has rapidly become the preferred technique for quantitative analysis of nucleic acids. Its superior sensitivity, reproducibility and dynamic range make it the preferred choice for expression profiling in scientific, as well as routine, applications.
Real-time PCR has rapidly become the preferred technique for quantitative analysis of nucleic acids. Its superior sensitivity, reproducibility and dynamic range make it the preferred choice for expression profiling in scientific, as well as routine, applications.
Real-time PCR has rapidly become the preferred technique for quantitative analysis of nucleic acids. Its superior sensitivity, reproducibility and dynamic range make it the preferred choice for expression profiling in scientific, as well as routine, applications.1
Initially, most real-time PCR studies targeted a single gene of interest, whose expression reflects the state of disease, response to a drug or a change in the environment and the like. However, most biological phenomena are complex and cannot be described by the expression of individual genes. Instead expression profiles must be measured and interpreted. Traditionally this has been done using microarray techniques,2 but the development of high throughput platforms opens up the possibility of using the more sensitive and cost efficient real-time PCR technology.
In gene expression profiling, the expression of many genes is measured in many samples. The genes are selected based on prior knowledge about their function (and often exploratory microarray studies) to be informative in respect to the studied condition. The data are then analysed to identify genes or samples with similar expressions. A few powerful biostatistical methods are available to find these similarities. Principal Components Analysis (PCA), Hierarchical clustering and Kononen Self Organizing Maps (SOM) are some of the most powerful. This article will outline an expression profiling experiment, pre-processing and scaling of the data in order to identify genes that have common regulations and samples that show the same expression patterns. Our example is a study of the early development of the African claw frog, Xenopus laevis.
The expression of 16 genes was measured in 16 stages of development, ranging from the oocyte to the tadpole. All samples were measured in biological replicates and the RNA was extracted, reverse transcribed and analysed by real-time PCR as described previously.1,3 For each reaction a CT value was registered.
There are two complications in this study, which are not uncommon in expression profiling. Firstly, many genes have virtually no expression in some of the stages, resulting in off-scale measurements. Secondly, there are no suitable reference genes for normalisation of the data because all Xenopus genes studied in any detail so far show variations in expression levels during development.3 These are addressed in the pre-processing of the data.
Pre-processing of real-time PCR data for expression profiling has been described in detail before1 and excellent on-line tutorials are available (www.multid.se). For the present data the level of detection (LOD), which is the highest CT value observed for a positive signal, was 30 and all CT values above 30 were set to 30. Setting off-scale values to 31 instead did not make any difference. A PCR efficiency of 90 per cent was assumed for all assays and the data were normalised to the total amount of RNA in the samples. No normalisation with reference genes was performed. The CT values were converted to relative quantities and then converted to log2 scale. Finally the data were mean centred or autoscaled. Mean center data is subtracting the mean expression of each gene. It removes the influence of overall expression levels in the classification, while maintaining the magnitudes of the changes. Autoscaling is mean centred followed by division with the standard deviation of the expression of each gene. This removes the influence of both the expression level and the magnitudes of the changes and gives rise to classification based on the relative changes in expression. All pre-processing and subsequent scaling of the real-time PCR data was performed using GenEx from MultiD (www.multid.se).
The expression of activin, Xbra, cerberus, chordin, derriere, dishevelled, follistatin, goosecoid, GSK3, HNF-3beta, N-CAM, p53, siamois, VegT, Vg1 and Xnot was measured in the Xenopus developmental stages 1, 2, 4, 5, 6-7, 8-9, 11, 15, 17, 18-19, 21, 28, 32, 35-36, 41 and 44 assigned according to Nieuwkoop and Faber.4 2-4 biological replicates were performed on each sample giving a total of 39 expression measurements in 16 developmental stages. The data were classified by PCA, Hierarchical clustering and the SOM.
Principal Component Analysis
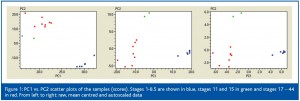
The first multivariate method to be applied should be PCA.5 Briefly, the principal components (PCs) are linear combinations of the original genes and samples defining a space of lower dimensionality in which the data can be visualised in scatter plots. PC1 vs. PC2 scatter plots of the stages (the ‘scores’) are shown in Figure 1. From left to right the data are unscaled, mean centered and autoscaled data. Three groups separate well in all scatter plots, although they are more differentiated for mean centred and autoscaled data. Xenopus laevis has very little transcription in the early stages of development and proteins are produced from translation of maternal mRNAs present in the oocyte. Transcription is initiated during a process called the mid-blastula transition (MBT). The three clusters we see in the PC1 vs. PC2 plot (Figure 1) should therefore represent the early or pre-MBT stage, the MBT and the late post-MBT stage. Among the blue stages we see that five are tightly clustered, while 8.5 is off from the group’s centre. This suggests the latter has begun to differentiate into MBT.
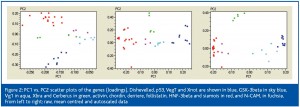
Figure 2 shows PC1 vs. PC2 scatter plots for the genes (the ‘loadings’) based on unscaled, mean centred and autoscaled data. The genes indicated in red and blue separate in all three scatter plots, showing that they are expressed at different stages during development. The genes indicated by green colour cluster more clearly in the autoscaled plot, suggesting that they have the same expression profiles.
The biological replicates of Vg1 (cyan) and GSK-3beta (sky blue) separate from other genes in all plots. In the scatter plot of autoscaled data Vg1 and GSK-3beta are close to the genes in blue colour suggesting they have a similar expression profile. Likewise, N-CAM (fuchsia) has a similar profile to the genes in red.
We can identify genes critical for the different developmental stages by inspecting the scores and the loadings. The loadings are the contributions from the genes to the principal components and the scores are the contributions from the samples. The larger the loading, the more important the gene for a particular PC is; and the larger the score, the more important the sample is. Since the best PCA separation of the genes is obtained for the autoscaled data, let us inspect the corresponding loadings. In the loadings plot we see that all genes labeled bluish have positive PC1 values (Figure 2) and stages 1-8.5 have positive PC1 scores (Figure 1). Hence, Dishevelled, p53, VegT, Xnot, GSK-3beta and Vg1 are predominantly expressed during the early stages of development. The genes labeled reddish have negative PC1 loadings (Figure 2) and stages 17-44 have negative PC1 scores (Figure 1). Hence, activin, chordin, derriere, follistatin, HNF-3beta and N-CAM are expressed predominately during the late stages of development. Xbra and Cerberus (green) have positive PC2 loadings (Figure 2) and stages 11 and 15 have positive PC2 scores. Hence, Xbra and Cerberus are expressed during the mid blastula transition.
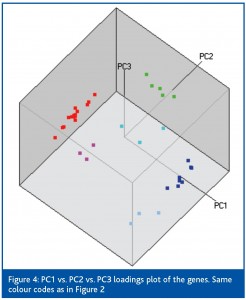
The PC1 vs. PC2 plots show the samples and the genes in a reduced space of 2-dimensions. Although the space is optimised for information, some is missing. The amount of information (technically, the amount of explained variance) contained in a PC1 vs. PC2 scatter plot is obtained from the eigen values. For the unscaled, mean centred and autoscaled data it is 96%, 90% and 77%. The amount of information decreases with increasing degree of scaling. More information is represented when using raw data, but the information is biased to the more expressed and variable genes. Using the autoscaled data 23% of the information is missing. This is not necessarily a concern because the missing information has low correlation, since the importance of the PCs decreases with increasing index. Still, if more information is needed it can be shown in a PC1 vs. PC2 vs. PC3 scatterplot (Figure 4). This plot accounts for 85% of the information in the data and reveals subgroups in two of the original three groups.
Cluster analysis
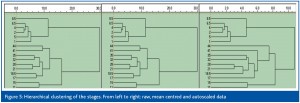
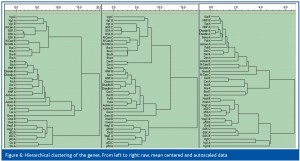
The data were also classified by hierarchical cluster analysis using the unweighted pair method and the Euclidean distance.6 Results obtained using raw, mean centred and autoscaled data are shown in Figure 5 (samples) and Figure 6 (genes). The dendrograms obtained from raw and mean centred data are identical, since mean centring does not change the relative distances between sample points in a multidimensional expression space. The dendrogram of the autoscaled data is different but has the same main features. Stages 1-8.5 form a group, where stages 1-6.5 are very similar. Stages 11 and 15 form the second group and stages 17-44 a third. Clustering of the genes is influenced only slightly by mean centring, while autoscaling has a larger effect (Figure 6). Still, the clusters reveal the same groups as found by the PCA.
Self-organising map
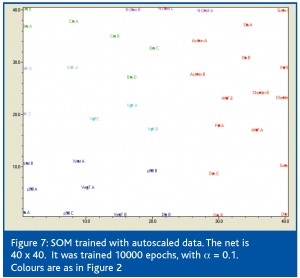
Finally, a rather new methodology was used to verify the findings above. It is based on a branch of mathematical techniques that do not require formal equations, but use rules to organise the data through a series of random events. One such technique is the Kohonen’s self-organising map (SOM).7 An example of a SOM based on the autoscaled data is shown in Figure 7. It clearly separates the six groups of genes supporting the conclusion that they have distinct expression profiles.
Acknowledgements
MK acknowledges a grant from the Spanish Ministry of Education and Science (SAB2005-0162). Part of this project was supported by the Carl Trygger foundation, European FP6 project SMARTHEALTH (FP6-2004-IST-NMP-2-016817), the grant agency of the AS CR no. B500520601 and by the project no. AVOZ 50520514 awarded by the AS CR.







References
- The Real-Time Polymerase Chain Reaction, M. Kubista, J.M. Andrade, M. Bengtsson, A. Forootan, J. Jonak, K. Lind, R. Sindelka, R. Sjöback, B. Sjögreen, L. Strömbom, A. Ståhlberg, N. Zoric, Molecular Aspects of Medicine (2006) 27, 95-125
- Editorial, NATURE BIOTECHNOLOGY VOLUME 24 NUMBER 9 SEPTEMBER 2006, 1039.
- Developmental expression profiles of Xenopus laevis reference genes. Sindelka R, Ferjentsik Z, Jonak J.,Dev Dyn. 2006 Mar;235(3):754-8.
- Normal table of Xenopus laevis. Nieuwkoop PD and Faber J. 1994. Garland Publishing, Inc. New York & London
- Principal Component Analysis, Jolliffe I. T., Series: Springer Series in Statistics. 2nd ed., 2002 (ISBN: 978-0-387-95442-4)
- Andrew Moore: “K-means and Hierarchical Clustering – Tutorial Slides”: http://www.autonlab.org/tutorials/kmeans.html
- Self-Organizing Maps. Teuvo Kohonen, Series: Springer Series in Information Sciences Vol. 30, 3rd ed., 2001, (ISBN: 978-3-540-67921-9)


