

High content cell based primary screening for oncology targets – a perspective
Posted: 25 June 2010 |
Over the last 15 years, vendors have offered microscope-based instruments capable of producing images of fluorescent labelled components of cells grown in microtitre plates. These instruments are typically bundled with analysis software capable of defining the relative distribution of several fluorescent markers on a cell by cell basis1,2. As the readers have improved and image acquisition and analysis times have reduced, the potential for screening larger compound libraries has presented itself. High Content Screening (HCS) i.e. the generation of multiparameter data from a single well, has thus become an important tool in the High-Throughput Screening (HTS) laboratory.
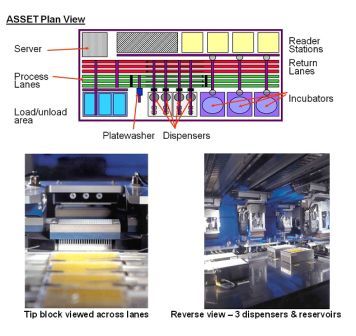
Figure 1 ASSET™ plan and detail Copyright: The Automation Partnership
Over the last 15 years, vendors have offered microscope-based instruments capable of producing images of fluorescent labelled components of cells grown in microtitre plates. These instruments are typically bundled with analysis software capable of defining the relative distribution of several fluorescent markers on a cell by cell basis1,2. As the readers have improved and image acquisition and analysis times have reduced, the potential for screening larger compound libraries has presented itself. High Content Screening (HCS) i.e. the generation of multiparameter data from a single well, has thus become an important tool in the High-Throughput Screening (HTS) laboratory.
Here we describe experiences and outcomes of several HCS/HTS campaigns, developed by the HTS Group in Cancer & Infection at Alderley Park UK. This has included adapting the assays for HTS, primary screening of up to one million compounds and follow-up of several thousand concentration response curves. The practicalities of generating and imaging hundreds of assay plates per run, and the logistics involved in data storage and analysis were significant challenges to overcome.
The assays described include three different detection technologies, a Transfluor® assay3, two labelled antibody detection systems and a Redistribution® assay. Each was developed to be fit for purpose for primary HTS and concentration response follow up of HTS hits.
The assays were adapted to be run on an ASSET™ automation platform. The large multifunctional systems from The Automation Partnership (TAP) have a capacity of up to 280 x 384 well plates per run and are able to pipette up to eight reagents. Nine plate transfer robots, three incubators, dual stream barcode tracking and a plate washer (essential for staining/fixing of cells) are available. The plates are treated as a stream, and are thus processed identically in terms of timings within a run. Test compounds are supplied in a second stream of plates for dilution and addition to cells growing in the assay plates. Tracking of plate contents by barcode is essential. Although under negative pressure, the automation is not a Class 2 containment environment, and test compounds are not sterile.
Imaging was performed in each case using the GE Healthcare IN Cell Analyzer 3000™ – either the Alpha preproduction model, or for the later screens, the production instrument.
As HCS assays and cell labelling typically take place over several days, followed by imaging and analysis, screening campaigns may take several weeks or months to complete. Consistent cell production is essential. Initially, at AstraZeneca Alderley Park, this relied heavily on the skills of the cell culture staff. More recently, the ability to obtain many cell lines from cryopreserved banks has simplified culture work for HTS, and reduced batch variation in cell characteristics and behaviour.
Due to the time taken to image plates (a run of 200 plates would be split into four imaging runs over at least four days), all assays were fixed during the assay build. Each run generated a data file of ~ 100 GB, which was downloaded and stored for a minimum of two years. The imaging platform was not integrated into the automation used to build the assay.
Figure 1 ASSET™ plan and detail Copyright: The Automation Partnership
Campaign 1 – GPCR
The target, the first HCS-HTS which the group took on and screened in 2002-2003, is a GPCR with high affinity for its endogenous agonist. A Transfluor® (Molecular Devices) modified osteosarcoma (U2OS) cell line was purchased. This line over-expressed the receptor, and also expressed Green Fluorescent Protein (GFP) – tagged B-arrestin. In the resting state, GFP is uniformly distributed in the cytoplasm. On addition of agonist, receptor stimulation is followed by formation of membrane pits and endosomes, in which the GFP-B-arrestin is concentrated, appearing as bright granules, which can be imaged and counted. DRAQ5™4 was used as a nuclear counterstain (Figure 2 ).

Figure 2 Transfluor® GPCR in cell imaging. Detail of images in the absence (left) and presence (right) of agonist. These images represent approximately 1/100 of the full image field. In the lower panels, bitmaps illustrate the granularity analysis
A number of issues were encountered during the development of this assay into a primary screen capable of >100,000 wells/ experiment. For optimum performance, the IN Cell Analyzer required a thick bottomed plate, glass bottomed plates giving optimum image quality. In these early days of HCS, plate production issues caused some setbacks. One plate type attached the glass bottom with a cytotoxic glue, another observation was that formalin fixation of a single well can diffuse over a radius of up to six wells of a 384 well plate.
Bulk supplies of the U2OS cells were generated by continuous culture, being pipetted into the plates from a recirculating reservoir. Reducing cell number over the course of a screen run resulted from the cells settling out of suspension, a problem overcome by modification of the reservoir to double the recirculation rate. The cells proved robust, with no significant reduction in viability.
The assay build took 21 steps over two days (Figure 3), and was the first demon – stration of the ability to concurrently track compound and assay plate barcodes. Imaging of each run took approximately one week, the signal proving stable over this period.

Image analysis was performed using the granulation algorithm from GE’s Raven suite. Cell nuclei were defined as objects by intensity, contrast and size filters in the red (DRAQ5™) channel, granules by similar filters in the green (GFP) channel. Granules within a defined proximity to a nucleus are counted. The primary output parameter (Fgrain) indicates the total granule related fluorescence in each image. Supplementary parameters indicating the number of cells/image and the average number of grains/cell were also recorded.
A counterscreen was also available in the form of a Transfluor® cell line expressing the B-adrenergic receptor (Badr) with an identical granulation response. A cascade including two FLIPR® assays at our Advanced Science & Technology Laboratory (ASTL) was established to take initial hits to validated potential leads (Figure 4).
Two lead series were successfully derived from the HTS output.

Figure 4 Attrition of test compounds through primary assay, followed by Transfluor® and FLIPR® counterscreens
Campaign 2 – inhibition of a Receptor Tyrosine Kinase (RTK) activity
In this second example screen, the target was a transmembrane tyrosine kinase receptor, which displays raised levels in several cancer cell lines, associated with oncogenesis and suppressed apoptosis. A previous screening campaign using a biochemical assay had not led to success in lead optimisation, so an alternative, cell imaging-based approach was initiated. Receptor activation leads to autophosphorylation. The phosphorylated receptor was tagged using an Alexa Fluor® 488 fluorescent antibody, thus the intensity of the fluorescent signal was proportional to receptor activation (Figure 5).
Mouse fibroblasts isolated from knock-out mice were transfected with a human RTK construct. The resolution of the IN Cell Analyzer showed that the population was mixed. Following clonal selection, a 100 per cent responding population was achieved, although at high densities target expression appeared to shut down in some cells. Cells were supplied from continuous culture with a limit on passage number. They did not grow well on glass bottomed plates, and the spindle-like morph – ology meant that signal could only be reliably measured within the DRAQ5™ defined nuclear marker. Cells did not prove amenable to delivery into assay plates using the automated method used previously, or SelecT™ tissue culture automation. An offline method employing Multidrop™ dispensers (Thermo Scientific) in a class 2 cabinet was used.
The initial protocol required plating in growth medium, then replacement with serum free medium. It became apparent that the aspiration and washing steps introduced bacterial contamination. The method was modified to reduce the serum in the medium, and increase the time for the cells to adhere and proliferate.
Z’ derived using a single image per well was inadequate to support a reliable HTS. Signal thresholding and a percentage responder parameter for the primary screen proved to be more robust. This parameter gave an acceptable Z’ of >0.5 but a steep curve for standard compounds, while object intensity gave an acceptable slope but low Z’. The decision was made to run follow up concentration responses taking four images/well to increase the population and the reliability of the object intensity parameter.
The 23 step assay was run over four days to generate 200 plates, which were mostly imaged on site. Imaging and analysis took place over a further four days. Cells were given 36 hours to adhere and proliferate, the automation process being similar to that described above, with the addition of permeabilisation, blocking and secondary antibody steps.
It became apparent that even after formalin fixation, in 4°C storage in the dark, and under PBS, the green staining began to appear punctuate due to aggregation of the antibody complex. Data quality deteriorated significantly, thus plates were imaged within five days of fixing.
A library of 700,000 samples was screened, with 16,000 samples chosen for 4-point duplicate concentration response.
The project was able to derive two potent series which have developed into interesting lead series. Thus, the cell imaging screen was much more effort than the previous biochemical approach, but had more impact.

Figure 5 IN Cell Analyzer™ images of mouse fibroblasts expressing human RTK. DRAQ5™ nucleus stain in red channel, Alexa Fluor® 488 tagged anti-phospho RTK. These images represent 25 per cent of the full image field
Campaign 3 – kinase pathway
To support interest in the kinase signalling pathways, the BioImage Redistribution® Forkhead (FKHR, OXO1A) translocation assay was proposed as a potential HTS. The U2OS derived cell line is available commercially from Thermo Scientific. The cells express GFP tagged FKHR, which is distributed on the cytoplasm of resting cells. Inhibition of the kinase signalling pathway results in trans – location of FKHR into the nucleus.
Our aims were to establish the assay in 384 well format, investigate the potential for cryopreserved cell supply, reduce the serum concentration and investigate ways of adding value to the assay output.
Corning thick bottomed plastic imaging plates were compared with glass bottomed plates, and for single well imaging gave acceptable results at low cost.
A reduction in serum concentration from 5.0 per cent to 0.5 per cent was achieved to assuage chemist’s concerns regarding compound protein binding. There was no significant effect on cell number or observed morphology, a modest decrease in assay window and increased sensitivity to reference compound.
The primary output parameter adopted was Log Nuc/Cyt, i.e. the mean of the log of the ratio nucleus intensity/cytoplasmic intensity for each object within the image. Use of the ratio rather than the log value skews the data. A modified algorithm to report this parameter was supplied by BioImage™.
The use of DRAQ5™ to define the cell nuclei enabled bi-colour imaging to take place in a single pass. It also afforded the advantage that a parameter indicating altered cell morphology was derived.
DRAQ5™ stains the nuclei brightly in the red channel, but also picks out the cytoplasm of U2OS at lower intensity, significantly above background (Figure 6). By thresholding, both nucleus and cytoplasm masks are defined using the red channel. The cytoplasmic signal is measured in a defined area around the nucleus. The facility exists to derive the average percentage of the cyto – plasmic measurement ring coincident with the cytoplasm defined by low intensity DRAQ5™ staining. If the test compound induces the cytoplasm to contract, giving a ‘spindly’ appearance, the percentage decreases. We found this parameter (‘Aqility’) a sensitive indicator of cell toxicity in many cases at compound concentrations well below that at which viability was reduced.

Figure 6 U2OS cells exposed to A) 10uM B) 1uM and C) 0.01 uM compound
Cells dispensed using SelecT™ resulted in reduced CV (cell number) and slightly improved assay Z’ values. Cryopreserved cells showed improved levels of GFP expressing cells, and comparable reference compound EC50 values but a slightly lower assay Z’ compared to continuously cultured cells. Cryopreserved, SelecT™ dispensed cells were considered fit for purpose. A consistent Z’ value of approximately 0.7 or above was achieved.
At 12 steps, this assay had fewer steps than the protocols described above.
The assay process had the potential for 100,000 wells per run. However, reference compounds targeting the pathway components of interest showed poor potency in the FKHR translocation assay, potentially indicating redundancy. Consequently, the decision was taken not to initiate the HTS campaign.
Test compound delivery
Imaging assays typically require a cell monolayer established in the absence of test compound. Compound delivery must achieve even distri – bution but cause minimal disruption to the cells. Localised high compound and solvent concentrations must be avoided. Using automated systems, it has been possible to pre-dilute test samples in media and transfer using pipetting/mixing hardware. Recently, non-contact acoustic dispensing instruments have demonstrated the ability to deliver samples in small volumes, with reduced potential for contamination. Physical disruption of the cell layer can occur, but aiming the dispense away from the imaging field can eliminate detrimental effects.
Acoustic dispensers do not match the speed of physical transfers, meaning that plates are out of incubators for extended periods, but investment in multiple instruments and improvements in capacity are bringing this technology successfully into HTS. High quality of dispensing, accuracy of final concentration and volume, and in-line reporting of any errors are proving valuable to HTS QC.
Conclusions and perspectives
Cell based HTS, and in particular assays with an imaging output, present significantly higher risk and challenge when compared to biochemical screens. Historically, in oncology HTS, the cell imaging option tended to be deployed where simpler technologies did not provide a practical screening solution. While many of the principles such as minimising assay steps and combining reagents are common, the requirement to deliver healthy cells, and maintain process to obtain consistent results is critical.
A major step forward in maintaining quality has been offered in recent years in the use of bulk supply directly or with low passage number from cryobanked cells for some assays. This has become a default position, although the need for a clonal, or at least consistent population obviously remains.
We have learned that cycles of assay development and screening are often under – estimated. An imaging assay build may take three to four working days, tying up automation and human resource which could run several biochemical screens in that period. The complicated protocols are often achievable on paper, but stretch automated systems, increasing the risk of losing plates due to faults. To facilitate turnaround of reagents, we have looked for breaks in the process, e.g. completion of the active biology and fixation, then treating the permeabilisation, blocking, staining and washing sequences as a separate process, followed by imaging on a separate system. The relatively long read times of all imagers dictate that resource commitment becomes significant. Future investment needs to overcome this hurdle or embrace the disconnected build/ image process.
Analysis and interrogation of HCS data has to be timely – although we can generate true multiparameter data, demonstrating the added value of parameters predictive of cell loss or changes in morphology, project teams may be reticent to make use of the extra information, without convenient informatics tools.
Our experience gained developing and running HCS-HTS assays, including the examples described above, indicated the advantages of optimising image analysis early on the screening imager, which in the above cases was the In Cell Analyzer 3000. For example, on occasion principal component analysis of data expected to indicate a trans – location event has indicated that object intensity is in fact significantly more indicative of the biological event.
A major issue remains in regard to data retention – a HCS-HTS can generate several terabytes of image data, which is unwieldy to move from the imaging instrument, store and search. What data has to be kept, and for how long? These are questions which many imaging groups are addressing, and a consensus has yet to be achieved. The level of data retention for image or metadata has yet to be challenged by registration authorities.
While there are more convenient options for oncology-based HTS, some of these technologies have not proven robust in delivering lead-like actives to be progressed into lead optimisation. An analysis of different approaches we have adopted at Alderley Park over the last nine years of HTS shows very different success levels through lead generation, depending on primary screening technology adopted. Encouragingly, we have had a very high success rate in providing progressable leads from cell imaging screens, and the hits are by definition active in the cell. The commitment of significant resource and effort has been rewarded, and suggests that more physiologically- relevant oncology screening approaches have the ability to identify the hits which can be successfully translated into leads.
Acknowledgements
This work was completed with the invaluable input of (amongst others) Edward Ainscow, Emma Cooke, Jonathon Ellston, Martina Fitzek, Helen Garside, Annes Lambert, Stephen Peters, James Pilling, Darren Plant, Marian Preston.
References
1. Mouchet E.H. & Simpson P.B. High-content assays in oncology drug discovery: Oppor tunities and challenges. IDrugs 2008 Vol 11 No. 6
2. Korn K, Krausz E: Cell-based high-content screening of small molecule libraries. Curr Opin Chem Biol (2007) 11(5):503-510
3. Oakley, R.H. et.al. The cellular distribution of fluorescently labelled arrestins provides a robust, sensitive, and universal assay for screening G protein-coupled receptors. Assay Drug Dev Technol. 2002 Nov; 1(1 Pt 1):21-30
4. Smith PJ.et.al. Characteristics of a novel deep red/infrared fluorescent cell-permeant DNA probe, DRAQ5™, in intact human cells analyzed by flow cytometry, confocal and multiphoton microscopy. Cytometry. 40(4): 280-91, 2000
About the Authors
Peter Alcock
Peter Alcock is a Senior Scientist in the Cancer Screening and Assay Sciences section within AstraZeneca. With 26 years in drug discovery, Peter has worked in a variety of in vitro and in vivo environments, and has within AstraZeneca’s Alderley Park High Throughput Screening Laboratory had responsibility for running the cell based HCS over the last eight years.
Contact the Author
email: [email protected]
Colin Bath
Colin Bath is a Team Leader in the Cancer Screening and Assay Sciences section within AstraZeneca. He is accountable for both the Biochemical Secondary Screening group and the High Throughput Screening operation. Colin has worked in the drug discovery industry for 25 years and was responsible for the implementation of the automation platforms that supported the recent HCS activities.
Carolyn Blackett
Carolyn Blackett is a Team Leader in the Cancer Screening and Assay Sciences section within AstraZeneca. She is accountable for the High Throughput Screening operation at the Alderley Park site. Having 13 years experience in drug discovery, Carolyn has been responsible for the global delivery of AstraZeneca’s Alderley Park High Throughput Screening Laboratory to five worldwide Cancer & Infection research sites.
Peter Simpson
Peter Simpson is Associate Director of Cancer Bioscience within AstraZeneca. He heads the Screening & Assay Sciences section which consolidates assay development & project screening at the Alderley Park site with delivery of HTS for five global Cancer & Infection research sites. Peter has worked in the drug discovery industry, with an active role in HCS, for 12 years, initially at Merck Sharp & Dohme.
Issue
Related topics
G protein-coupled receptors (GPCRs), HCA (High Content Analysis), HCS (High Content Screening), HTS (High Throughput Screening)
