

The importance of particle size analysis
Posted: 3 January 2018 | Dave Elder, Gene Pacowski, Peter Nelson, Stephen Tindal | 1 comment
Particle size reduction is a fast and cost-effective answer to increasing the exposure of poorly soluble oral drugs by increasing surface area and thereby improving dissolution rate. This approach will only work for DCS IIa1 drugs where dissolution rate is the rate-limiting factor for absorption. This may be applicable to around one-sixth of drugs currently in development.2
PARTICLE size is an important attribute in APIs, solid oral drug products (tablets and capsules – impacting on homogeneity, flow and processing), and as a critical quality attribute in semi-solids (suspensions) and sterile liquid products (injectables). Particle size analysis has become a proxy for routine surface area measurement. However, context is important. Therefore, representative sampling, sample homogeneity and particle morphology are important because of the small sample sizes, potential settling of the sample, etc.
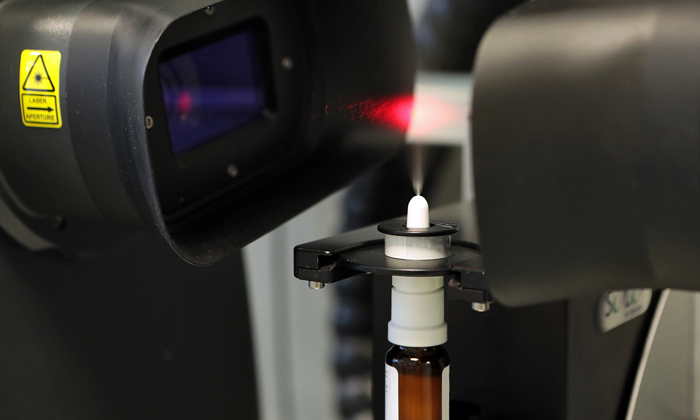
A wide range of techniques are available to determine particle size; however, the most broadly used technique is laser diffraction. Extremely precise and repeatable measurements are attainable, but understanding the limitations of this technique is critical to acquiring meaningful information.
Generating meaningful particle size data starts with representative sampling. All powders will segregate during shipping, handling, and even warehouse storage. Over time, smaller particles in a sample will migrate to the bottom while larger particles will become more concentrated at the top of the container. This applies to analytical sub-samples as well as bulk samples. Although this concept is widely understood, it is often overlooked. Sampling bias may be further compounded with subsequent sub-sampling in the laboratory or elsewhere.
When sampling powders from large bulk containers it is good practice to obtain a sample representing the full height of the powder bed from top to bottom, using a core sampling thief, for example. Sub-samples for analytical testing can then be generated using mixing and dividing techniques such as spin riffling, cone and quartering, or simple rotation/inversion of the lab sample before taking an aliquot for analysis.
Laser measurement techniques and methodology considerations
When developing a size-based method for micronised or milled API, the analyst must determine what they want to measure, eg, the size of discrete or agglomerated particles, or both. A wet dispersion method for discrete particle size measurement typically employs ultrasonication to physically disrupt cohesive particles, and the use of surfactants in the dispersion medium to ensure no re-agglomeration occurs prior to measurement. A dry dispersion method may employ high disperser pressures to ensure separation of discrete particles. Whereas a method intended to assess particle agglomeration may use reduced, or no, sonication to preserve sample agglomerates.
Laser diffraction instruments cannot distinguish between discrete particles and particle aggregates. As such, the importance of a secondary orthogonal confirmatory technique, particularly optical or scanning electron microscopy, to qualitatively evaluate particle size distribution provides important context. The scanning electron micrograph (Figure 1) clearly shows discrete particles of less than approximately 2-3μm in size, which form irregular agglomerates exceeding 100μm in diameter. If left undispersed, these agglomerates would be measured by laser diffraction as >100μm.
Laser diffraction particle size analysers typically present data as a volume-based distribution, whereas imaging techniques often present data in numerical terms. In a volume-based method the overall size distribution is influenced primarily by the largest particles present. This is why D(v,0.9) values – the volume-based level below which 90% of particles were measured and which have the greatest influence on dissolution rate – are so sensitive to subtle changes in milling parameters. Conversely, a number-based distribution is influenced primarily by the smallest and most abundant particles in the sample. In a laser diffraction histogram, identical raw data may be displayed as both a number-based distribution or a volume-based distribution. For example, a hypothetical data set might show 90% of the measured particles as ≤1.0μm in size using a number based distribution; whereas, that same data would be reported as 90% of the measured particles are ≤5.2μm in size using a volume-based distribution.
Furthermore, laser diffraction results are nearly always expressed in terms of ‘equivalent sphere’ diameters, thereby allowing a single numerical value to express the size of a particle. However, where particles deviate from the ideal spherical habit, laser diffraction data provides no insight into particle shape. A needle-like particle having a length of 100μm, for example, may have an equivalent sphere diameter of only 5μm. If particle shape is important to API or formulation performance, this critical information is lost without a secondary orthogonal analytical method. In addition, measurement of particle size of API in a formulated product becomes very challenging.
Alternative approaches
The use of in-line particle size measurement as part of a process analytical technology (PAT) strategy towards real-time control of continuous processes has been used for over two decades. List and Steffens3 described a near infra-red (NIR) spectroscopic method for the in-line monitoring of a granulation process. However, there are two major drawbacks with this approach. Firstly, a significant quantity of data needs to be generated for calibration and routine use. Secondly, sensor ‘fouling’ can lead to spurious and misleading outcomes.4
Recently, the feasibility of directly monitoring baseline shifts in NIR has been evaluated. These baseline shifts can be used to monitor particle size, particle shape, density and refractive index of the granule. The baseline shift pattern was attributable to variations in transmittance, reflectance and scattering effects that occurred during granulation, and the presence of an inflection point could be used to identify the granulation end-point.5
Spatial filtering technology (SFT) is used as a novel in-line particle size method to monitor fluid bed granulation processes.6 It has an advantage over NIR approaches in that calibration of the sensor-using product is not required. Particle velocity is measured in a fibre optic array, thereby allowing for ‘direct in-line and real-time determination of the particle size distribution’.7 Petrak8 compared SFT data with off-line laser diffraction findings and showed good correlation for spherical particles of around 100μm, but otherwise SFT data are typically lower than corresponding laser diffraction data. However, this technique can still be used to monitor relative changes in particle size, for example, during a granulation process.9 However, sensor position is important and results should be correlated with off-line laser diffraction measurements if possible.7 Assessment of particle size distribution of suspensions as a function of time has recently been reported.10 The effects of probe angle and probe location mixing parameters were assessed and the homogeneity and related sedimentation and re-dispersion effects evaluated. There was a strong correlation between the particle rate count and concentration of a model system.
Focused beam reflectance measurement (FBRM) has been used to assess particle size distribution in API crystallisation processes.11 This technique is often used in tandem with process video imaging (PVI). A comparison of the particle size distributions measured by laser diffraction and FBRM made for an API crystallisation process demonstrated poor sensitivity of FBRM for small particle size crystals, ie, <1μm.12
In addition, the detection and rapid analysis of visible and sub-visible particulates in injectable products is a growing problem within the industry. Micro-flow imaging (MFI) is an emerging technology for visible particle sizing and counting.13,14 In MFI the change in light intensity as it passes through a particle compared to the background is used to assess both particle size and particle numbers. These images can also be used to assess aspect ratio and transparency.15 In the sub-micron range, nanoparticle tracking analysis (NTA) can be used. The scattered particles are tracked in time to assess particle size.16 Additionally, Taylor Dispersion Analysis (TDA), can be used to measure diffusion coefficient and hydrodynamic radius, with very high precision (<1% RSD).17 Sediq et al16 used a combination of size exclusion chromatography, MFI and NTA to analyse the particle growth kinetics of an injectable product. They showed rapid formation of nanoparticles, followed by the formation of microparticles in the range 1-2μm.
Conclusions
Measurement of particle size distribution of poorly soluble API, drug product intermediates and final drug products is an ongoing challenge within the industry. Both sampling and method preparation can significantly influence the data outcomes. The commonest approach for measuring particle size is laser-based methodologies; however, it is important to visually confirm the output using an orthogonal approach, eg, microscopy. The advent of continuous monitoring of formulated product processes in real or near real time has led to the use of spectroscopic based sizing approaches, eg, NIR, SFT, FBRM. In addition, the need to monitor visible and sub-visible particles in parenteral products has led to the adoption of MFI and NTA for micron and sub-micron particles respectively. As with laser-based approaches, it is important to obtain orthogonal confirmation of the size of these particles.
References
1. Butler JM, Dressman J. The Developability Classification System: Application of Biopharmaceutics Concepts to Formulation Development. Journal of Pharmaceutical Sciences. 2010;99(12):4940-4954.
2. Bayliss et al. Quality guidelines for oral drug candidates: dose, solubility and lipophilicity. Drug Disc Today. 2016;21(10):1719-1727.
3. List K, Steffens K-J. Überwachung und steuerung von granulationprozessen mit hilfe der nah-infrarot-spektroskopie. Pharmind 1996;58;1110-1117.
4. Bushmüller C, Wiedy W, Döscher C, Plitzko M, Breitkreutz J. In-line monitoring of granule moisture and temperature throughout the entire fluidized-bed granulation process using microwave resonance technology (Part I): Pharmind. 2009;71:1403-1408.
5. Kuriyama A, Osuga J, Hattori Y, Otsuka M. 2017. In-line monitoring of a high-shear granulation process using baseline shift of near infrared spectra. AAPS PharmSciTech. 2017;1-11. DOI: 10.1028/s12249-017-0882-2.
6. Lipsanen Y, Närvänen T, Raikkönen H, Anitkainen O, Ylireuusi J. 2008. Particle size, moisture and fluidized bed variations described by indirect in-line physical measurements of fluid bed granulation. AAPS PharmSciTech. 2008;9:1070-1077.
7. Roβteuscher-Carl K, Fricke S, Hacker MC, Schultz-Siegmund M. In-line monitoring of particle size in a fluid bed granulator. Investigations concerning position and configurations of the sensor. Int J Pharm. 2014;46:31-37.
8. Petrak D. Simultaneous measurement of particle size and particle velocity by the spatial filtering technique. Par Sys Charac. 2002;19:391-400.
9. Huang J, Goolcharron C, Utz J, Hernandez-Abad P, Ghosh K, Nagi A. A PAT approach to enhance process understanding of fluid bed granulation using in-line particle size characterisation and multivariate analysis. J Pharm Innov. 2010;5:58-68.
10. Dave K, Luner PE, Forness C, Baker D, Jankovsky C, Chen S. Feasibility of focussed beam reflectance measurement (FBRM) for analysis of pharmaceutical suspension in preclinical development. AAPS PharmSciTech. 2017;1-9. DOI: 10.1028/s12249-017-0819-9.
11. Ruf A, Worlitscheck J, Mazzotti M. Modeling and Experimental Analysis of PSD Measurements through FBRM. Part Part Sys Charact. 2000. DOI: 10.1002/1521-4117(200012)17:4<167::AID-PPSC167>3.0.CO;2-T. http://onlinelibrary.wiley.com/doi/10.1002/1521-4117(200012)17:4%3C167::AID-PPSC167%3E3.0.CO;2-T/full. Accessed 07 November 2017.
12. Kougoulos E, Jones AG, Jennings KH, Wood-Kaczmar MW. Use of focused beam reflectance measurement (FBRM) and process video imaging (PVI) in a modified mixed suspension mixed product removal (MSMPR) cooling crystallizer. J Crystal Grow. 2005;273(3-4):529-534.
13. Zõlls S, Weinbuch D, Wiggerhorn M, Winter G, Friess W, Jiskoot W, Howe A. Flow image microscopy for protein particle analysis – a comparative analysis of four different analytical instruments. AAPS J. 2013;15:1200-1211.
14. Pedersen JS, Persson M. Unmasking transluscent protein particles by improved microflow-imaging algorithms. J Pharm Sci. 2014;102:2152-2165.
15. Sediq AH, Nejandik MR, Bialy IE, Witkamp G-J, Jiskoot W. Protein-polyelerctrolyte interactions: Monitoring the particle formation and growth by nanoparticle tracking analysis and flow imaging microscopy. Eur J Pharm Biopharm. 2015;93:339-345.
16. Filipe V, Hawe A, Jiskoot W. Critical evaluation of nanoparticle tracking analysis (NTA) by NanoSight for the measurements of nano particles and protein aggregates. Pharm Res. 2010;27:769-810. 17. Hulse WL, Forbes RT. A Taylor dispersion analysis method for the sizing of therapeutic proteins and their aggregates using nanolitre sample quantities. Int J Pharm. 2011;416:394-397.
Biography
 DAVE ELDER has nearly 40 years of service within the pharmaceutical industry at Sterling, Syntext and GlaxoSmithKline. He is now an independent GMC consultant. Dr Elder is a visiting professor at King’s College, London, and is a member of the British Pharmacopoeia. He is a member of the Joint Pharmaceutical Analysis Group (JPAG), and a member of the Analytical Division Council of the Royal Society of Chemistry.
 STEPHEN TINDAL is the Director, Science & Technology, Catalent Pharma Solutions. He holds a Bachelor’s degree in Chemistry and Analytical Science from Loughborough University, UK. Stephen has worked at Catalent for 30 years, holding positions in R&D responsible for formulation, process development, and clinical and commercial operations.
 PETER NELSON is the Technical Operations Director at Catalent Micron Technologies. He holds a Bachelor’s degree in Biology from Gettysburg College. Peter has worked at Catalent Micron Technologies for 21 years, holding positions in the Quality Control and Analytical Services departments supporting contract micronisation and stand-alone analytical services with an emphasis on solid-state characterisation.
 GENE PACOWSKI is the Analytical Services Manager at Catalent Micron Technologies. He holds a Bachelor’s degree in Biology from Millersville University. Gene has worked at Catalent Micron Technologies for 17 years, holding positions in the Quality Control and Analytical Services departments supporting contract micronisation and stand-alone analytical services with an emphasis on solid-state characterisation.


Very useful information…
Please see if you can really help in sorting out on below query:
We have one API which is hygroscopic in nature. While using Dry technique ; first two replicate give almost consistent result. But when third replicate is analyzed, %RSD in D90 is not achieved. Sample tends to amalgamates during analysis.we have tried wet technique also ; but it did not help.
Pl comment if some useful solution we have.