Chemometrics: Implementing multivariate data analysis to monitor mammalian cell culture processes
Posted: 13 June 2013 |
Biopharmaceutical companies are constantly evaluating new methods for mammalian cell line development that offer benefits such as shorter time lines, improved consistency, higher monoclonal antibody (mAb) production, better genetic stability and increased flexibility. Each of these advantages extends a potentially large cost benefit to companies as their recombinant protein products move from development into the clinic, and finally on to commercial launch1. In this context, sophisticated chemometric software packages show great potential in enhancing process knowledge and providing optimised control of these complex and challenging processes.
The methodology for utilising multivariate projection methods for process analysis, troubleshooting, process monitoring, abnormal situation detection and fault diagnosis is not in itself new, and has been presented in a series of papers by Nomikos and MacGregor. More recently, the increasing usage of multivariate data analysis (MVDA) in process monitoring has provided new means of investigating variable interactions that were previously undefined. MVDA, by means of projection methods such as Principal Component Analysis (PCA) / Partial Least Squares (PLS), can overcome many challenges associated with bioprocesses, such as multicollinearity, and multidimensionality of the dataset, missing data and variation introduced by experimental error and noise.
The methodology for utilising multivariate projection methods for process analysis, troubleshooting, process monitoring, abnormal situation detection and fault diagnosis is not in itself new, and has been presented in a series of papers by Nomikos and MacGregor2. More recently, the increasing usage of multivariate data analysis (MVDA) in process monitoring has provided new means of investigating variable interactions that were previously undefined. MVDA, by means of projection methods such as Principal Component Analysis (PCA) / Partial Least Squares (PLS), can overcome many challenges associated with bioprocesses, such as multicollinearity, and multidimensionality of the dataset, missing data and variation introduced by experimental error and noise3.
In the present study, we investigate the utility of MVDA in monitoring six production batches of Chinese Hamster Ovary (CHO) cell cultures producing a monoclonal antibody (mAb) product grown in small scale reactor vessel, using the off-line process data with the key objective of understanding the variability in the results obtained and also delineate useful process related information. Here, we have developed a batch PLS model incorporating four fermentation datasets, using days elapsed as the maturity Y variable, also assessed model robustness with additional batches. From an industrial aspect, this feature is useful as it enables users to realise the performance of the batch data, and also to understand the quality of the batches, identify ‘good’ batches which can be set as standard (‘golden batch’) to assess the quality of future batches.
Material and methods
Bioprocess and sampling
CHO cells were cultivated in Applikon BioConsole XL (Applikon Biotechnology Ltd., Worcestershire, UK) fermenters of working volume 5L. Inocula for fermentations were grown in a shaker flask which was used to seed the bioreactor. The medium used was a generic propriety complex animal component free seed medium. Process set points were: temperature 37°C, pH 6.95 ± 0.1, agitation rate 263 rpm, gassing rates 40 per cent O2 in air 0.1vvm, and CO2 0.05 vvm, pH control method by CO2 sparge, and set point DOT of 30 per cent. After running the seed vessels for four days, the cell density was determined, before sub-culturing the vessel for the production run.
Primary / reference analysis
All reference assays were carried out in triplicate.
Viable cell count (VCC) and percentage (%) viability
500μl of the trypsinised cells was added to the autosampler cup and cell count was determined using Vi-CellTM instrument (Beckman Coulter, Fullerton, CA.).
Glucose and Lactate
Supernatant samples were used for the glucose and lactate assays and concentrations were determined using a YSI 7100 MBS analyser (Yellow Springs, Ohio, USA).
Monoclonal Antibodies (MAb)
The titre value was determined using a nephelometer (IMMAGE®, Beckman Coulter, Fullerton, CA). The data for mAb has not been presented for reasons of confidentiality.
Data analysis
Data analysis was carried out using SIMCA-P+ (Umetrics, vs. 11.5) software. SIMCA batch PLS was used to perform the multivariate analysis. The modelling approach followed here is that of observational level modelling, and involves unfolding of three-dimensional data as illustrated in Figure 1. This type of unfolding has previously been successfully used for detection of abnormal batches3,4.
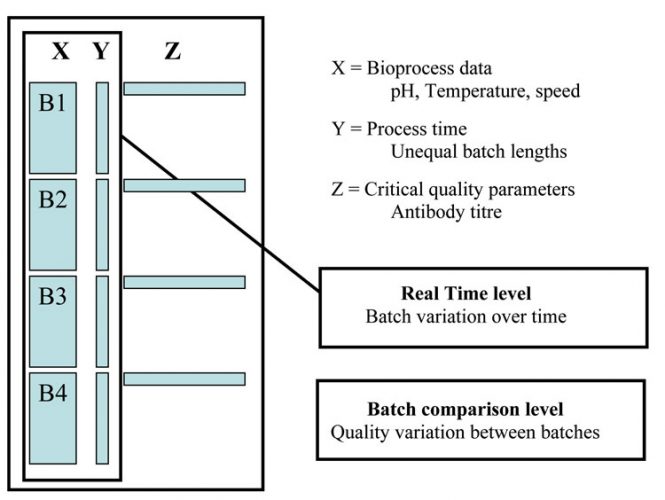
Figure 1: Unfolding the three-way matrix along the batch direction to generate a two-way matrix
The PLS model was used to associate the process data to maturity-related Y-variable (days elapsed) to align batch data according to (chronological) absolute time of each batch (literally, the time from the start of the batch)5. In SIMCA, the maturity variable is smoothed within each phase and is done by fitting a constrained quadratic polynomial, using a piecewise least squares algorithm6. The smoothed maturity was used by default, both for the response variable Y, and for alignment.
MVDA modelling approach
In the present study, PLS has been used as the projection method. The objective is to find the latent structure in the X matrix (the descriptive variables) and the Y matrix to maximise covariance between the matrices. Every observation in a dataset can be visualised as one point in the X-space and another point in the Y-space. Thus, hyperplanes called principal components are calculated to provide maximum correlation between X and Y spaces. Projection methods such as PLS are scale sensitive, therefore, unit variance (UV) scaling has been applied to remove differences in range between variables. Here cross validation has been performed on the four fermentation datasets.
The final step followed here in batch modelling is importing two new batches, and comparing the new batch performance against the PLS model. Next, the PLS model was used to generate batch control charts for testing the fit of the new batches. Finally, the batch prediction control charts (scores giving the trajectory of a batch) are created to differentiate between representative and non-representative test set batches.
Results and discussion
Bioprocess and analyte information
The production stage in a cell culture process is essentially different compared to the seed stage, involves the use of a production medium designed specifically for moderate growth and high productivity. Production stage vessels have a long process time of nearly 15 – 20 days or until the viability is ≤50 per cent and a higher glucose concentration of ±12g/l.
Figure 2 shows the time course of a typical CHO cell culture production process showing trends for the key analytes. The VCC range as observed here is from 0.8 – 4X10⁶ cells/ml. Glucose is the main carbon and energy source mainly utilised by the cells for mAb production and one should ensure that it is not utilised for lactate (by-product) accumulation as the latter is toxic to producing cells. Conversely, if glucose level falls to limiting levels, the culture may undergo rapid degeneration leading to loss of titre7. Therefore, the major process decisions in the production stage are: sufficiently high cells of 0.8X10⁶ cells/ml while inoculating the production vessel, keeping glucose at >3g/l levels and maintaining the cell culture process until the %viability drops to ≤50 per cent. In all, implementing an MVDA technique to analyse data from this particular type of process is highly challenging, but provides an effective means of improving control and in turn, leading to process optimisation.
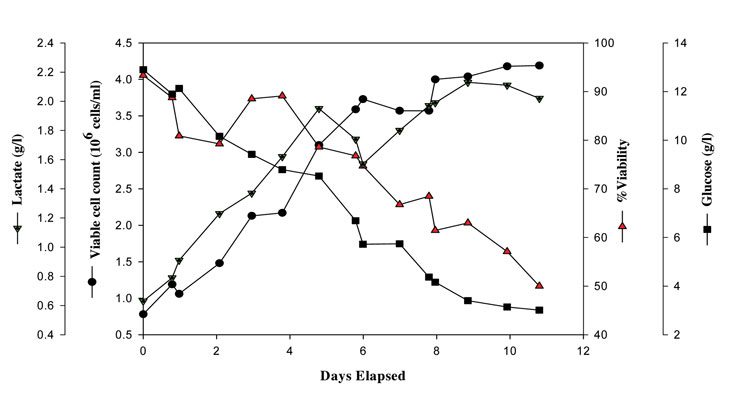
Figure 2: VCC, %viability, glucose and lactate vs. days elapsed in a typical Chinese Hamster Ovary (CHO) cell culture production process grown in generic propriety complex animal component free production media
MVDA batch PLS models using days elapsed as the maturity Y variable
Scores Plot
The scores are the coordinates of the samples in the new coordinate system where the axes are defined by the principal components. The plot reveals how the samples are related to each other in the given measurements8. The scores plot is useful in highlighting the pattern of the samples, and can help identify unusual or inconsistent patterns, which might indicate potential problems with the model/or samples.
A visual summary of the process behaviour over time can be observed in scores plot, where the score vectors t1 and t2 are plotted against each other. Here, the Hotelling T2 plot has been used as it provides a confidence interval of 95 per cent and the observations situated outside the ellipse are outliers. Here scores scatter plot (Figure 3) have been generated using the four production batches and classified according to the days of the fermentation run depicted by distinct colours starting from 0 to 10.8 days. It can be observed from the figure that the four batches are overlapping each other, hence, represents an acceptable process.
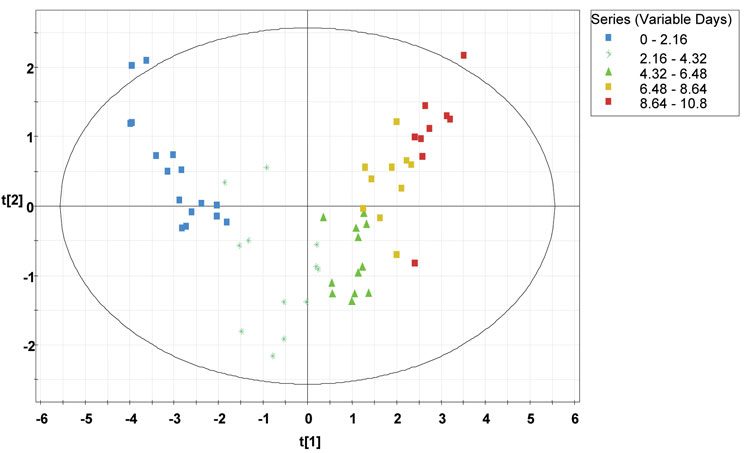
Figure 3: Scores scatter plot (t1 vs. t2) from the four CHO cell production batches along with the 95 per cent tolerance ellipse, using days elapsed as Y variable, classified according to the time progression (days elapsed) of the fermentation run. The time progression is represented by different colours as depicted in the legend
Loadings plot
Loadings are used to determine which variables are important for describing variation in the original dataset. The loadings are the cosine of the angle between the principal components and the original variables and describe how the original measurement variables are related to each of the new principal component axes8.
The w*c1/w*c2 plot shows both X and Y-weights, it illustrates how the X (input) and Y (output) variables combine in the projections, and how the X variables relate to Y. Plotting w*c1 vs. w*c2 provides an overview of the correlations between all variables for the first two components. Figure 4 shows the PLS loadings plot from the four production batches of CHO cell culture vessels.
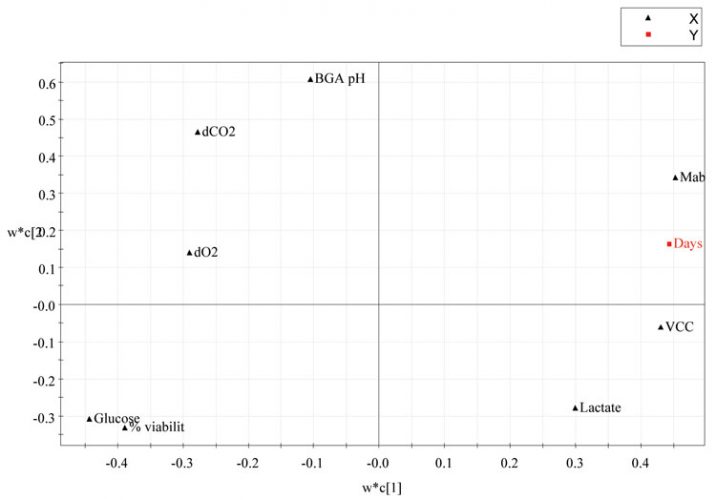
Figure 4: PLS Loadings plot from the four CHO cell production batches using days elapsed as the maturity or Y variable
The variables with largest absolute values of p1 and/or p2 are situated far away from the origin (on the positive or negative side) on the plot and dominate the projection. Thus, for input variables, the further from the centre (0, 0) in the loadings plot, the greater the impact that variable has on the outcome of the cell culture. For output variables, the further from centre (0, 0) greater is the impact the cell culture process has on the output variable3. Also, this plot illustrates how the different variables are correlated with respect to each other. Variables near each other (in the same quadrant) are positively correlated; variables opposite to each other (opposite quadrants) are negatively correlated9.
It is evident from Figure 4 that the cell culture process has significant impact on VCC, titre and %viability. Since %viability and days elapsed are in the opposite quadrants, this implies that at earlier stages of the process, %viability is high and as the days elapsed increase, the %viability decreases. Likewise for mAb, in the opposite quadrant to %viability and glucose, thus when %viability is high, mAb is low and vice versa. There also appears to be a correlation between glucose consumption and mAb production, which is perhaps unsurprising, if glucose levels fall to limiting levels the culture may undergo rapid degeneration leading to loss of protein mAb. Ideally, in a cell culture process, glucose levels should be maintained at 3.5g/l or else the cells are fed with synthetic glucose7.
The input parameters dCO2, dO2, pH, glucose and lactate levels have a significant impact on the outcome of the cell culture process. pH, dCO2, dO2 have a broadly similar effect on the cell culture process, grouping in the same quadrant, whereas lactate has the reverse effect. In a cell culture process, lactate is a metabolic waste product and should be maintained at low levels as it is toxic to the producing cells and should be ensured that the cells are not growing at the expense of protein synthesis7.
However, the input parameter, glucose appears to have a dominant effect on the outcome of the process, being furthest away from the centre of the loadings plot. In a study by Kirdar et al3 they highlighted the significance of loadings plot for the qualitative assessment of success of scale up and process comparability across scales, equipment or sites.
Variable Importance Plot (VIP)
This plot gives a visual display of the observations made from the score and loadings plots and helps understand the relative importance of each variable included in the analysis. The VIP values reflect the importance of the terms in the model both with respect to Y, i.e. its correlation to all the responses, and with respect to X (the projection). The VIP display is, therefore, a reliable means of ranking variables according to their importance.
The batch PLS model built using days elapsed as Y variable, has four principal components, where PC1 explains the greatest variation in the model of 92 per cent and the subsequent components explains decreasing amount of variation.
Figure 5 shows the VIP plots from the CHO cell production batches using days elapsed as the Y-variable. Some interesting features can be observed from the VIP plot such as: mAb shows the strongest influence on the cell culture process, which is in accordance with the loadings plot where mAb shows the largest absolute values of w*c1 and w*c2 being situated far away from the origin, followed by glucose, VCC, %viability and lactate, whereas for input parameters, the positioning of all the variables is rather similar.
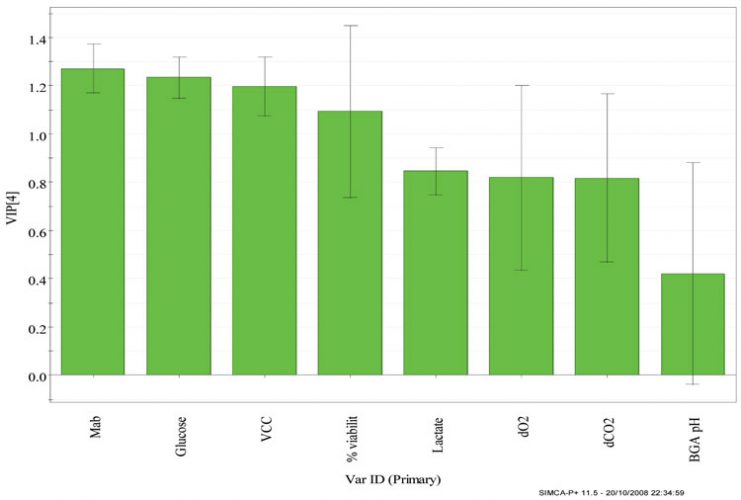
Figure 5: Variable importance (VIP) projection plots from the four CHO cell production batches using days elapsed as the maturity variable
Batch control chart
This chart is useful for identifying the time point at which a batch may deviate from normal process behaviour. It consists of a set of upper and lower limits calculated at ±3 SD, and an average batch trajectory for which the process is expected to follow. Figure 6 shows the batch control chart for VCC from the four CHO cell production batches that were analysed. It is evident from the overlay of the batches are within the control limits ±3 SD.
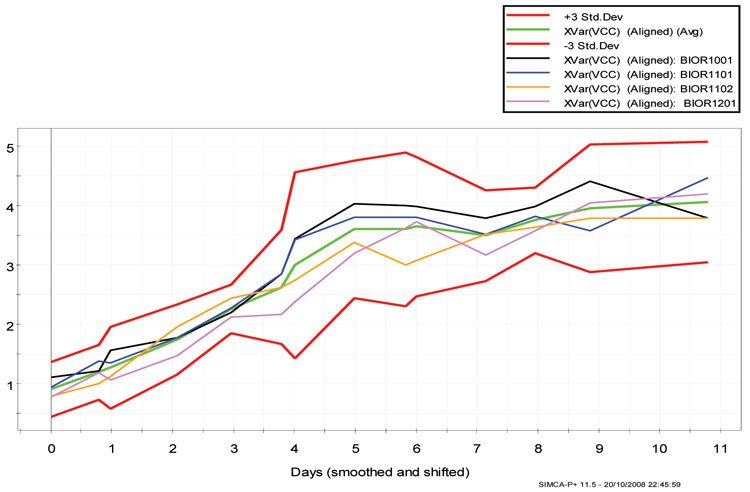
Figure 6: Batch control chart from the four CHO cell production batches for the output parameter viable cell count (VCC) using days elapsed as the maturity Y-variable, with +3, -3 control limits and average batch. The different batches and control limits are depicted in the legend
Logically, the next step was to import new batches and assess the performance of the two additional test (fermentation runs) batches. Here, post analysis was conducted i.e. the result of a batch was checked after the completion of the run. Even when conducting post analysis, it is possible to characterise a ‘batch’- good or bad, several hours before the release of results from quality analysis4, potentially beneficial from an industrial aspect.
Importing secondary dataset to assess the performance of the batches
Figure 7A shows the predicted scores batch plot for the two batches, with control limits +3, -3 and an average batch shown by different colours as depicted in the legend. It is apparent from Figure 7 that one of the batches, test batch 2, deviates out of the control limits. Therefore, to understand the reasoning for the deviation, contribution plot for test batch 2 was created.
![Figure 7: [A] Predicted scores batch plot for the two test batches (Batch1 and 2) from the CHO cell production batches, with +3, -3 control limits and average batch. The different batches and control limits are depicted in the legend. [B] Contribution created for the Test Batch2 (which shows deviating trend in the predicted scores plot)](https://www.europeanpharmaceuticalreview.com/wp-content/uploads/Payal-Roychoudhury-Figure-7.jpg)
Figure 7: [A] Predicted scores batch plot for the two test batches (Batch1 and 2) from the CHO cell production batches, with +3, -3 control limits and average batch. The different batches and control limits are depicted in the legend. [B] Contribution created for the Test Batch2 (which shows deviating trend in the predicted scores plot)
The contribution plots display the differences, in scaled units for all the terms used in the model, between the outlying observation and the normal observation, multiplied by the absolute value of the normalised weight6. Figure 7B shows a few interesting features which can be noticed. Glucose gets consumed rapidly which is mainly used to facilitate growth VCC, while %viability falls rapidly with a concomitant increase in lactate production, as a consequence lower mAb production. Hence, test batch 2 stands out from the remaining batches. The result illustrates the value of MVDA analysis in detecting ‘rogue’ batches, but, as can seen here, also helps track down the cause of these rogue processes.
Further, in SIMCA-P+, it is possible to identify batches using discrete observation names / primary IDs and here the passage number at which the cell culture process was operated was used as primary observation ID. Therefore, the Y predicted plot was generated for all the six fermentation batches and classified using passage number, we could infer (from Figure 8) that deviations in the test 2 batch was associated with ‘high passage numbers’ of 24.
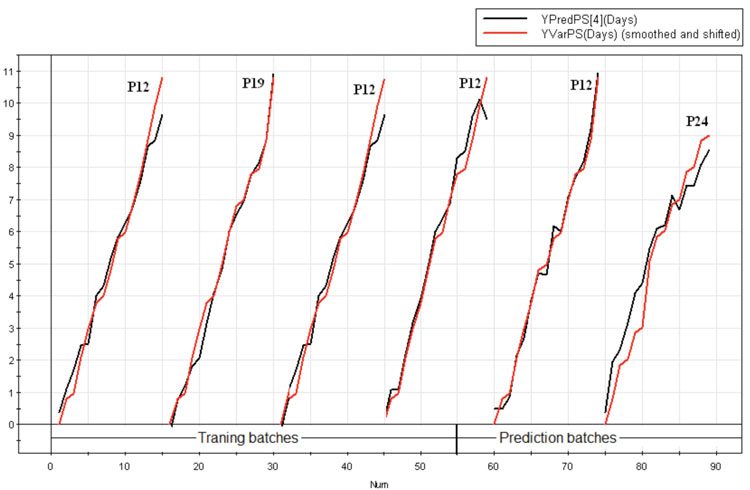
Figure 8: Y predicted plot for all the six production batches showing the maturity variable days elapsed for the last principal component 4(—), plotted alongside the original chronological time (—), classified according to the passage number at which the production batches were operated. It is evident from the figure that the test batch 2 started at passage 24 (P24) deviates from the other batches
There is evidence in the literature showing that over subculturing changes cell line properties over time10. The degree of sub- culturing a cell line undergoes is generally expressed as ‘passage number’, which is the number of times cells have been sub-cultured into a shake flask or reactor vessel. The passage related effects mainly manifest alterations in cellular protein expression, and are both cell line and application-dependent. This clearly raises the question, “What passage numbers is excessive for optimum cell growth and titre production?” However, preventing passage related effects from influencing experimentation becomes a matter of determining the passage number range to attain optimum growth and titre production, which was beyond the scope of the present study.
Conclusion
The results clearly show the usefulness of multivariate data analysis with respect to process characterisation and understanding. The work described is novel as the calibration model has been challenged using new datasets and pertinent information with regard to the process could be attained. The study is both timely and innovative in view of the pressing need for effective bioprocess monitoring. Our findings indicate the usefulness of MVDA and that it could provide real insight in what is exactly happening in the bioprocess.
References
- Bleck G.T (2005) An Alternative method for the rapid generation of stable, high-expressing mammalian cell lines. Bioproc. J l: 1-7. http://www.gala.com/pdf/ bioprocessingj.pdf
- Nomikos P (1996). Detection and diagnosis of abnormal batch operations based on multiway principal component analysis. ISA Transactions 35: 259–267
- Kirdar AO, Conner JS, Baclaski J, Rathore AS (2007) Application of Multivariate Analysis toward Biotech Processes: Case Study of a Cell-Culture Unit Operation. Biotechnol. Prog 23: 61-7
- Kourti T (2003) Abnormal situation detection, threeway data and projection methods; robust data archiving and modeling for industrial applications. Ann. Rev. in Control 27: 131-8
- Jorgensen P, Pedersen JG, Jensen EP, Esbensen KH (2004) On-line batch fermentation process monitoring (NIR) – introducing biological process time. J. Chemometrics 18: 81-91
- SIMCA-P and SIMCA-P+ 11 (2005) User guide and tutorial, version 11, Umetrics AB: Umea®, Sweden
- Arnold A.S, Crowley J, Woods N, Harvey, L.M, McNeil, B (2003) In situ near infrared spectroscopy to monitor key analytes in mammalian cell cultivation. Biotech. Bioeng 84: 13-19
- Beebe KR, Jell R.J, Seasholtz M.B (1998) Chemometrics- A practical guide. John Wiley and Sons, Inc
- Martin EB, Morris AJ, (2002) Enhanced biomanufacturing through advanced multivariate statistical technologies. J.Biotechnol 99: 223-35
- Wenger SL, Senft JR, Sargent LM, Bamezai R, Bairwa N, Grant SG (2004) Comparison of established cell lines at different passages by karyotype and comparative genomic hybridization. Bioscience Rep 24: 631-9
Biographies
 Payal Roychoudhury is a former employee of AstraZeneca (AZ) where she has been working as Senior Cell culture Scientist at R&D Mölndal, Sweden. In 2009, Payal joined AZ and has extensive experience with near infrared spectroscopy (NIR) and bioprocessing. She has worked with microbial, mammalian, insect cells and Pichia cultures. She has recently joined the Cell Culture Development department at Lonza Biologics as Lead Scientist. Payal completed her PhD on ‘Infrared spectroscopy to monitor industrial bioprocesses’ from the University of Strathclyde, Glasgow, UK. She worked as a post-doctoral research fellow at University of Strathclyde on the Department of Trade Industry (DTI) project with GlaxoSmithKline as an industrial partner. In 2007, she also worked as an NIR application scientist providing technical expertise to Bruker Optics customers (Coventry, U.K).
 Ronan O’Kennedy joined Fujifilm Diosynth Biotechologies (FDB) R&D in 2010 and is Head of Mammalian Cell Culture Process Development. His group is focused on development of mammalian cell culture based bioprocesses for manufacture of biotherapeutics. Research interests include linking upstream process performance to downstream product quality. He is particularly interested in data driven process modelling, Process Analytical Tools (PAT) and Quality by Design (QbD) used to maximise the value of process data and its re-use throughout the product development lifecycle. Prior to FDB, he was a member of the academic staff at the Department of Chemical Engineering at Newcastle University. He has eight years’ experience with the Bioprocess Development Group at GlaxoSmithKline. At GSK, he focused on upstream development of mammalian cell culture & microbial processes for clinical manufacture, Tech Transfer, monitoring and control.
Jim Faulkner is responsible for CMC, manufacturing and supply within the GSK Rare Diseases team at GlaxoSmithKline. GSK Rare Diseases is a fully integrated unit within GSK that is responsible for the development and commercialisation of medicines for rare and orphan diseases. Jim’s role is to ensure that all the unit’s portfolio of projects and products have a suitable manufacturing process and supply chain. Jim joined GlaxoWellcome in 1999 as head of biopharmaceutical analytical development. In 2004, he was appointed as head of early biopharm development in the newly-created GSK Centre of Excellence for Biopharmaceuticals. He moved from Biopharm R&D to his current post when GSK set up its Rare Diseases business in 2010.
 Brian McNeil is Professor of Microbiology at the University of Strathclyde with research interests in real time monitoring of microbial and cell culture systems for manufacturing a range of bioproducts, from antibiotics to antibodies. His other major research interest lies in understanding microbial stress within fermenter systems.
 Linda M. Harvey is a Reader in Micro – biology at Strathclyde Institute of Pharmacy and Biomedical Science University of Strathclyde, Glasgow. Her major areas of research interest include understanding the physiology of microbial and animal cell cultures within fermenter and bioreactor systems; bioprocess technology, including reactor and fermenter design; measurement and control in bioprocesses, with particular emphasis on spectroscopic techniques (Near and Mid IR) and data handling. All of these areas have received substantial industrial funding support together with funding from public sources.
Issue
Related topics
Related organisations
AstraZeneca, GlaxoSmithKline (GSK), University of Strathclyde
Related people
Jim Faulkner, Linda M. Harvey, Payal Roychoudhury, Ronan O’Kennedy