
Featured content
Day three preview: the Future of Bio/Pharma Analysis Virtual Summit 2026
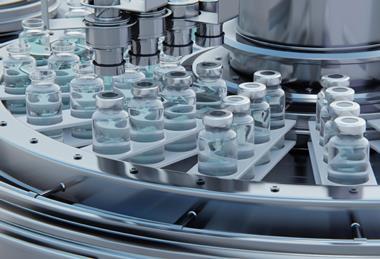
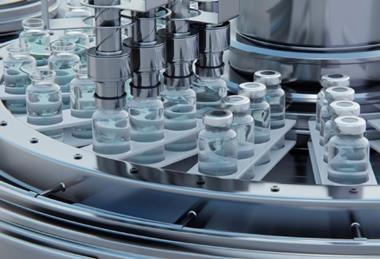
Pharmaceutical manufacturing takes centre stage on Day three of The Future of Bio/Pharmaceutical Analysis Virtual Summit 2026 as speakers examine how digital technologies, artificial intelligence and advanced production methods are reshaping what is possible in the field.
 Article
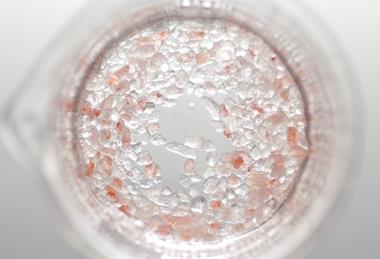
Implementing horizontal recycling for pharmaceutical release liners
The backing paper waste from pharmaceutical labels is often overlooked on packaging lines operating under GMP standards. This article shares how a closed-loop backing paper recycling system supports implementation without the need to modify existing printers or labellers.
 Article
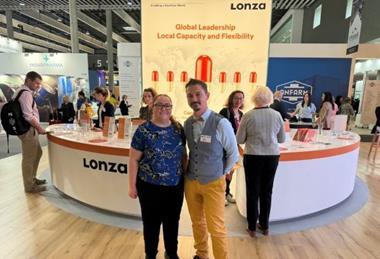
Staying competitive within the evolving CDMO model
Dr Abdelaziz Toumi, CEO of Lupin Manufacturing Solutions, shares his perspective on the structural evolution of the CDMO model, the scientific imperatives shaping oncology and peptide manufacturing, and the talent challenge that he believes will define competitive positioning in the decade ahead.
 Article
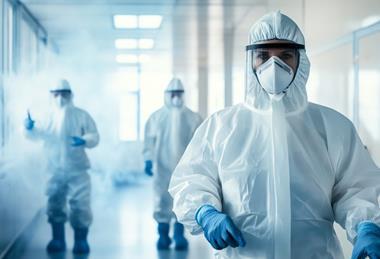
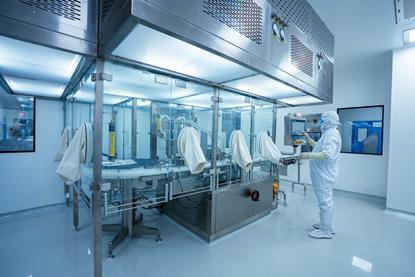
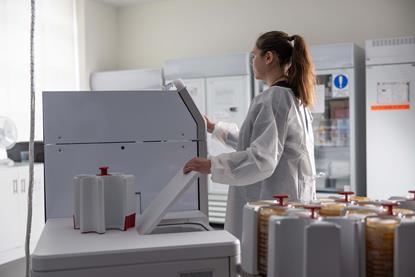
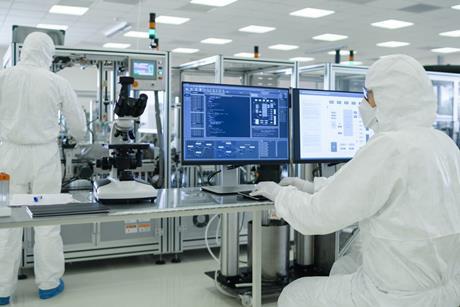
The shift towards strategic adoption of intelligent automation in pharmaceutical microbiology
Faced with increasing regulatory pressure and operational complexity, pharmaceutical manufacturers are rethinking the microbiology workflow. Intelligent automation is enabling a shift toward more consistent, scalable, and data-driven contamination control.
Opinion and interviews
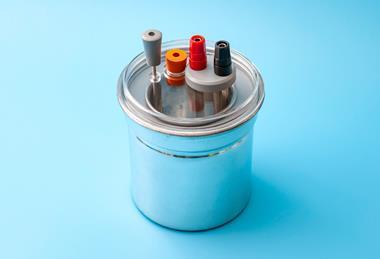
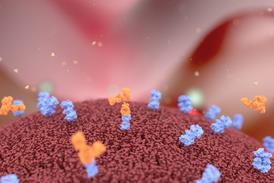
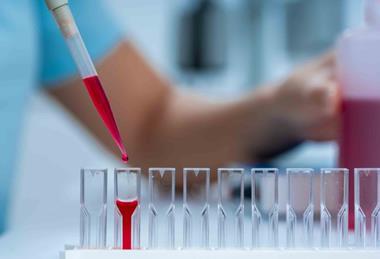
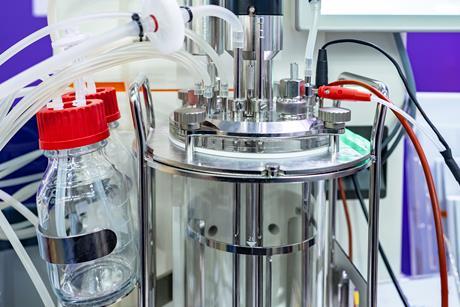
Real-time Raman spectroscopy closes bioprocess control measurement gap
Manual sampling cycles leave bioreactor control decisions hours behind culture dynamics. Process Raman spectroscopy offers continuous, real-time measurement of critical parameters, enabling true closed-loop control in perfusion and continuous bioprocessing applications where measurement lag directly impacts yield and product quality.
- Previous
- Next


Join now
Unlock exclusive industry insights
- Bookmark articles and resources to access anytime
- Enjoy free access to industry leading resources, webinars and insights
- Stay informed with the latest news and breakthroughs in drug discovery
- Receive updates and recommendations tailored to your research interests
Upcoming Webinars
Webinar
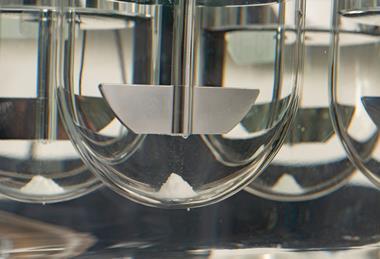
Practical steps for innovating pharmaceutical manufacturing
During this webinar, industry experts will discuss practical examples and considerations for transforming manufacturing processes.
Webinar
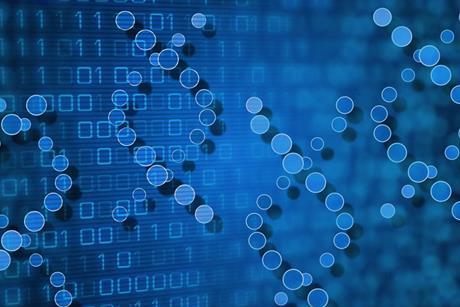
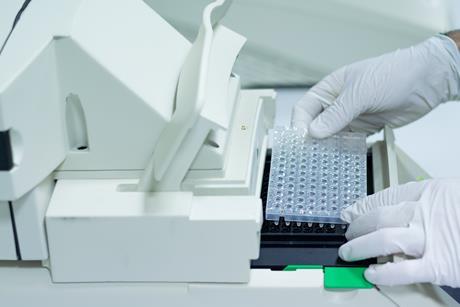
Enhancing Laboratory Workflows with qPCR Automation
Join this webinar to learn how automation can support scale throughput while maintaining data quality and reproducibility in PCR and qPCR workflows.
Webinar
Enhancing downstream processing for biologic therapies
During this webinar industry experts will share practical insight and considerations for modernising pharmaceutical downstream workflows.
Practical steps for innovating pharmaceutical manufacturing
Enhancing Laboratory Workflows with qPCR Automation
Enhancing downstream processing for biologic therapies
On-demand Webinars
- Previous
- Next