Raman imaging in pharmaceutical research – an overview
Posted: 26 June 2020 | Damon Strom (WITec), Eleni Kallis (WITec), Harald Fischer (WITec), Miriam Boehmler (WITec), Thomas Dieing (WITec) | No comments yet
Since making its debut in the pharmaceutical setting, the range of applications for which Raman microscopy imaging has been used continues to grow. Here, Harald Fischer, Damon Strom, Miriam Boehmler, Eleni Kallis and Thomas Dieing demonstrate the versatility of confocal Raman imaging by exploring a variety of real-world applications.

IN THE PHARMACEUTICAL industry the development of new products and formulations requires versatile and adaptive analysing and imaging capabilities. Confocal Raman imaging is a well-established and widely used spectroscopic method for the investigation of the chemical composition of a sample. In pharmaceutics, it can be used to probe the distribution of components within formulations, characterise homogeneity of pharmaceutical samples, determine the state of drug substances and excipients and to characterise contaminants and foreign particulates.1 The information obtained by Raman imaging is also useful for drug substance design, development of solid and liquid formulations, as a tool for process analytics and for patent infringement and counterfeit analysis.2-4 Due to its non-destructive methodology, it is possible to combine a confocal Raman microscope with other imaging techniques such as atomic force microscopy (AFM), scanning electron microscopy (SEM) or fluorescence analysis. Combining a particle analysis tool with Raman microscopy makes it possible to find, classify and identify particles in a sample according to their size, shape and chemical characteristics. In this article, we will introduce the variations of confocal Raman imaging and provide real-world application examples.
Raman imaging microscopy is a fast and nondestructive chemical characterisation technique based on the Raman effect, which was discovered more than 90 years ago by Chandrasekhara Venkata Raman and documented in his paper A New Type of Secondary Radiation.5 Raman was later awarded the Nobel Prize in Physics for his work. The effect is based on light interacting with the chemical bonds of a sample. Due to vibrations in the chemical bonds this interaction causes a specific energy shift in the backscattered light, which appears in a unique Raman spectrum that can be detected by spectroscopic methods. From the spectra, the chemical and molecular compounds can be identified and additional sample characteristics such as the relative quantity of a specific component, stress and strain states, crystallinity or polymorphic structures can be further analysed.
Sifting through particles with conventional means is tedious and time consuming, so advanced optical and algorithmic techniques are necessary to expedite the process”
Less than one Raman-shifted photon is usually produced from one million incident photons. Therefore, the instruments used to acquire Raman signals should have optimised optical components, including highly sensitive detectors with low noise and a confocal beam path to reject light from outside the focal plane and increase the signal-to-noise ratio. This optimisation enables the detection of Raman signals from even weak Raman scatterers and extremely low material concentrations or volumes. Measurements carried out on delicate samples also benefit from the ability to acquire Raman spectra using very low excitation energies.
Advanced Raman imaging experiments often include various optical elements in their beam path. A fully-automated instrument controls all the individual pieces from one integrated software suite and records their settings with each measurement. Developments in opto-mechanical components now enable systems to self-align and self-calibrate, which increases sample turnover rate and optimises performance for every experimental setup. Software-driven routines ensure the consistency and repeatability of results while also substantially reducing the researcher’s workload by requiring less user input and eliminating potential sources of error. An automatically aligned and calibrated Raman microscope should always be capable of a lateral resolution under 300nm and a depth resolution of less than 900nm with 532nm excitation.6
A spectral resolution down to 0.1cm-1 relative wavenumbers at 633nm excitation and acquisition times faster than 1ms per spectrum should also be regularly achievable. Remote operation through automated components allows Raman imaging measurements in environmental enclosures such as glove boxes, which has great utility in life sciences among other disciplines.
3D imaging
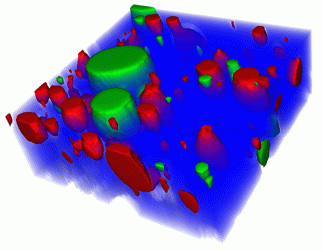
Figure 1: 3D Raman image of a hand cream. Blue: water; red: oil; green: one of the hand cream’s moisturising ingredients dissolved in oil. Scan range: 40 x 40 x 15µm3.
Volume scans are a valuable tool in providing information about the dimensions of objects or the distribution of a certain compound throughout the sample. In order to generate 3D images, confocal 2D Raman images of parallel focal planes are acquired by scanning throughout the sample in the z-direction. The 2D images are then combined into a 3D image stack.6 Figure 1 shows a 3D Raman measurement of hand cream. Fifteen images of 200 x 200 pixels were acquired in rapid succession along the z-axis to form a 3D image stack. Blue: water; Red: oil; Green: one of the hand cream’s moisturising ingredients dissolved in oil. Scan range: 40 x 40 x 15µm3.
Topographic Raman imaging
The combination of a confocal Raman microscope with an optical profilometer enables chemical characterisation guided by surface topography. This allows the surface of even large, coarsely textured and curved or inclined samples to remain in constant focus during the measurement. As the sensor actively monitors and maintains a set distance between the objective and sample surface with sub-micrometre resolution, its closed-loop operation can counter shifts induced by changes in temperature or humidity during measurements with long integration times.7,8 This precise tracing of a sample surface while acquiring Raman imaging data combines the convenience of optical profilometry with the sensitivity of Raman microscopy to produce a sharp and detailed topographic Raman image. A pharmaceutical tablet was investigated with TrueSurface Microscopy and the results are shown in Figure 2. [A] shows the representation of the tablet’s topography (7x7mm2) with a height variation of 840µm. The simultaneously obtained topographic Raman image [B] reveals the distribution of the sample’s chemical components three-dimensionally. [C] shows the Raman spectra of the tablet’s main components: Red: Paracetamol; Blue: Aspirin; Orange: Caffeine.
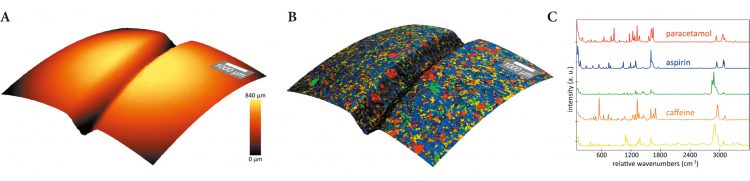
Figure 2: Pharmaceutical tablet, investigated with TrueSurface Microscopy A: topography, B: topographic Raman image, C: corresponding spectra of the components shown in B
High-resolution investigations of microparticles are of great interest in pharmaceutical research; combining an automated particle analysis tool with Raman microscopy makes it possible to find and classify particles according to physical attributes before chemically identifying them by their Raman spectra. Particulate samples generally contain many different materials, of which only a subset is interesting to the researcher. Sifting through particles with conventional means is tedious and time consuming, so advanced optical and algorithmic techniques are necessary to expedite the process. A white-light confocal microscope can survey a sample using bright- or dark-field illumination to recognise particles before they are categorised by physical properties such as area, perimeter, minimum/maximum Feret diameter, elongation and many others.
Combining a particle analysis tool with Raman microscopy makes it possible to find, classify and identify particles in a sample according to their size, shape and chemical characteristics”
Particles of varying height can be accommodated by focus stacking, which acquires images at several focal distances and compiles them to ensure all particles show a sharply defined edge for recognition by the analysis software. The outlines of particles are used to create a mask that guides the subsequent measurement only to particles of interest while omitting all others and the empty space in between, which drastically reduces measurement time. Boolean expressions that include several criteria can further refine the categorisation by excluding certain classes of particle or selecting only those that display combinations of physical properties. The mask guides the excitation light to the particles of interest in rapid succession to acquire a Raman spectrum from each one. This information is automatically stored with the location and category of each particle for subsequent analysis. The results are consolidated and described quantitatively in the form of a table or histogram.
Raman imaging and particle analysis
The measurement in Figure 3 shows the results of particle analysis carried out on a cosmetic peeling cream sample using an automated particle analysis tool combined with a confocal Raman microscope. Figure 3A shows the overlay of an optical bright field microscope image with the corresponding confocal Raman image. The chemical analysis revealed anatase and boron nitride particles in an oil matrix (Raman spectra shown in Figure 3B). Further evaluation of the results determines the quantitative prevalence of the molecular sample components in the particles (see Figure 3C) and the distribution of chemical compounds correlated to particle size (see Figure 3D).
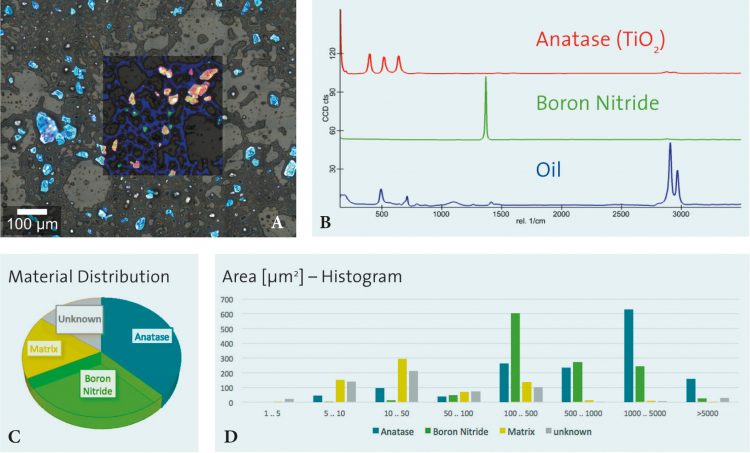
Figure 3: Results of particle analysis carried out on a cosmetic peeling cream sample using an automated particle analysis tool combined with a confocal Raman microscope
Conclusion
We have demonstrated the versatility of confocal Raman imaging using application examples ranging from cosmetic creams to tablets. Through correlative microscopy techniques, such as TrueSurface microscopy, the analysing potential of a confocal Raman microscope can be further enhanced. Additionally, imaging techniques such as 3D volume scans can provide information about the distribution of the chemical information throughout the sample. In conclusion, Raman microscopy techniques make chemical and molecular analyses accessible for a broad range of applications in the pharmaceutical research.
About the authors
 Harald Fischer is a Marketing Director at WITec GmbH, Ulm, Germany.
 Thomas Dieing is a Product Manager at WITec GmbH, Ulm, Germany.
 Damon Strom is in Technical Marketing at WITec GmbH, Ulm, Germany.
 Miriam Boehmler is a Senior Applications Scientist at WITec GmbH, Ulm, Germany.
 Eleni Kallis is in Technical Marketing at WITec GmbH, Ulm, Germany.
References
- Smith, GPS; McGoverin, CM; Fraser, SJ; Gordon, KC. Raman imaging of drug delivery systems. Advanced Drug Delivery Reviews. 2015;89.
- Haefele, TF; Paulus, K. Confocal Raman Microscopy in Pharmaceutical Development. Vol. 158. Heidelberg: Springer Series in Optical Sciences; 2010.
- Wormuth, K. Characterization of Therapeutic Coatings on Medical Devices. Vol. 158. Heidelberg: Springer Series in Optical Sciences; 2010.
- Franzen, L; Selzer, D; Fluhr, JW; Schaefer, UF; Windbergs, M. Towards drug quantification in human skin with confocal Raman microscopy. European journal of pharmaceutics and biopharmaceutics. 2013 Jun;84(2):437-444.
- Raman, CV; Krishnan, KS. A new type of secondary radiation; Nature 1928, 121 (3048). pp. 501-502.
- Dieing, T. Resolution and Performance of 3D Confocal Raman Imaging Systems; 121-153 Confocal Raman Microscopy, 2nd Edition, Springer Series in Surface Sciences (66), Springer International Publishing AG (2018)
- Masic A and Weaver JC. Large area sub-micron chemical imaging of magnesium in sea urchin teeth, J Struct Biol 189(3): pp269-75, 2015
- Kann B and Windbergs M. Chemical imaging of drug delivery systems with structured surfaces – A combined analytical approach of confocal Raman microscopy and optical profilometry, AAPS J 15(2): pp505-10, 2013