PAT – reducing the cost of quality in consumer products manufacturing
Posted: 19 June 2008 | Debbie Peru, Senior Technical Associate, Global Analytical Sciences Department of Colgate Palmolive Co | No comments yet
The ease in making process analytical measurements (typically spectroscopic) in manufacturing has provided a unique opportunity to obtain up-to-date information for making timely process correction decisions. At-line methods provide near-time information without the need for elaborate process control interfacing upfront. This approach works well for batch processing applications or unit operations when process decisions can be made during a defined operation. Effective use of at-line methods includes the measurement of raw materials, premix batches, or quality check point monitoring before finished product is sent to the finishing lines.
The ease in making process analytical measurements (typically spectroscopic) in manufacturing has provided a unique opportunity to obtain up-to-date information for making timely process correction decisions. At-line methods provide near-time information without the need for elaborate process control interfacing upfront. This approach works well for batch processing applications or unit operations when process decisions can be made during a defined operation. Effective use of at-line methods includes the measurement of raw materials, premix batches, or quality check point monitoring before finished product is sent to the finishing lines.
The ease in making process analytical measurements (typically spectroscopic) in manufacturing has provided a unique opportunity to obtain up-to-date information for making timely process correction decisions. At-line methods provide near-time information without the need for elaborate process control interfacing upfront. This approach works well for batch processing applications or unit operations when process decisions can be made during a defined operation. Effective use of at-line methods includes the measurement of raw materials, premix batches, or quality check point monitoring before finished product is sent to the finishing lines.
However, there is a unique benefit gained in automating spectroscopic measurements and that is the ability to use the information for real-time control of the process which significantly tightens the variability in dosing critical ingredients and reduces the variability in other critical product attributes, such as product moisture.
While the justification for implementing PAT often comes from the ‘realised cost savings’, other benefits of PAT have been identified that are, in many instances, even more important to the bottom line. This area includes the product and process understandings gained that ultimately can improve the effectiveness of an organisation’s quality plan and at lower cost. This paper discusses ways that PAT can reduce the manufacturing costs in the Consumer Products industry as well the benefits found with the implementation of PAT in manufacturing.
FDA has fueled the drive to implement PAT
A driver behind the FDA’s involvement in process analytical technology is the underlining ability of PAT to help drive the costs of manufacturing down particularly in pharmaceutical manufacturing. This is accomplished by spending the appropriate amount of time up front to understand product and processes and to implement technology that can monitor and control quality as product is being made1. The PAT framework focuses on understanding and controlling the manufacturing process2. According to the FDA, a process is considered well understood when: 1) all critical sources of variability are identified and explained; 2) variability is managed by the process; and 3) product quality attributes can be accurately and reliably predicted over the process design space established.
In the early stages of product development, the use of automated reaction vessels in conjunction with in-situ monitoring tools (FTIR, NIR, Raman etc), along with statistical and chemometric modelling can provide important insight and understanding of product & process chemistry. This upfront investment of time may ultimately shorten the time to marketplace for new products as a better understanding of the chemistry before scale up and product launch is gained. When PAT tools are used during scaled-up operations, such as in a pilot plant, the additional information gained is often used for optimising the making of products in larger scale quantity. The impact that mixing time, mixing temperature and order of addition has on final product quality can also be evaluated with the goal of defining process specifications for manufacturing. Finally, manufacturing PAT is used for two reasons: quality monitoring and control. In the Consumer Products industry, where the cost of packaging can be relatively high, the use of PAT throughout manufacturing to ensure good quality product is sent to the filler stations can have a large impact on manufacturing costs.
PAT impacts the cost of quality
There are many ways to measure the effectiveness of a manufacturer’s quality plan. One way is to calculate the number of product nonconformities produced per year. Process capability (Cpk/Ppk), consumer and customer complaints and returns, and product defect ratings can also be used to measure the effectiveness of a manufacturing process. While these methods have value in measuring quality, the one measure that has the most impact on the financial success of an organisation is the cost associated with making good quality product3.
Quality cost models have been studied since the early 50s4. Quality costs fall into four major categories; prevention, appraisal, internal failures and external failures (see Table 1). In traditional manufacturing processes, the cost of quality per unit of good produced is unacceptable, not very competitive and inherently has more risk in manufacturing low quality product3. In addition, the process of making process corrections is too slow as testing is done after the product has been packaged and ready to ship, i.e. testing to document quality.
In manufacturing, when PAT tools become part of an environment that drives quality improvement, the Quality Cost Diagram mirrors the quality improvement found in Zero Defect Models4,5. With the implementation of new technology that reduces the variability and internal failures throughout the entire manufacturing process, the overall statistical quality level is increased to 5 sigma or higher compared with the 2.5 sigma operation afforded by the Traditional Quality Cost Model. In addition, the cost to achieve almost 100% conformance is now finite and achievable4,5. However, for PAT to truly be effective in improving quality requires a Control Plan that focuses on using the data collected for making process decisions and corrections. The control plan requires periodic review of the data trends and a continuous improvement initiative to enhance the learnings from the process.
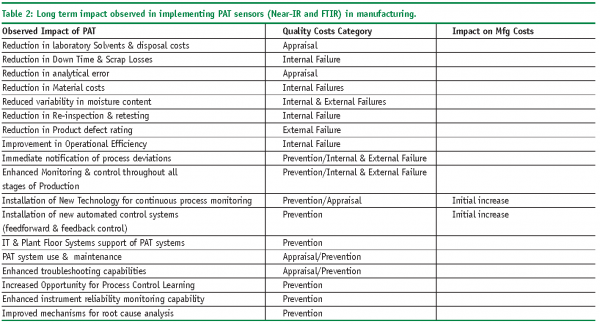
Table 2 shows the long-term impact we have observed with implementing PAT sensors (FTIR & Near IR) in manufacturing. The quality cost category is listed along with whether the observed impact decreased or increased the cost of quality. While PAT will increase prevention and appraisal costs over the short term, longer term these costs will tend to decrease over initial levels. On going maintenance costs and need for local experts and possibly regional experts may also impact the initial savings realised from PAT.
However, while implementation of quality control check points throughout critical stages of manufacturing will require an upfront investment of resource and capital, the goal is to achieve a balance that yields better quality at lower cost.
Another longer-term benefit of utilising PAT tools to enhance factory reliability is the potential for real-time release of products. The combination of reduced inventory costs and lower quality costs will drive stronger financial returns for investors. By demonstrating up front superior product and process knowledge, PAT tools may also help companies obtain NDA approvals faster thus shortening the product delivery timeline for new regulated products.
Benefits of using PAT in consumer product manufacturing
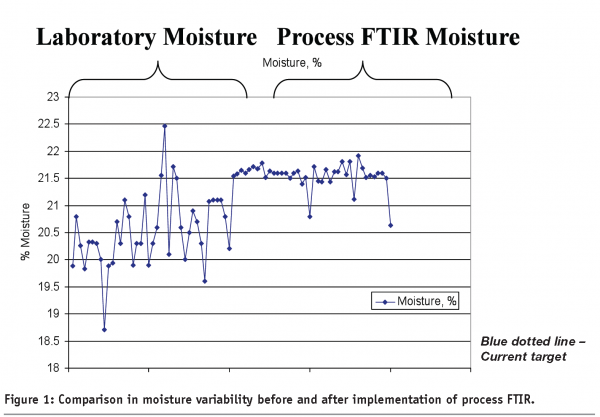
One of the fundamental changes that PAT has provided across multiple applications is the ability to control moisture more efficiently and with better accuracy and significantly better precision than traditional laboratory methods (see Figure 1). This small change alone can make a big impact in the organisation both by improving quality control and by driving down manufacturing costs. Moisture monitoring and control can be performed either by Process Near IR or by Process FTIR. Why is moisture control so important in Consumer Products manufacturing operations? First, there is a direct link between the performances of the finishing lines with the moisture content in many products. If the product is too wet or too dry it can impact the appearance, look, or feel of the product. In certain situations, a product that is too wet or dry can also shut down a finishing line because of the impact on throughput and require manufacturing to clean the lines or scrap poor quality product. Secondly, moisture control is important for improving profitability. There is an inherent relationship between process variability and manufacturing costs7. As process variability goes up so will the cost of manufacturing and as variability decreases manufacturing costs will tend to decrease. Thirdly, and most important, good moisture control is important in ensuring the product quality remains within specification limits. The typical product quality attributes affected by moisture can include any or all of the following; 1) appearance, 2) efficacy, 3) performance, and 4) microbiological activity.
Impact on process capability
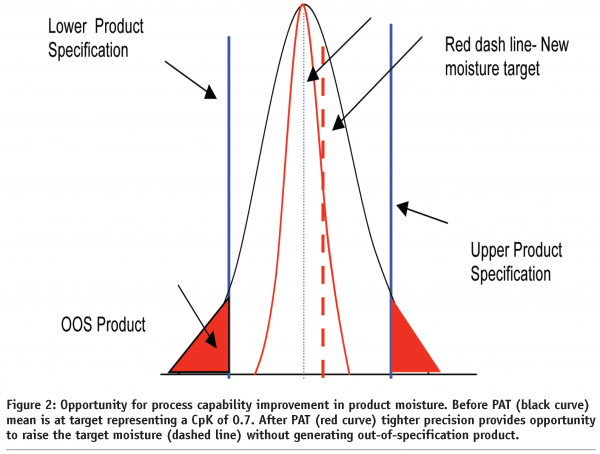
Without in-process monitoring and control, a typical distribution plot of moisture content will fall within ± 3 standard deviation units of the mean as represented by the black distribution curve in Figure 2. Process capability (CpK) in this situation can range anywhere from 0.4 to 0.7 depending on how well the process mean is centred around the target. In this example, the distribution in moisture is centered around target and 4% of the total product manufactured is out of specification (red triangles). This out of specification event represents lost revenue in the form of scrap loss, disposal cost, down time, rework time, reanalysis and an overall reduction in manufacturing efficiency.
With in-process tools, such as Near IR or FTIR, to monitor moisture along with feed forward and feedback control, we have found that the process capability can be significantly tightened to a value of 1.3 and often times higher with almost no incidents of product going out of specification as depicted by the red distribution curve. When the process variability is reduced, we have the ability to raise or lower the target level with assurance that the product will not be out-of-specification. In both moisture control and active ingredient applications where the cost of a raw material is very low or very high, the ability to move the target up or down even 0.5% can generate millions of dollars in cost savings. In addition, when the calibration is done properly, additional cost saving benefits can be obtained from these automated systems in that they can be used to quickly optimise processing conditions during startup and during changeover between formulas.
Near IR has become the workhorse in manufacturing
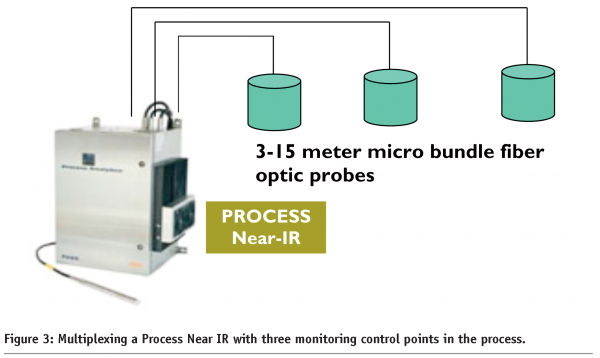
The use of Near IR is a good example of how PAT tools can make an impact in driving down the cost of quality. The motivation to use Near IR is driven by the need to obtain rapid information at various stages of manufacturing. Establishing quality check points, where trained operators can test products at various stages of manufacturing creates an opportunity to simplify operations and pushes the cost of quality lower by attacking the out of specification situation when they are generated. When Process Near IR is used with fiber optic probes and multiplexed for control point monitoring of multiple dryers or mixing tanks (see Figure 3), the cost of implementing new analytical equipment and automated control hardware in the plant becomes much easier to justify. Additionally, when the unit operation is automatically controlled, resources can be diverted to other operations thus improving overall operational efficiency.
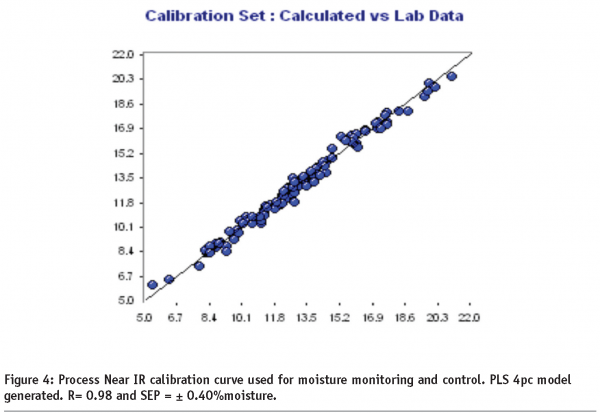
To minimise longer term implementation and support costs, particularly for applications that are utilised in multiple manufacturing facilities, the development of a global calibration curve is a good approach provided the variables introduced do not degrade the overall accuracy in the measurement. In order to develop a global calibration curve that can be transferred easily among sites, calibration design variables must be chosen that reflect the major variables encountered. The calibration curve shown in Figure 4 is a global calibration curve that incorporates multiple process variables. The calibration development was performed in a pilot plant scale operation and included variables such as fiber optic probe length, product temperature, moisture content, and variability in major ingredients. The calibration of Process instruments should also be developed over a period of months, in order to introduce some of the non-determinant errors that are found related to the age and condition of the analytical instrument, processing hardware, and raw materials. In this example, a calibration design strategy was used incorporating the above variables and the calibration spectra were modelled using partial least squares (PLS) regression with 2nd derivative and SNV (Standard Normal Variate) preprocessing. When calibration strategies are properly designed, a single calibration curve can be successfully transferred to multiple sites (in this example six different sites -ten control points) with little more that a bias adjustment.
Final remarks
Implementing PAT tools can impact manufacturing by improving product quality and in reducing manufacturing costs, and improving overall operational efficiency. The use of PAT goes beyond simply using the tools as a means for rapid testing of samples. PAT is a holistic approach to manufacturing quality control that incorporates many tools including analytical monitoring, use of statistics and root cause analysis, microbiology, process automation and engineering. Applications are plentiful and can range from understanding ingredient interactions through improved dryer control and release testing. In some instances, PAT owing to the increase in sampling, have demonstrated success in detecting the initial signs of process equipment failure6.
In many respects the initial impact that PAT has had in reducing manufacturing costs has opened new avenues and uses for these tools particularly in the earlier stages of research. It is in early research and product development where PAT can make an even larger business impact in the Consumer Products industry by increasing the speed in which new products are brought to the marketplace.
Acknowledgments
I want to thank P. Lopez for his insightful discussions on Zero Defect modelling and ambitious use of Near-IR in manufacturing. His experience and drive to implement PAT has been a key factor in the successful rollout of Near IR in his region. The implementation of PAT in manufacturing requires multidisciplinary support. I would like to recognise G. Hawes, I. Kamadan and D.Simmonds for their engineering accomplishments in automating the Process Near IR methods developed. I also would like to extend my sincere thanks to M. Knapp andP. Vincenti for their support of PAT.







References
- Guidance for Industry APT – A Framework for Innovative Pharmaceutical Manufacturing and Quality Assurance Guidance. www.fda/gov/cder/gmp/index.htm.
- A. Afnan. PAT: What’s in a Name?. J. PAT. Vol1. Issue 1 Sept./Oct. 2004.
- R. Dovich. Quality Manager, Field Fastener Supply Company Quality Costs- The Only Measure That Really Counts. Perspectives on Quality. Vol 1 No. 1.July 2002.
- Jurans Quality Control Handbook – Chapter 4. – Quality Costs
- S. V. Volsem. A Method for Determining the Cost Efficient Inspection Strategies for Multistage Production Systems. Univeristy of Gent. ISBN 90-8578-055-1. 2006.
- Internal communication – D. Cabrera, CP Engineering
- Jurans Quality Control Handbook – Chapter 16. – Manufacturing Planning.


