The role of HTS in eADMET profiling
Posted: 28 September 2006 | | No comments yet
Historically (until the late 1980s), compounds discovered by phenotypical in vivo screens were at least characterised with implicit ADMET data. An attractive compound in these test systems was available at the (usually unknown) target; had a minimal toxicological profile (the animal did not die immediately) and gave phenotypical (High-Content) information in the animal used for the experiment.
Historically (until the late 1980s), compounds discovered by phenotypical in vivo screens were at least characterised with implicit ADMET data. An attractive compound in these test systems was available at the (usually unknown) target; had a minimal toxicological profile (the animal did not die immediately) and gave phenotypical (High-Content) information in the animal used for the experiment.
Historically (until the late 1980s), compounds discovered by phenotypical in vivo screens were at least characterised with implicit ADMET data. An attractive compound in these test systems was available at the (usually unknown) target; had a minimal toxicological profile (the animal did not die immediately) and gave phenotypical (High-Content) information in the animal used for the experiment.
Following the molecular biology revolution in the 1980s, targeted approaches became feasible. As a straightforward consequence, HTS-, combi-chem- and later genomic approaches were implemented.
In the early days of HTS and combinatorial chemistry, the major challenge was to make these technologies operational to a reasonable extent; however, the data produced from these approaches often lacked quality. For instance, in HTS, in many cases, hit-evaluation was solely based on a % inhibition value at one-test concentration used in the screen. In most cases the compound libraries used in these early HTS-screens were far from drug- or lead likeness1.
In summary, these issues (and also poor reliability of target validation approaches) resulted in a poor outcome of targeted approaches in clinics.
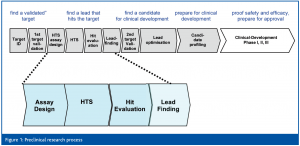
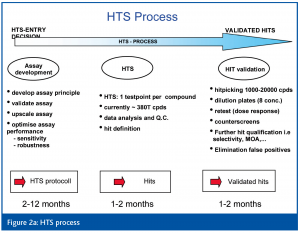
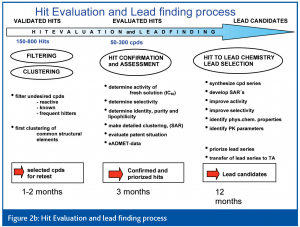
Learning from 10+ years of experience, it is now obvious that HTS no longer means simply running an assay on a robotic system, but rather that the HTS process has evolved to include several steps (Figures 1, 2a, b).
Today, it is accepted that a professional priorisation of hits during hit evaluation (HE) is of central importance for success of lead finding (LF) and lead optimisation (LO). It is likely that those organisations that have been able to integrate HTS with effective Hit to Lead capabilities are producing the greatest flow of LO projects and Candidate Drugs2.
It is especially true that early interception of key eADMET parameters can have a significant impact on later-stage success and timelines.
However, this requires a change of at least two paradigms:
- Potency is no longer the dominating driving force during HE and LF since optimisation of eADMET properties is often more challenging than optimising potency and selectivity3
- Analysis is no longer based on single compound properties but on properties of compound clusters. This is of central importance, since different compounds within a cluster might differ with respect to eADMET properties and thus might lead to false positives or false negatives. In addition, from this information chemists might develop a strategy to address potential liabilities of the respective compound cluster
The huge number of compounds to be evaluated in this scenario clearly drove in silico methods for prediction of basic eADMET properties in this early stage4,5. However, despite huge efforts in this field, the prediction accuracy of many approaches is still under discussion. Thus, there is a danger that interesting series of compounds could be filtered out. Thus, these in silico data were often not accepted for decision making6.
This new way of multidimensional evaluation on HTS hit sets, which are often composed of several thousands of hits within dozens of hit clusters, clearly requires new experimental workflows in the HE (and LF) part of the drug discovery process.
Towards an implementation
Basically, several aspects have to be considered for implementation:
a.) All tests should address common liabilities of compounds and must be relevant for decision making
b.) Avoid false positives. False negatives, however, might be accepted in this early discovery stage: Finding 70 per cent of cluster liabilities will have significant impact on the outcome of your discovery process!
c.) Try to achieve compatibility with models established in your organisation. This will greatly improve the acceptance of these tests within your organisation All models must fit into standard workflows. Compound logistics, minimal hand on times for testing and compatibility with existing IT solutions should be considered. Since the requirements on turnaround times are not very stringent in the hit evaluation phase, batch operation becomes possible. This allows efficient use of automation solutions used in HTS
This article gives three examples to illustrate HTS capabilities for evaluation of basic physicochemical data (solubility), for basic toxicity (cell toxicity and cell proliferation) and on basic eADME data (P450 inhibition).
However, it should be noted that several additional assays in the eADMET field have been run or may run in a HTS (or MTS) mode. These include LC/MS(/MS) methods for assessment of metabolic stability (and metabolite ID) of the compound and for assessment of compound purity and logP values, PAMPA assays for estimates on passive compound permeation, plasma protein binding, genotoxicity, liver toxicity, etc. and may also include phenotypic data, which now become feasible by High Content Screening approaches7.
Solubility by laser nephelometry
Solubility issues are a widespread problem in drug discovery since minimal solubility requirements are indispensable, not only for the determination of activity and most eADMET parameters, but also to allow acceptable oral absorption8,9. Laser nephelometry is a well-established and fast method to measure kinetic solubility10. However, it should be kept in mind that, in principle, solubility is a thermodynamic and not a kinetic parameter. Thus, differences between different methods to measure solubility might occur (due to supersaturated solutions or since there is no crystal lattice effect to disrupt compounds added from DMSO solutions).
Compounds diluted in DMSO were pipetted in aqueous buffer at different concentrations and light scattering was measured. Upon precipitation of compounds a significant increase in light scattering amplitude occurs.
In contrary to traditional thermodynamic techniques, nephelometry allows full integration into a high throughput robotic system. Therefore, in principle, the solubility of several ten-thousands of compounds can by determined per day.
However, so far, the nephelometric method has been considered to be inapplicable for the 384-well or even 1536-well format11,12.
In accordance with observations11,12, any imperfections at the base of the plate such as dust, scratches and bubbles resulted in false positives, especially in smaller volumes.
To overcome this problem, all plates were pre-scanned and the buffer was filtered and ultrasonicated. Thereby the percentage of false positives caused by imperfections of the microtiter plate or from dust or air bubbles could be reduced to 0.3 per cent. In addition, significant mixing efforts and an incubation time of the compounds of 4 h could reduce kinetic effects on solubility values.
Statistical analysis of solubility values obtained by this method and also throughput analysis indicated that the most efficient way would be to simply screen the complete library (several hundred thousands of compounds) at one concentration (10 μM) and thereafter evaluate the hits at different compound concentrations (30 μM to 1,11 μM) thereby broadly covering the relevant test concentrations used for HTS screening campaigns.
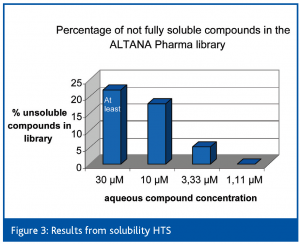
Primary solubility HTS was performed in phosphate buffer at ph 7.4 at 20°C at a DMSO concentration of 1 %. Overall, approximately 18 % of the compounds within the AP screening library gave significant light scattering signals, which indicate limited solubility under these conditions.
Almost all compounds within dose-dependent retesting showed a dose dependence of scattered light intensity, the hit confirmation rate was about 96 %.
As can be seen in Figure 3, the number of insoluble compounds strongly decreased at lower compound concentrations.
All data are stored in our HTS database and can be accessed by each chemist for further evaluation.
P450 interaction
Bioavailability, activity, toxicity, distribution, final elimination and also drug-drug interactions all depend on metabolic biotransformation13.
Since P450 enzymes are responsible for >90% of the metabolism of all drugs, HTS assays for evaluation of potential liabilities of compound clusters are of significant interest in the early stage. Since Cyp3A4 and Cyp2D6 are the most important enzymes involved in biotransformation of drugs, we decided to focus on these enzymes. Assay development was based on Invitrogen’s Vivid® CYP450 Screening Kits. The source for CYP450 were BACULOSOMES®, microsomes from baculovirus-infected insect cells and co-expressing different CYP450s.
In principle, this assay can be easily adapted to run on a fully-automated test system. However, poor enzyme stability prevented 24h automated HTS operation under standard conditions and thus required significant biochemical efforts to overcome this problem. Also, different substrate binding sides and a variety of inhibition modes of these enzymes make assay validation challenging.
In the primary HTS we initially screened a compound library of several 100k chemical substances in 384-well plates. The compound concentrations were 1μM for the Cyp3A4 and 7μM for the Cyp 2D6 enzyme.
In a secondary high throughput screening all compounds with an inhibition greater than 70% were retested in dose response curves in eight concentrations.
For the Cyp2D6 enzyme, approximately 0.6% of all compounds inhibited this enzyme with an IC50 of less than 1μM, for Cyp 3A4, approx 5.7% of the compounds had an IC 50 of less than 1μM.
These data, which are stored within the HTS database are now a vital basis for the evaluation of compound clusters, but also serve as an excellent basis for the development of models predicting Cyp3A4 and Cyp2D6 interaction14.
Cellular toxicity
In general, cellular toxicity may be assessed both on dividing and resting cells and may, depending on the mode of action, occur a few hours after compound addition or several days after addition of compounds.
Depending also on the mode of action, basic cellular toxicity can be measured by several approaches: Cellular morphology, membrane integrity, apoptosis, changes in mitochondrial potential, mitochondrial metabolism, HCS approaches, etc.
Since most cellular toxicity modes finally affect metabolism and mitochondrial damage represents a prominent source of failure during drug development, we decided to focus on this type of assessment of cellular toxicity.
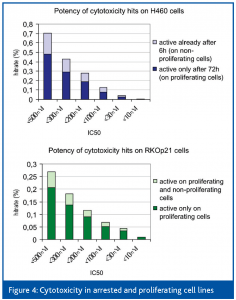
Proliferating H460 (lung carcinoma) and RKOp21 (colon carcinoma) cells were incubated with the compounds and after 72 hours, alamarBlueTM (BioSource International, Inc., USA) metabolism was measured as an indicator of the number of viable cells. IC50 values of the compounds that inhibited cell growth were determined on proliferating and non-proliferating H460 and RKOp21 cells to discriminate toxic effects on cell proliferation from effects on cell viability.
As a cellular model for non-proliferating cells we used H460 cells in a 6-hour secondary assay (where no proliferation can be expected) and the arrested genetically engineered RKOp21 cell line15.
RKOp21 cells contain an ecdysone inducible p21waf1 expression system consisting of two vectors. The regulator vector encodes two constitutively expressed proteins; RXR and the ecdyson receptor fused to the VP16 transactivator. Upon addition of the ecdyson derivative ponasterone A, these proteins dimerize and bind to the promoter region of the second vector encoding the CDK inhibitor p21waf1. VP16 then drives the expression of p21waf1, which arrests the cells in cell cycle phases G1 and G2.
Using these cell lines, several hundred thousand compounds were screened at a compound concentration of 2μM.
As can be seen in Figure 4, hit rates were in the range of 2.5 to 5.7 %. Approximately 25 % of all hits were also active under non-proliferating conditions.
Summary
“Fail early, fail cheap” and “Pick up the winners early” has become a mandatory paradigm within most companies and has become the prominent driver for translational medicine approaches, for High Content Screening approaches but also for early ADMET and safety efforts.
eADMET profiling of compounds during hit and lead generation has become a vital process in the drug discovery process. It is part of a multidimensional optimisation process, which is now established within most pharmaceutical companies and may be implemented within the HTS environment.
It may be predicted that these approaches will help to close the productivity gap, which was largely caused by the technology revolution in the late 1980s and 1990s (from phenotypical ‘world’ to targeted ‘world’). In the end, merging the ‘goodies’ from both worlds (target knowledge may significantly help during Lead Optimisation) and completing the learning curve, ultimately we may see a new golden area in pharmaceutical research.





References
- Oprea et al., 2001, J. Chem. Inf. Comput. Sci., 41, 1308ff.
- Davis et al., 2005, Curr. Top. Med. Chem., 5, 421ff.
- MacCoss et al., 2004, Science 303, 1810ff.
- Wunberg et al., 2006, DDT 11, 3/4, 175ff.
- Tetko et al., 2006, DDT 11, 15/16, 700ff.
- Stouch et al., 2003, J. Comp. Inf. Comput. Sci. 22, 422ff.
- Diaz et al, 2006. Eur. Pharm. Rev. 4, 38ff.
- Review see for instance: Lipinski 2003 in Drug Bioavailability, Wiley-VCH, Van de Waterbend, Lennernäs, Artursson ed.
- Li Di et al, 2006, DDT 11, 9/10, 446 ff.
- Teague et al., 1999, Angew. Chem. Int. Ed. Engl. 38, 3743ff.
- Dehring et. al., 2004, J. of Pharm. and Biom. Anal. 36, 447-456
- Bevan CD., Lloyd RS., 2000, Anal. Chem., 72, 1781-1787
- Cruciani et al., 2005, J Med Chem, 48(22), 6970 ff.
- Soars et. al., 2006, Xenobiotica, 36(4), 287ff
- Schmidt et al., 2000, Oncogene 19, 2423-2429


