The rise of Raman
Posted: 22 August 2005 | | No comments yet
Traditionally, analyses in pharmaceutical research and industry were often performed using Nuclear Magnetic Resonance (NMR) or Mass Spectrometry (MS). However, researchers are aware that Raman Spectroscopy possesses advantageous characteristics for the pharmaceutical world.
Traditionally, analyses in pharmaceutical research and industry were often performed using Nuclear Magnetic Resonance (NMR) or Mass Spectrometry (MS). However, researchers are aware that Raman Spectroscopy possesses advantageous characteristics for the pharmaceutical world.
Traditionally, analyses in pharmaceutical research and industry were often performed using Nuclear Magnetic Resonance (NMR) or Mass Spectrometry (MS). However, researchers are aware that Raman Spectroscopy possesses advantageous characteristics for the pharmaceutical world.
The Raman effect was first observed in 1928 by Sir C.V. Raman. These early experiments were carried out using focussed sunlight and filters and relied on visual observations of colour changes in the scattered light1. A few years later, with the use of a mercury lamp and a spectrograph, Raman recorded spectra of several liquids, including benzene and CCl41.
The first commercial Raman instrument was introduced in 1953, making Raman spectroscopy available to a wider audience2. The interest in Raman spectroscopy flourished even more in the mid-1960s with the introduction of the first commercial reliable continuous wave gas lasers. The introduction of high-quality holographic filters (1970’s), diode array detection (1980’s), fibre optics (1980’s) and the coupling of microscopes to Raman spectrometers (1980’s) expanded the range of the applications3.
Dispersive versus Fourier transform Raman spectroscopy
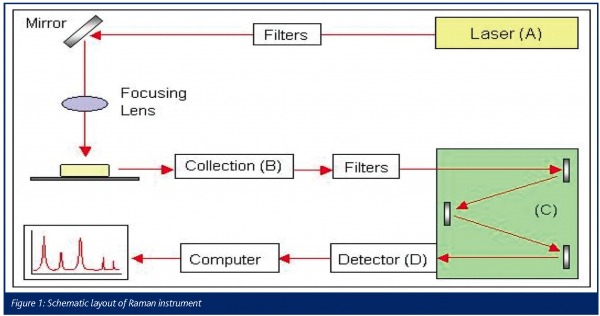
A Raman spectrometer, as shown in figure 1, basically consists of a light source (A), collection optics (B), a dispersing optical element (C) and a detection system (D).
Two major technologies are used to collect the Raman spectra: dispersive and Fourier transform (FT) Raman spectroscopy. The major difference between the two techniques is the way Raman scattering is detected and analysed4.
Typically, the lasers used in dispersive Raman spectroscopy are in the visible region and have wavelengths of for instance 785 nm (diode laser), 633 nm (He-Ne) or 532 nm (frequency doubled Nd: YAG). In general the lasers used in FT-Raman spectroscopy have a wavelength of 1064nm (Nd:YAG)4,5.
The spectral analysis in dispersive Raman spectrometers is done by using a grating4. The spectrum is produced by rotating the grating so that the desired spectral window is presented to a multi-channel detector (e.g. charge-coupled-device, CCD)1. FT-Raman spectrometers use interferometric optics to collect the light from the sample, allowing collection of all the wavelengths simultaneously (all wavelengths combined)2,3.
The pro’s and con’s
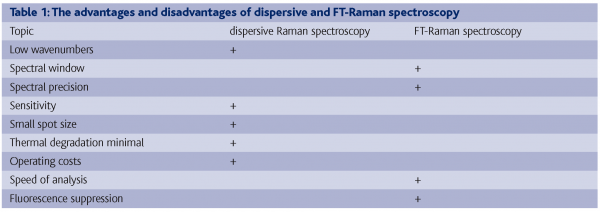
The advantages and disadvantages of dispersive and FT-Raman spectroscopy are shown in table 1.
One of the disadvantages of dispersive Raman spectroscopy is that there is a low spectral precision caused by motion of the grating (or thermal drift), which can degrade precision; when extreme stability is requested an extensive calibration may be needed6. The interferometer used with FT-Raman ensures high wavelength precision, which allows easy spectral subtraction in order to remove background or solvent features3. Another disadvantage of dispersive Raman spectroscopy is that the influence from fluorescence is generally larger with dispersive Raman than with FT-Raman since the latter uses a longer laser wavelength.
A disadvantage of FT-Raman spectroscopy is that the low-frequency region of the spectrum is often not available, as well as the cost of running an experiment with FT-Raman spectroscopy which is higher than dispersive Raman spectroscopy due to the use of liquid nitrogen for the detector.
It is clear that the choice between dispersive and FT-Raman spectroscopy depends on the samples needed to be analysed, since both techniques have specific advantages and disadvantages.
Applications in the pharmaceutical research
Drug identification of the active agent in tablets as well as excipients
A study by Bell et al.7 demonstrated that dispersive Raman spectroscopy (810 nm laser wavelength) can be used to distinguish between ecstasy and various other phenethylamine ecstasy analogues, commonly seized in the UK. The spectra could be used to distinguish between the chemical-similar substances such as isomers and polymorphic/hydrated forms. Within an hour 20 samples could be analysed, showing that Raman spectroscopy could be used as a fast and non-destructive method for drug identification. Further research on this subject8 showed that the variation in composition of the tablets could be identified, which is useful for tracing drug distribution networks.
Polymorphism
Polymorphism is important for the pharmaceutical industry since it can affect the chemical stability, the behaviour in pharmaceutical formulations, such as the tendency to absorb water, the solubility and thus the bioavailability9. The majority of the polymorphism experiments are performed by FT-Raman spectroscopy. For instance the quantitative analysis of Mannitol polymorphs by Roberts et al.10 in which they studied binary mixtures of beta and delta Mannitol. Different mixtures were studied and the results indicate that levels till 2 per cent of beta Mannitol could be quantified.
Imaging/Mapping
Raman spectroscopy can be used to analyse and evaluate the content of pharmaceutical products as well as the homogeneity of the tablets. There are two different methods. Imaging is accomplished by illuminating the sample and imaging the scattered light (the so-called wide field illumination)11 onto an imaging two-dimensional array detector12. Mapping involves recording a spectrum at each point of a grid for well-defined spatial locations of a sample12.
A chemical image is the spatial distribution of a compound of interest, based on its intensity at a uniquely assignable Raman shift11. Before starting imaging this Raman shift should be known in advance. One of the main advantages of imaging is the fast production of images. In a study by Sasic et al.11 a comparison is made between different data processing ways for the chemical images of pharmaceuticals. Raman spectroscopy with a laser at 782 nm was used to create an image of pharmaceutical beads, which consisted of four different layers. Within 60 seconds, acceptable images were created11,showing the speed of recording images of pharmaceuticals.
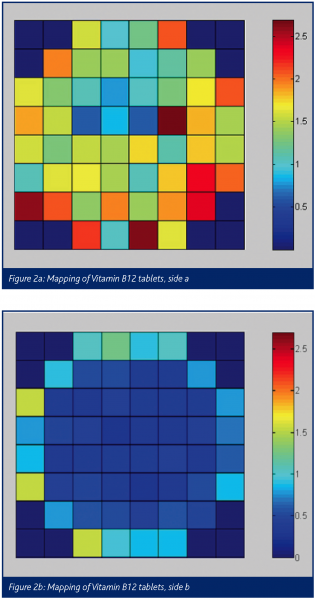
Mapping can be used to determine the homogeneity of an ingredient in, for example, a tablet. Spectra are taken from the entire surface of the tablet, for instance a 10×10 map or higher. Specific software allows mapping of the chemical composition of the tablet by rationing characteristic band intensities. An example of the mapping is the distribution of vitamin B12 trough tablets (own research) by Raman spectroscopy with a diode laser (785 nm). In this case a 10×10 map (steps of 1 mm) was created of both sides of the tablets (figure 2) and the colour of the map corresponds with the peak intensity, corresponding with the concentration.
Industrial applications
One of the advantages of Raman spectroscopy is that measurements can take place through, for instance, blister packages or drug vials. This is a major benefit for the use of Raman in industry. A dispersive Raman spectrometer (laser wavelength 488 nm) was used for a study by Powell on sealed drug vials, for a quick headspace analysis14. Drug vials with pharmaceuticals that decompose when in contact with oxygen are packaged under nitrogen atmosphere. Raman spectroscopy was able to detect the presence of oxygen in the headspace of the vial.
Raman spectroscopy has been used to measure the concentration of bucindolol in gel capsules15 inside the blister packages with dispersive (micro)Raman spectroscopy (785 nm laser wavelength). FT-Raman spectroscopy has also been used for the in-line monitoring of a pharmaceutical blending process16. The blending process of diltiazem hydrochloride pellets and paraffinic wax beads, was monitored and the results of these experiments were confirmed by HPLC16. These three experiments demonstrate the potential of Raman spectroscopy in the pharmaceutical industry.
Quantitative analysis
In the last few years more and more papers are published on quantitative analysis of the active ingredient in tablets. For example, a study performed by Izolani et al.17, describes the quantitative determination by using FT-Raman of dipyrone (an antipyretic drug) in different tablets. A drawback of this study was that the tablets had to be grinded, homogenized and pressed again to make tablets of 250 mg, disregarding the absence of sample preparation that Raman spectroscopy usually requires. A similar approach was also used for the determination of Ciprofloxacin in pharmaceuticals18 in which different concentrations of Ciprofloxacin were, mixed with maize starch and pressed into tablets to be used as standards. The commercial tablets were grinded as well and pressed into 300 mg discs. Many more articles20-23 are available about the quantitative measurements of pharmaceuticals with the use of FT-Raman spectroscopy.
The majority of the quantitative analysis has been established by FT-Raman spectroscopy. However, some quantitative studies have been performed by dispersive Raman spectrometry. For instance in the study by Fauilloux et al.24 a laser with a wavelength of 514 nm was used for the quantitative measurement of the degradation of retinol (vitamin A). These results were compared with HPLC results and differed only 8 per cent. Quantification with dispersive Raman spectroscopy generally needs more time than FT-Raman spectroscopy, since the spectra have to be calibrated against standards, which for this research was done with the 992 cm-1 Raman band of benzene24.
Conclusion
This review has provided an overview on pharmaceutical applications of Raman spectroscopy. It shows that Raman spectroscopy is a well established method for quantitative as well as qualitative measurements. Gradually Raman spectroscopy becomes a more commonly used research method in pharmaceutical studies.
In this review the use of dispersive and FT-Raman spectroscopy are described for different pharmaceutical applications. Both techniques have their advantages and disadvantages: the choice between the two techniques mainly depends on the specific research that has to be carried out.


References
- D.J. Gardiner, P.R. Graves, Practical Raman Spectroscopy, Springer-Verlag, Berlin, 1989
- M.J. Pelletier, Analytical Applications of Raman Spectroscopy, Blackwell Science, England, 1999
- J.G. Grasselli, B.J. Bulkin, Analytical Raman Spectroscopy, John Wiley & Sons, New York, 1991
- T.Vankeirsbilck, A. Vercauteren, W. Baeyens, G. Van der Weken, F. Verpoort, G. Vergote, J.P. Remon, Trends in Analytical Chemistry, 21, 12, 869-877 (2002)
- J.J. Laserna, Modern Techniques in Raman Spectroscopy, John Wiley & Sons, England, 1996
- D. Hutsebaut, P. Vandenabeele, L. Moens, 2005, The analyst (2005) accepted,
- S.E.J. Bell, D.T. Burns, A.C. Dennis, J.S. Speers, The Analyst, 125, 541-544 (2000)
- S.E.J. Bell, D.T. Burns, A.C. Dennis, L.J. Matchett, J.S. Speers, 125, 1811-1815 (2000)
- F.W. Langkilde, J. Sjöblom, L. Tekenbergs-Hjelte, J. Mrak, Journal of Pharmaceutical and Biomedical Analysis, 15, 687-696, (1997)
- S.N. Campbell Roberts, A.C. Williams, I.M. Grimsey, S.W. Booth, Journal of Pharmaceutical and Biomedical Analysis, 28, 1135-1147 (2002)
- Sasic, D.A. Clark, J.C. Mitchell, M.J. Snowden, The Analyst, 129, 1001-1007 (2004)
- J.R. Schoonover, G.J. Havrilla, P.J. Treado, The internet journal of vibrational spectroscopy, 3, 3
- J. Breitenbach, W. Schrof, J. Neumann, Pharmaceutical research, 16, 7, 1109-1113 (1999)
- L.P. Powell, A. Campion, Analytical Chemistry, 8, 11, 2350-2352 (1986)
- T.M. Niemczyk, M.M. Delgado-Lopez, F.S. Allen, Analytical Chemistry, 70, 13, 2762-2765 (1998)
- G.J. Vergote, T.R.M. De Beer, C. Vervaet, J.P. Remon, W.R.G. Baeyens, N. Diericx, F. Verpoort, European Journal of Pharmaceutical Sciences, 21, 479-485 (2004)
- A.O. Izolani, M.T. de Moraes, C.A.Téllez S. Journal of Raman Spectroscopy, 34, 837-843 (2003)
- S.G. Skoulika, C.A. Georgiou, Applied Spectroscopy, 55, 9, 1259-1265 (2001)
- R. Szostak, S. Mazurek, The Analyst, 127, 144-148 (2002)
- M.J. Pelletier, Applied Spectroscopy, 57, 1, 20A-42A (2003)
- T.R.M. De Beer, G.J. Vergote, W.R.G. Baeyens, J.P. Remon, C. Vervaet, F. Verpoort, European Journal of Pharmaceutical Sciences, 23, 355-362 (2004)
- R. Szostak, S. Mazurek, Journal of Molecular Structure, 704, 229-233 (2004)
- C.J. Strachan, D. Pratiwi, K.C. Gordon, T. Rades, Journal of Raman Spectroscopy, 35, 347-352 (2004)
- N. Failloux, I. Bonnet, M. Baron, E. Perrier, Applied Spectroscopy, 57, 9, 1117-1122 (2003)


