

Towards a comprehensive open source platform for management and analysis of High Content Screening data
Posted: 19 August 2010 |
As High Content Screening (HCS) has moved into the mainstream for biological and pharmaceutical investigations, a lag of well integrated pipelines for automated acquisition, management and analysis of HCS results turns out to be a bottleneck for fully leveraging the wealth of information contained in a screen and moving to higher throughput. For many applications, monolithic pipelines cannot deliver the flexibility and versatility needed. Laboratories and scientific service providers instead usually look into integrating components from both the open source world and the commercial software world into best-of-breed data pipelines. In this article, we will present two open source components that can be used as flexible and powerful building blocks for such a pipeline.
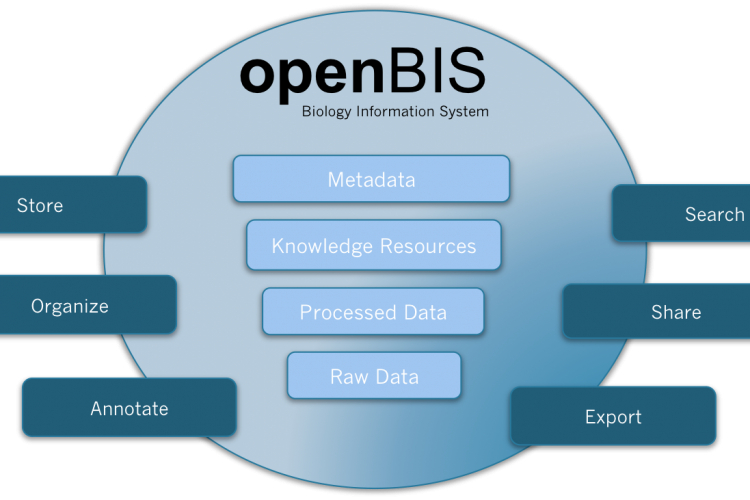
Figure 1 openBIS is a software framework for organising and annotating data and metadata from biological experiments, providing query and display functionality, integrating it into data pipelines and sharing it with other researchers
As High Content Screening (HCS) has moved into the mainstream for biological and pharmaceutical investigations, a lag of well integrated pipelines for automated acquisition, management and analysis of HCS results turns out to be a bottleneck for fully leveraging the wealth of information contained in a screen and moving to higher throughput. For many applications, monolithic pipelines cannot deliver the flexibility and versatility needed. Laboratories and scientific service providers instead usually look into integrating components from both the open source world and the commercial software world into best-of-breed data pipelines. In this article, we will present two open source components that can be used as flexible and powerful building blocks for such a pipeline.
Fluorescent microscopy has enabled multi – faceted insights into the detail and complexity of cellular structures and their functions for well over two decades. As an essential prerequisite for a systematic phenotypical analysis of gene function in cells at a genome-wide scale, the throughput of microscopy had to be improved through automation. HCS is defined as multiplexed functional screening based on imaging multiple targets in the physiologic context of intact cells by extraction of multicolour fluorescence information1,2. Simultaneous staining in three or four colours allows the extraction of various parameters from each cell quantitatively as well as qualitatively such as intensity, size, distance or distribution (spatial resolution). The parameters might be referenced to each other, for example, the use of nuclei staining to normalise other signals against cell number, or particular parameters might verify or exclude each other. Furthermore, these strategies do not exploit redundancies in genome-scale libraries, which typically contain two to four small interfering RNAs (siRNAs) per gene. As a complete HCS experiment might involve up to hundreds of plates, the image processing result sets can vary greatly in size. In addition to the obvious use of functional genomics in basic research and target discovery, such as finding siRNAs which target genes in significantly different patterns across samples, there are many other specific uses in this domain. To investigate patterns, a good data management and data mining package is required3.
Running an HCS data pipeline can be challenging for laboratories that are not yet used to handling high throughput measurement data and pipelines. Storing the data for a single screening run can easily exceed one terabyte of data and the required computation for object detection and classification of this run can consume many thousand CPU hours depending on the experimental setup and analysis algorithms used. Thus, careful planning of the required hardware and software is required to successfully complete a screening campaign, fully leverage the information contained in the data and drive decision for subsequent steps of a drug-discovery pipeline efficiently. In terms of IT hardware, common setups include a network attached storage device and a highthroughput computing cluster. With regard to software, it is usually required to employ a set of components including:
- a well-adapted image analysis algorithm for image segmentation and feature generation
- statistical algorithms for feature selection and classification
- a queuing system for spreading the CPU intensive work out to a cluster environment
- a workflow system to execute and monitor the different steps of the workflow together
- an information system for storing and querying all related data and metadata and for providing it to the other components
The types of data that need to be stored and made available for rapid searching and retrieval to successfully complete the data pipeline are:
- library information and plate layout
- microscope images
- image metadata (from the screening robot and microscope)
- segmentation results / identified objects
- feature vectors
- classification results
Special considerations need to be given to the interfaces between the software components, as for high-throughput measurements and pipelines, time-consuming and error-prone manual interventions need to be kept to a minimum. Furthermore, the user interface should be flexible and user-friendly. It is commonly considered necessary to offer separate user interfaces to the screening experts and HCS data analysts and to the scientists that use the results of the screening campaign subsequently. While the first group requires high flexibility but is able and willing to use a more complex computer interface, the latter commonly asks for a clean and straight-forward interface to access the results. The same applies for the software interface of a system used to make data from a HCS screen publicly available to the scientific community.
In this article, we will give an overview over two open-source components that are used to build HCS data pipelines: the information system framework openBIS (open Biology Information System)4 and the data mining package HCDC (High Content Data Chain)5 which is based on the KNIME workflow system6.
openBIS – Biology Information System
Overview
openBIS is an open source software framework for constructing user-friendly, scalable and powerful information systems for metadata and data acquired in biological experiments and data analysis pipelines. It features a modern web-based graphical user interface for scientists and an application programming interface (API) that can be used by system integrators to seamlessly integrate it into data pipelines and lab workflows. In its generic form, openBIS can handle any biological data type, put it into an experimental context and enrich it with metadata (Figure 1).

Figure 1 openBIS is a software framework for organising and annotating data and metadata from biological experiments, providing query and display functionality, integrating it into data pipelines and sharing it with other researchers
The particular strength of the framework, however, is that it can be easily extended and customised in many ways to work on particular data sets, enabling specific import functions, queries and visualisations that are required by biologists and bioinformaticians to make use of these data. Special care has been taken in the construction of the framework to make integration with existing data workflows and tools easy. The framework both provides hooks for extending the framework and interfaces for integrating it with other tools, which in our point of view is key to be able to use it in many different laboratory environments but avoid it becoming bloated and hard to manage. In collaboration with the Light Microscopy Center5 of ETH Zurich, a version of openBIS has been developed that caters for the needs of HCS laboratories or facilities.
The framework is developed by software engineers and scientists at the Centre for Information Sciences and Databases (C-ISD)4 at the Department of Biosystems of ETH Zurich in close collaboration with biologists and bio – informaticians at ETH Zurich, the Biozentrum of the University of Basel, the Swiss Institute of Bioinformatics and other academic groups in Switzerland and Europe. An earlier version of the software was developed together with a privately held biopharmaceutical company. Solutions based on openBIS are currently used by several research projects of SystemsX.ch, the Swiss initiative for advancing Systems Biology and in several research consortia funded by the European Union7. These days, extensions and integration solutions for biological research projects in SystemsX.ch are increasingly developed in the SyBIT community, an umbrella project initiated by SystemsX.ch to coordinate Systems Biology IT solutions.
openBIS as a HCS database and visualisation tool
To allow for querying and visualisation of both raw and analysed data from HCS experiments in an intuitive way, openBIS was extended and adapted to work with HCS data types. This software solution allows management of large amounts of image data, where the data can be reviewed, browsed, annotated, visualised and made available to analysis tools. In this section, we focus on the visualisation capabilities. Screening images as well as feature vectors from images can be accessed and viewed either from the plate viewer or directly from the data set viewers (Figure 2).

Figure 2 HCS metadata and data are linked which allows drill-in to detail information as needed. In this example, the user starts with a plate layout, from there looks at the images for one well, learns about what gene the well is connected to, gets more information about this gene from GeneCards and asks for an overview of other images measured where the same gene is suppressed
openBIS stores all incoming data as provided by the microscopes and data analysis pipelines in a hierarchical Data Store (Figure 3). Data that have to be transformed or indexed for subsequent rapid querying and retrieval are included in a relational Screening Database. All metadata is indexed for searching.

HCS specific visualisation options include showing:
- all images of a well (stitched)
- all images of a plate in a tabular view
- the layout (i.e. connection to genes) of a plate, providing details on mouse-over and
- thumbnail images on click
- the original images when clicking on a thumbnail
- selected feature vectors for a plate displayed as graphs
- all images related to a given gene in an experiment
- links to external gene databases
From the web GUI, the user can request a graphbased report for one plate, all plates or any subset of plates (Figure 4). The report supports the biologist in getting a quick overview, understanding the most important results intuitively and exploring potential correlations and relationships in the data. This way, she or he can identify samples with unusual biological properties or quality problems quickly.
openBIS for HCS takes advantage of many features that are available in the general openBIS framework, like flexible filter expressions, calculated columns and Excel export in tables, flexible searching for metadata and bulk export of selected data sets.

The Application Programming Interface for High Content Screening
In order to integrate openBIS with other components into a data pipeline, flexible interfaces for system integration are key. openBIS offers two types of interfaces to enable integration: drop boxes and a remote API.
A drop box (Figure 3) is a directory on the file system, possibly located on a remote file server or Network Attached Storage device, which is regularly polled by openBIS for new incoming data. If new data become available, openBIS will add them to its database. To this end, it needs to extract certain pieces of infor mation from the data, for example which experiment the new data belongs to. This is done by ‘plugins’ which can investigate the incoming data in any way needed and even consult separate data sources. By means of the same mechanism, metadata about the new data can be extracted and made available in the database for later querying.
For querying and obtaining data, openBIS offers a well-documented remote API in Java. For remote exchange, the API implementation uses the standard HTTPS protocol and an efficient binary exchange format. The interface supports an overview of all experiments as well as getting selected images and features for an experiment. Support for API-based upload of new data is currently being worked on. The API has been used to create connection nodes for KNIME that allow access to both screening images and feature vectors in HCDC workflows as described in the next section. Using the API, a proof-of-concept integration has been done with one of the leading commercial software systems for secondary HCS data analysis.
Secondary data analysis – workflow system
Many free and commercial software packages are now available to analyse HCS data sets, but for most applications, there is no single off-the-shelf software package that allows an answer to all scientific questions. Pipeline (workflow) systems become crucial for enabling biologists doing analysis of large scale experiments (Figure 5A). Currently, there are few workflow systems available in life sciences. Definitely, Kepler8, Taverna9, InforSense KDE10 and Pipeline Pilot11 are state-of-the-art workflow systems helping faster and efficient research in the life sciences domain.
The concept of workflow is not new and it has been used by many organisations over the years to improve productivity and increase efficiency. A workflow system is highly flexible and can accommodate any changes or updates whenever new or modified data and corresponding analytical tools become available. A workflow environment allows users to perform the integration themselves without involving any programming. Workflow systems are different from programming scripts and macros in one important respect. Other programming systems use text-based languages to create lines of code, while applications like HCDC-HITS uses a graphical programming language.
HCDC provides a workflow environment, an innovative technique with automated processes that requires minimal manual intervention. The algorithm uses pre-defined modules called nodes for individual tasks like data import, processing or visualisation. The user can select any number of nodes and design the data-flow between these elements (Figure 5B); HCDC thereby provides maximum flexibility for individual in silico experiments, allowing the user to calculate a hit list from raw data without any programming. HCDC is based on tools with a very broad scope: the KNIME4 (Konstanz information miner) and Eclipse software projects. This also allows the biologist to profit from nodes developed by the KNIME community for other purposes. Specific functionality of HCDC is explained below and in Figure 5C.

Figure 5 HCDC Platform A: Informatics elements behind High Content Screening B: Illustration of a workflow environment with nodes managing the data flow C: Summary of some functionality of HCDC-HITS
Library handling, library readers
These components allow for the registration of dilution and volume changes during liquid handling and the management of barcode information. Library information in many formats can be used to identify a sample within a library of RNAis or small compounds.
Microscope and image processing readers and viewers
HCDC can import microscopy images in all popular formats and retrieve data generated by image processing software for instance Acapella, Cellenger or BioApplications as well as open-source programs like CellProfiler.
Visualisation and export tools
Imported and processed data can be visualised by image or data browsers at each stage of the processing pipeline and exported in many formats.
Databases
Several efficient open source biological database solutions like openBIS4 and OMERO12 are integrated with KNIME and thus with HCDC; this enables efficient management of HCS information from HCDC, both retrieval and storage.
Data filtering and processing, statistics and classification
These nodes allow the user to define the hits of a screen as an ultimate output. HCDC supports data processing in many ways as well as filtering or thresholding and can also employ machine learning approaches.
Data integration
We developed nodes for the seamless inte gration of library data with image infor – mation, numerical results and metadata across experiments.
Quality Control
Since direct supervision of experiments is not feasible in HCS experiments, HCDC offers modules dealing with assay robustness and quality control of data acquisition and sample preparation.
Bioinformatics
These nodes include numerous tools for sequence alignment, blast search and RNAi gene mapping which can be linked to the output of other nodes.
The architecture of HCDC was designed based mostly on the eclipse plugin framework and Eclipse-KNIME6,13 data workflow system. HCDC is a functional node set, working together with the KNIME package. A plug-in for opening and processing proprietary HCS files (library, numeric results and images) was developed within the KNIME environment. All those open source components (Eclipse environment, KNIME, R-Project, Weka and ImageJ) were chosen for its platform-independence, openness, simplicity and portability. They are also the fastest pure Java image and data-processing programs currently available. The programs have a built-in command recorder, editor and Java compiler; therefore, it is easily extensible through custom plug-ins. The pipeline model of HCDC-HITS describes the exact behaviour of the workflow when it is executed.
Technical details and availability openBIS
Operating system: Platform independent
Programming language: Java
License: Apache Software License 2.0
(some libraries used in openBIS are available under other OSI-approved licenses)
Project webpage, documentation and download: https://wiki-bsse.ethz.ch/display/bis
Screen casts: https://wiki-bsse.ethz.ch/display/ bis/openBIS+Screen+Casts
HCDC
Operating system: Platform independent
Programming language: Java
Other requirements: ImageJ library
Installation: http://hcdc.ethz.ch/index.php? option=com_content&view=article&id= 1&Itemid=3
License: GNU General Public License, Version 3
Project webpage and download: http://hcdc.ethz.ch
Conclusion
In this article, we have presented general considerations for setting up an HCS data pipeline and argued that, for creating a sufficiently versatile pipeline, it will usually be necessary to integrate the set of components that is best suited for its particular purpose. To this end, it is important that the components have been built with flexible interfaces to enable seamless integration. We have presented two components that are up to the task in their domain and are available as open source. openBIS is an information system for metadata, raw data and result data from biological experiments that has powerful queries and visualisations for HCS data and provides interfaces to use these data in analysis modules. HCDC is a set of nodes for the KNIME workflow system specialised in secondary analysis of HCS data. Both systems have been integrated by means of a KNIME connector and are actively used together for HCS data analysis.
References
1. Hannon G. J.: RNA interference, (2002) Nature 418, 244–251.
2. Dove, A: High-throughput screening goes to school. (2007) Nature Methods, 4, 523 – 532.
3. Fay N., Ullmann D.: Leveraging process integration in early drug discovery, (2006) Drug Discovery Today 11, 1075-1084.
4. Center for Information Sciences and Databases, Department of Biosystems Science and Engineering, ETH Zurich, [http://www.cisd.ethz.ch/software/openBIS]
5. Light Microscopy Center, ETH Zurich, [http://www.lmc.ethz.ch]
6. Berthold M. R., Cebron N., Fabian D., Gabriel T. R., Kötter T., Meinl T., Ohl P., Sieb C., Thiel K., Wiswedel B. : Knime: The Konstanz Information miner, In: Data Analysis, Machine Learning and Applications – Proceedings of the 31st Annual Conference of the Gesellschaft für Klassifikation e.V.. (Studies in Classification, Data Analysis, and Knowledge Organization ). Berlin, Germany: Springer, pp. 319–326, 2007
7. Massonnet C., Vile D., Fabre J., Hannah M.A., Caldana C., Lisec J., Beemster G.T.S., Meyer R.C., Messerli G., Gronlund J. T., Perkovic J., Wigmore E., May S., Bevan M.B., Meyer C., Rubio-Díaz S., Weigel D., Micol J.L., Buchanan-Wollaston V., Fiorani F., Walsh S., Rinn B., Gruissem W., Hilson P., Hennig L., Willmitzer L. and Granier C: Probing the Reproducibility of Leaf Growth and Molecular Phenotypes: A Comparison of Three Arabidopsis Accessions Cultivated in Ten Laboratories. (2010), Plant Physiol (4):2142-57
8. Kepler [https://kepler-project.org/]
9. Taverna [http://www.mygrid.org.uk/taverna/api/]
10. ChemSense, TextSense and BioSense (InforSense), [http://www.inforsense.com]
11. Hassan M, Brown RD, Varma S, Brien O, Rogers D: Cheminformatics analysis and learning in a data pipelining environment. Mol. Divers. 2006, 10 (3), 283–299.
12. Open Microscopy Environment [http://www.openmicroscopy.org]
13. Eclipse Foundation [http://www.eclipse.org]
