

Raman spectroscopy and cancer cells
Posted: 19 August 2010 |
Raman spectroscopy has the potential to provide diagnostic information to the clinician. The technique has a number of advantages allowing individual cells to be interrogated without staining. With further developments in technology, the surgeon will be able to rapidly acquire accurate diagnostic information at the time of operation using fibre optic Raman probes. Improvements in signal detection and data analysis, like modulated Raman spectroscopy, will allow the rapid acquisition and analysis of spectra. There is also considerable potential in screening tissue fluids for cancer cells in order to facilitate early detection and for follow up after surgery for cancer. Collaborations between clinicians, pathologists and physicists are opening up new areas in this rapidly developing field.
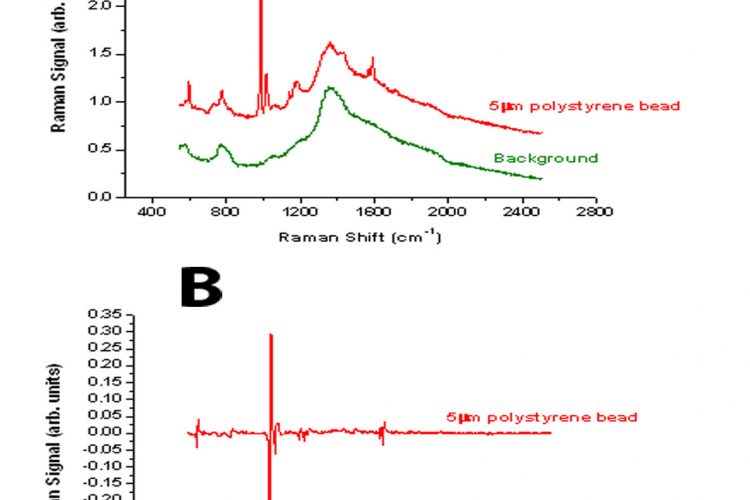
Figure 1 Comparison between the spectra derived from a 5μm polystyrene bead using either standard Raman spectroscopy (A) or modulated Raman spectroscopy (B)
Raman spectroscopy has the potential to provide diagnostic information to the clinician. The technique has a number of advantages allowing individual cells to be interrogated without staining. With further developments in technology, the surgeon will be able to rapidly acquire accurate diagnostic information at the time of operation using fibre optic Raman probes. Improvements in signal detection and data analysis, like modulated Raman spectroscopy, will allow the rapid acquisition and analysis of spectra. There is also considerable potential in screening tissue fluids for cancer cells in order to facilitate early detection and for follow up after surgery for cancer. Collaborations between clinicians, pathologists and physicists are opening up new areas in this rapidly developing field.
Diagnosis of cancer in biopsy samples relies on morphological analysis using the expertise of histopathologists or cytologists who have many years experience in viewing these specimens. This is augmented by techniques which allow cancer specific markers to be visualised using antibodies (immunohistochemistry) and molecular biological methods, where gene profiles can be visualised using microarray platforms. Characteristic translocations can be detected using fluorescent in situ hybridisation (FISH), particularly in haematopathology. The use of optical methods to interrogate cancer cells is developing rapidly and Raman spectroscopy provides a new modality, which shows much promise.
Raman scattering
Electromagnetic radiation when it interacts with matter is either absorbed or elastically scattered (Rayleigh scattering) and hence there is no wavelength change. A very small fraction of incident photons (approximately one in 105 – 107 photons) are inelastically scattered, thus resulting in a wavelength change (Raman shift). The extent of the Raman shift is a characteristic of the molecules, which the incident beam interacts with. This interaction of the incident photon with the molecule results in an energy exchange and the scattered photon can be of higher or lower energy than the incident photon. This energy change depends on the change in the rotational or vibrational energies of the molecule being interrogated. These vibrational energies are highly specific to a chemical constituent of the molecule and thus provide a signature of that molecule1-3. Thus, when a cell is exposed to an incident laser beam of a fixed wavelength, the resultant spectrum of Raman shifts represents a ‘molecular fingerprint’ of the molecules within the cell. This technique has the potential to discriminate between cells with different molecular contents and thus distinguish normal cells from cancer cells.
There are however a number of challenges in applying Raman spectroscopy to cancer cell detection:
- Cancer cells are likely to be rare cells in the sample collected from the patient
- Ideally the samples need to be preserved (fixed) for convenient laboratory analysis
- The abnormal cells are likely to represent a continuum of cancer development from dysplastic cells to frank malignant cells, particularly if trying to screen for early events in cancer development
- The acquisition time for collecting a Raman spectrum from individual cells tends to be long
- At the wavelengths used, fluorescence background can present a major challenge in analysing the Raman spectra
- Conventional laboratory analysis of patient samples is time consuming and requires skilled personnel
- Development of an automated microfluidic analysis system would provide new opportunities for screening and follow-up of patients
- Raman spectra can only currently be collected from tissue samples of up to two millimetres in depth
Raman spectroscopy in clinical practice
Raman spectroscopy has potential uses which could benefit both the pathologist and surgeon. With the design of Raman probes, this opens up the potential to analyse the epithelial linings of specific organs such as the bladder, the cervix and the oesophagus, to probe areas that appear suspicious to the surgeon. Tissue sections, either fresh or frozen, can be analysed to compliment conventional histopathological methods to help the pathologist discriminate areas containing tumour cells. Tissue and body fluids can also be analysed for the presence of tumour cells either in the blood or urine, for example.
Encouraging results have been described by Draga et al4 using a high-volume based Raman probe to discriminate areas of the bladder containing normal urothelium, non-invasive tumours (Ta) or invasive tumours (T1 or T2) with a sensitivity of 85 per cent and specificity of 79 per cent. They were also able to investigate the cancer stages, which exhibited an increase in amino acid peaks. Information on invasiveness is important in relation to treatment choice. Similar probes have been used with frozen sections to produce Raman maps of bladder tumours5 and to discriminate normal, benign and malignant tissue in breast samples. A further application has been to use frozen and fixed sections of resected lung tumours to predict risk of recurrence with a sensitivity of 73 per cent and specificity of 74 per cent. Samples from 34 resected tumours were studied and the predictive results compared favourably with techniques using gene signatures6.
Experimental studies using Raman spectroscopy
Studies with cell lines investigating the spectra from single cells has enabled the potential of Raman spectroscopy for cancer detection to be evaluated. Various stages of tumour development have been mimicked by utilising primary human keratinocytes, these same cells following introduction and expression of E7 derived from human papillomavirus 16 and the transformed cervical cancer derived cell line Ca Ski11. It was possible to distinguish cells at the different stages of tumour development. Analysis was performed on both fresh, unfixed cells and fixed cells. The fixed cells are clearly more convenient to analyse and in fact gave better results.
Similar studies using lung cancer cell lines were aimed at investigating differences in grading of lung neoplasia12. Primary human bronchial epithelial cells were compared to these cells expressing HPV E7 or cdk4. These represent changes associated with extended lifespan and proliferation of the cells. Discrimination between these cells was observed but the sensitivity and specificity was not as good as between normal and tumour cells. However, this was not unexpected as these represent subtle changes from the normal phenotype. A well established human bronchial cell line (BEP2D) immortalised using HPV18 was compared with a tumour line derived from it, following exposure of the cells to asbestos in vitro. This allowed a direct comparison between tumour cells and bronchial epithelial cells from the same background. Good discrimination between the BEP2D cells and the tumour line was observed.
A useful extension of the analysis of single cells can be achieved by using a dual fibre trap to analyse individual cells13,14. In order to analyse cells, which are either attached to a substrate or allowed to sediment in suspension, it is necessary to use quartz slides or coverslips. Analysis using conventional glass slides is unsuccessful due to the Raman signal from the glass. Cells can be effectively trapped using a 1070 nanometre fibre laser and interrogated using a 785 nanometre diode laser. This allows large cells to be trapped and local regions of a cell to be analysed. The technology also lends itself to adaptation to a microfluidic chamber where cells flowing past a fibre trap can be captured and a Raman spectrum analysed.
One of the difficulties of analysing biological and clinical samples is that this is often associated with a strong fluorescence background in the region of interest. Similarly, the rather weak signal from the Raman peaks makes the collection of data very difficult. Spectra acquisition time is also a major issue with clinical samples. A novel approach to solving these problems has been reported recently by our group15. The Raman shift is a function of the laser wavelength used, whereas the fluorescence background is much less dependent on wavelength. Thus, by periodic modulation of the laser wavelength the Raman scattering changes but the fluorescence background does not. The use of multi-channel lock in detection of the Raman signal, synchronising the detection with the modulation excitation wavelength enables the Raman peaks to be distinguished from the background fluorescence. The technique is illustrated in Figures 1 and 2. In Figure 1A, the standard Raman spectrum from a 5μm polystyrene bead is shown illustrating the high fluorescence background. Using the modulation method, the fluorescence is completely removed and the derivative peaks due to the Raman contribution appear as characteristic spikes (Figure 1B). Similarly analysis of a bladder tumour cell is illustrated using standard Raman and modulated Raman (Figure 2 A and B). By optimising the algorithm used for processing the data, the result has been further improvement in this methodology16.

Figure 1 Comparison between the spectra derived from a 5μm polystyrene bead using either standard Raman spectroscopy (A) or modulated Raman spectroscopy (B)

Figure 2 Comparison between the spectra derived from a bladder tumour cell using either standard Raman spectroscopy (A) or modulated Raman spectroscopy (B)
Application to detecting tumour cells in urine
Patients presenting with blood loss in the urine need to be investigated to rule out the presence of a tumour. This requires the patient to be admitted to hospital for cystoscopy. Patients who have had a bladder tumour removed also have to return at regular intervals for check cystoscopies, as unfortunately there is a high rate of recurrence in bladder cancer. Thus, a convenient and robust method for detecting tumour cells in urine would be a useful adjunct to the clinical practice of urologists. Urine samples were collected and Preservcyt added to fix the cells. The cells were then collected by centrifugation. Following careful washing to remove the fixative, the Raman spectra of individual cells was recorded. An example of the spectra obtained is shown in Figure 3. In this case, examples of normal human urothelial cells (red line) and bladder tumour cells (blue line) were present in the same sample. The spectra can be analysed using principal component analysis and the tumour cells (blue circles) can be discriminated from the normal urothelial cells (red squares) in this sample (Figure 4). The leave one out sensitivity is 96 per cent and the specificity is 91 per cent.

Figure 3 Raman spectrum of normal human urothelial cells (–––––) and malignant bladder tumour cells (–––––) collected from a urine sample

Figure 4 Principal component analysis of Raman spectra collected from bladder tumour cells (●) and normal human urothelial cells (■) from fixed urine samples
Perspectives
Collaboration between clinicians, pathologists and physicists is resulting in problems in the use of cancer detection being identified and thus providing the spur to overcome these challenges. Better fibre optic Raman probes will provide a valuable tool to the urologist and others to interrogate tissues in situ and make decisions immediately on the best treatment action. The potential to develop microfluidic devices incorporating Raman probes that will allow rapid screening of liquid samples for cancer cells will allow patients with bladder cancer to be followed up on a regular basis and inform the urologist of recurrences. The path – ologist will also be able to examine tissue sections using Raman maps, which will facilitate difficult diagnoses5,17.
References
1. Brewster V, Jarvis R, Goodacre R, 2009. Raman spectroscopic techniques for biotechnology and bioprocessing. Eur. Pharm. Rev. 1: 48-52
2. Chowdhry BZ, Jabeen S, Alexander B, 2009. Raman spectroscopy in pharmaceutical analysis. Eur. Pharm. Rev. 5: 34-39
3. Gooijer C, Ariese F, 2009. A sensitive and selective vibrational spectroscopy technique in life sciences. Eur. Pharm. Rev. 6: 52-57
4. Draga ROP, Grimbergen MCM, Vijverberg PLM, van Swol CFP, Jonges TGN, Kummer JA, Ruud Bosch JLH, 2010. In vivo bladder cancer diagnosis by high-volume Raman spectroscopy. Anal. Chem. June 4, epub ahead of print
5. De Jong BWD, Bakker-Schut TC, Maquelin K, van der Kwast K, Bangma CH, Kok DJ, Puppels GJ, 2006. Discrimination between nontumour bladder tissue and tumour by Raman spectroscopy. Anal. Chem. 78: 7761-7769
6. Magee ND, Beattie JR, Carland C, Davis R, McManus K, Bradbury I, Fennell DA, Hamilton PW, Ennis M, McGarvey JJ, Elborn JS, 2010. Raman microscopy in the diagnosis and prognosis of surgically resected nonsmall cell lung cancer. J. Biomed Optics 15 (2): 026015 1-8
7. Kanter EM, Vargis E, Majumder S, Keller MD, Woeste E, Rao GG, Mahadevan-Jansen A, 2009. Application of Raman spectroscopy for cervical dysplasia diagnosis. J. Biophoton. 2 : 81-90
8. Haka AS, Volynskaya Z, Gardecki JA, Nazemi J, Shenk R, Wang N, Dasari RR, Fitzmaurice M, Feld MS, 2009. Diagnosing breast cancer using Raman spectroscopy : prospective analysis. J. Biomed Optics 14: (5) 054023 1-8
9. Chan JW, Taylor DS, Lane SM, Zwerding T, Tuscano J, Huser T, 2008. Nondestructive identification of individual leukaemia cells by laser trapping Raman spectroscopy. Anal. Chem. 80 : 2180-2187
10. Tollefson M, Magera J, Sebo T, Cohen J, Drauch A, Maier J, Frank I, 2010. Raman spectral imaging of prostate cancer : can Raman molecular imaging be used to augment standard histopathology ? BJUI epub
11. Jess PRT, Smith DDW, Mazilu M, Dholakia K, Riches A, Herrington S, 2007. Early detection of cervical neoplasia by Raman spectroscopy. International Journal of Cancer 121 : 2723-2728
12. Jess PRT, Mazilu M, Dholakia K, Riches AC, Herrington CS, 2009. Optical detection and grading of lung neoplasia in Raman microspectroscopy. Int. J. Cancer 124: 376-380
13. Jess PRT, Garces-Chaves V, Smith D., Mazilu M, Paterson L, Riches A, Herrington C, Sibbett W, Dholakia K, 2006. A dual fibre trap for Raman micro-spectroscopy of single cells. Optics Express
14 : 5779-5791 14. Jess PRT, Garces-Chaves V, Riches A, Herrington CS, Dholakia K, 2007. Simultaneous Raman micro-spectroscopy of optically trapped and stacked cells. J Raman Spectroscopy 38 : 1082-1088
15. De Luca AC, Mazilu M, Riches AC, Herrington CS & Dholakia K, 2010. Online fluorescence suppression in modulated Raman spectroscopy. Anal. Chem. 83: 738-745
16. Mazilu M, Chiara de Luca A, Riches A, Herrington CS, Dholakia K, 2010. Optimal algorithm for fluorescence suppression of modulated Raman spectroscopy. Optics Express 18: 11382-11395
17. Tan KM, Herrington CS, Brown CTA, 2010. Discrimination of normal from pre-malignant cervical tissue by Raman mapping of de-paraffinized histological tissue sections. J. Biophoton. 2:1-9
About the Author
Andrew Riches
Andrew Riches is Professor of Experimental Pathology in the School of Medicine at the University of St. Andrews. After graduating in Physics at the University of Birmingham, he continued on the MSc Radiobiology course and then obtained his PhD in Experimental Haematology in the Department of Anatomy at the University of Birmingham. He received an MRC Junior Research Fellowship and a lectureship in the Department of Anatomy before moving to St. Andrews. He has had a long term interest in how stem cell proliferation is regulated and developing models of in vitro radiation carcinogenesis using human cell systems. More recently he has been collaborating with the School of Physics & Astronomy developing novel cell-sorting methods, methods for transfecting cells and advanced applications of Raman spectroscopy in cancer research.
