Process Analytical Technology (PAT) in Freeze Drying: Tunable Diode Laser Absorption Spectroscopy as an evolving tool for Cycle Monitoring
Posted: 12 December 2009 | | No comments yet
The most important critical product parameter during a freeze-drying process is the product temperature at the ice sublimation interface, Tp1. Once the product temperature in this area of interest exceeds the critical formulation temperature (typically denoted as “collapse temperature”, Tc) during primary drying, a stepwise loss of the cake structure may be observed2,3. This, in turn, can greatly impact the product quality attributes with regard to product appearance, reconstitution times, sub-visible particles and residual moisture content4.
While it is rather simple to measure product temperatures and endpoints of primary and secondary drying in laboratory scale, monitoring of critical process and product parameters in pilot and (in particular) manufacturing scale freeze-drying cycles is difficult. Here, the sterile environment requires non-invasive monitoring devices which can easily be implemented in a GMP facility. Since production seems to follow the rule “never change a running system”, establishment of such a new technology will only be accepted if it comes with convincing arguments and key features. One key argument might be a drastic facilitation of scale-up. In general, it is not advisable in freeze drying to apply the identical cycle conditions in production as in development scale and to simply assume identical product temperature profiles. Substantial discrepancies arise from the particulate-free environment in pharmaceutical manufacturing of parenterals which mainly impacts the degree of supercooling: while nucleation in the laboratory might be observed in the range from -10°C to -25°C, nucleation temperatures in manufacturing might be as low as -40°C. As a consequence, smaller ice crystals form which, in turn, lead to an increase in product resistance, extended primary drying times and elevated product temperatures5,6. Since the extension of the primary drying phase cannot be predicted, excessive supercooling bears the risk of premature ramping into secondary drying which would then result in meltback, severe shrinkage or even collapse of the cake structure1.

Monitoring options in manufacturing scale are quite limited: the use of thermal probes such as thermocouples or resistance thermal detectors (RTD’s) requires manual placement of wires and is not compatible with automatic loading systems. The application of wireless sensors is also limited due to problems with their placement and concerns about introduction of batteries into a sterile environment7. The most critical point is, however, that all these methods are invasive and therefore support heterogeneous nucleation, i.e. a vial containing a temperature probe might shows less supercooling relative to its neighbours, in particular in a sterile environment. In addition, monitoring of a few single vials out of thousands greatly limits the value of this information. Endpoint detection using comparative pressure measurement with Pirani sensors and Capacitance Manometers is not frequently used in production, in particular in Europe. Further, simple pressure rise measurements can be employed for endpoint detection in manufacturing (note: no further analysis of the pressure rise data), but lead to short-term increases in product temperatures and provide no information about the most important product parameter, product temperature. Tunable Diode Laser Absorption Spectroscopy (TDLAS) can be used on lyophilizers of all scales and provides non-intrusive monitoring of the freeze-drying process which constitutes a substantial improvement for control of freeze-drying processes from laboratory up to production scale.
Operation principle and traditional application
Tunable Diode Laser Absorption Spectroscopy (TDLAS) is a Near-Infrared (NIR) spectroscopic method where the measurement is based on absorption of energy by gas molecules at a specific wavelength in the electromagnetic spectrum (“absorption line”)8-10. During transmission of a diode laser beam at the absorption wavelength through a sample containing the target gas, the beam intensity is reduced according to the Beer-Lambert relation (see Equation 1):
![]()
![]()
Where Iv,0 is the input intensity, Iv is the transmitted intensity after traversing the pathlength L, ν is the laser frequency, S(T) is the temperature-dependent absorption line strength, N is the gas concentration of target molecules, and g(ν) is the spectral line shape function which describes the frequency dependency of the absorption strength. With the measured transmission intensity, the number of target gas molecules in the sample can be calculated. The laser wave length can be rapidly tuned through a narrow band (~5 nm in the near infrared spectral region) and is capable of measuring multiple spectra per second in the peak area which can be averaged to provide more reliable data. A great advantage of TDLAS technology is the high sensitivity for the target molecule, the measurement specificity, and the exact concentration measurements11.
Traditional application of TDLAS technology is focused on measurement of gas concentrations in the atmosphere12 and in the chemical industry. Some examples are leak detectors for natural gas pipelines13 and process control in petrochemical manufacturing to measure concentrations of methane, ethane and other gas components10,14. A curious application is the use in an aircraft to measure concentrations of formaldehyde15. A first pharmaceutical application of TDLAS was reported in 2006 where this technology was used to measure the solvent concentrations in the drying air during coating of particulates16. All applications mentioned have in common that only the concentration of a gas component is measured. However, to successfully establish this technology in pharmaceutical freeze drying operations, more than just gas concentration needs to be determined: the critical process parameter mass flow, dm/dt.

TDLAS in Freeze-Drying operations
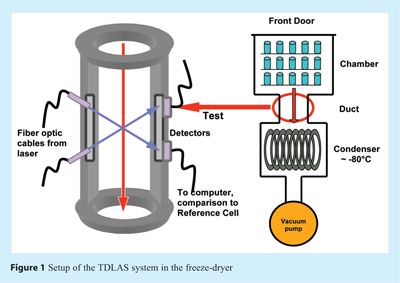
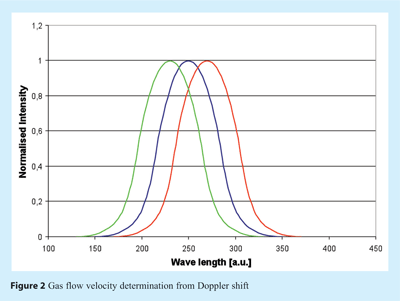
First laboratory experiments demonstrating TDLAS mass flow monitoring in lyophilization were conducted in 2003 and officially presented in early 200417. The concept of mass flow measurements was enabled by installing the optical pathway in a (straight) duct connecting the chamber and the condenser of a freeze dryer (see Figure 1)18. A NIR diode laser beam is then launched through a coated window in the spool piece wall at a predefined angle to the direction of the vapour flow (usually 45°) and detected on the opposite side of the duct by a detector. Water concentration is then calculated from the absorption line strength at the water peak. Due to the angle between the laser beam and the direction of vapour flow, a Doppler shift in the spectrum can be observed which is directly related to the flow velocity of the water vapour (see Figure 2). The spectra can be compared to either a static reference cell or to a second laser beam launched in the opposite direction to calculate the vapour flow velocity based on the Doppler shift between the peaks. This parameter, in combination with the water vapour concentration and the spool cross sectional area, then allows calculation of the mass flow rate (grams per second) which can be integrated to estimate the amount of water removed from the product. The accuracy of the mass flow was reported to be within +/- 5% in the laboratory18,19. TDLAS represents therefore a “true” real-time, non-contact measurement technique that can be related to critical parameters within the lyophilization process.

Endpoint Detection by TDLAS
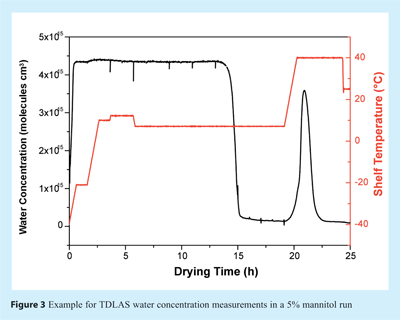
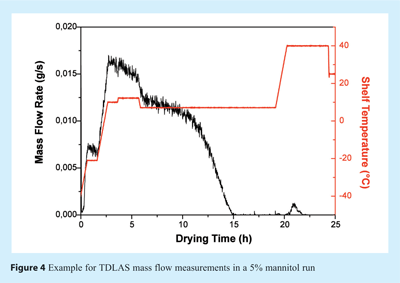
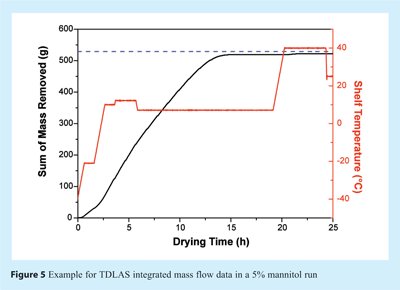
To determine the endpoint of primary drying, i.e. the point when all ice has been removed, the TDLAS water concentration measurements can be used. During primary drying, the atmosphere in both chamber and spool piece consists almost exclusively of water vapour. Once the ice has been removed from most of the vials, the atmosphere composition changes to predominantly nitrogen (or air) which is commonly used to control chamber pressure. This change can be observed as a sharp drop in the TDLAS water concentration (see Figure 3). The endpoint indication agrees well with data obtained from comparative pressure measurements, mass spectrometry or cold plasma devices20. However, in contrast to other technologies which only measure constant water vapour concentrations during primary drying, TDLAS provides additional information by means of velocity and mass flow data which often change significantly during primary (and secondary) drying. Such information may indicate differences in product properties (e.g. product resistance) or potential problems with the drying process (e.g. loss of pressure control). A representative mass flow over time profile for a 7.5% mannitol run is illustrated in Figure 4. Changes in shelf temperature have no effect on water vapour concentration, but can be observed instantaneously to impact mass flow rates. Also, a steady decrease of the mass flow rate at constant temperatures is observable which is associated with an increase in product resistance. Integration of mass flow data provides an estimate of the amount of water already removed from the product as can be seen in Figure 5. Although the integrated value is not accurate enough to directly target residual moisture contents, it provides valuable real time information to the user during cycles in both development and production scale. Endpoint detection of secondary drying is also possible qualitatively using the TDLAS water vapour concentration measurement18.

TDLAS for operational qualification and scale-up
The conventional procedure to delineate differences in heat and mass transfer between freeze dryers due to inherent design characteristics is to obtain mass flow data from multiple sublimation tests with water (and product) in plastic-lined “bands”. Data analysis is then performed by using simple steady state heat and mass transfer equations21. While this procedure is usually very time consuming and (more important) provisory reliable, Gieseler et al.18 demonstrated the application of TDLAS for direct monitoring of gas flow velocity and mass flow differences during sublimation tests with pure ice on both a laboratory scale (Lyostar II, SP Industries) and a pilot scale freeze-dryer (Lyomax 3, IMA Edwards). In this study, the authors also performed freeze drying runs with mannitol, thereby evaluating the accuracy of the TDLAS mass balance calculation. It was possible to monitor both primary and secondary drying. Further, the mass balance accuracy (given in the ratio gravimetric/TDLAS) was found 1.02 ± 0.06 for ice and 0.96 ± 0.05 for mannitol. This study illustrated for the first time the value of TDLAS in operational qualification (OQ) testing of lyophilizers, thereby facilitating cycle transfer or scale-up. In a second study, Patel et al.22 used TDLAS to show limitations of mass transfer in a laboratory scale freeze-dryer and the occurrence of choked flow which arises if the flow velocity in the duct approaches the speed of sound. This situation is associated with a loss of pressure control in the chamber, and an increase of product temperature which may cause a loss of the predefined product quality attributes. TDLAS technology was found an excellent tool to determine the critical boundary conditions for mass flow within a given freeze dryer geometry. Patel et al. also studied the impact of freeze dryer load, especially drying of small fractional loads, on the drying process and compared TDLAS, MTM and comparative pressure measurements23. A most recent study by Kuu and Nail24 integrated TDLAS information in theoretical modeling of the lyophilization process to design an optimised cycle recipe in reduced time in connection with a cascading shelf temperature method.

TDLAS mass flow data to determine vial heat transfer coefficients
The vial heat transfer coefficient (Kv) is an important parameter to describe the transport of heat from the shelf to the product as a function of chamber pressure25. Thoroughly determined Kv values may be used to expedite adjustment of cycle conditions when changing the vial type, to determine differences in heat transfer by atypical radiation on different freeze-dryers or for optimising the primary drying phase during a cycle.
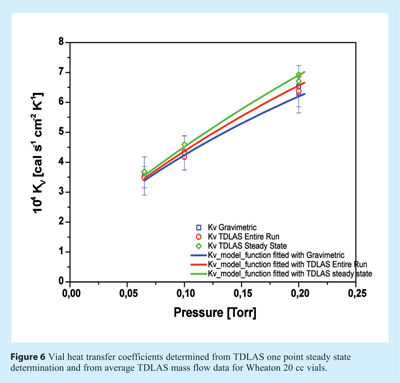
Kv values are conventionally determined in a series of sublimation experiments with pure ice at different chamber pressures using the desired vial type. Then, the total amount of water removed is determined gravimetrically for a limited number of vials25. TDLAS has been used to overcome this time-consuming procedure by Kuu et al.26 where the vial heat transfer coefficient was determined at various pressures using only a single sublimation experiment. The authors employed TDLAS measurements in combination with computer simulation and a reiterative algorithm. Kv values and separation distances (lv) were calculated for several vial types and showed mostly good agreement with previously published data25. The authors were also able to delineate the pressure-independent contributions to heat transfer from radiation and direct conduction (Kcs) from the total vial heat transfer coefficient. Schneid et al.27 also used TDLAS mass flow data for the determination of Kv. However. in contrast to Kuu et al. the authors derived Kv data from TDLAS measurements by following two different approaches: first using one-point measurements during the steady state phase of the mass flow and temperature data, and second by integrating mass flow over the entire sublimation experiment and calculating average product temperatures. The results are shown in Figure 6 relative to the traditional gravimetric procedure in the pressure range between 65 and 200 mTorr.
Batch Average Product Temperatures by TDLAS
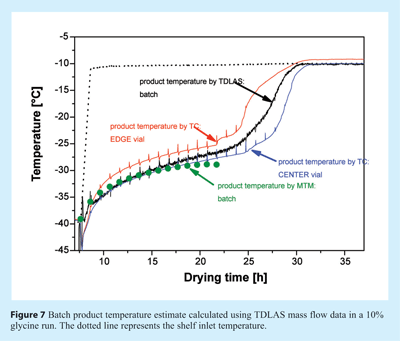
TDLAS-based Kv calculations have most recently been used to predict batch average product temperatures during primary drying27. Self-cooling of the product by sublimation is calculated from mass flow data and subtracted from the shelf surface temperature. Here, a simple steady state heat and mass transfer model (see Equation 2) has been applied which is valid if no substantial heterogeneity is present within the batch.


Where Tb is the product temperature at the bottom of the vial, Ts is the shelf surface temperature, ΔHS is the heat of sublimation of ice, dm/dt is the mass flow rate recorded using TDLAS, Av is the vial area, and Kv is the previously determined heat transfer coefficient. A representative batch product temperature profile in comparison to thermocouple data is given in Figure 7. Please note that the batch average product temperature estimated from TDLAS data does not show the bias towards the coldest vials commonly observed for MTM data which is also illustrated in the same Figure.

TDLAS as a Residual Moisture Monitor for Secondary Drying
Secondary drying is characterised by desorption of water from a crystalline surface or diffusion through and desorption from an amorphous matrix, depending on the physico-chemical properties of the product. Water vapour concentrations in the chamber are lower in this phase than during the primary drying step, but still in a magnitude that can be exactly measured by TDLAS. This makes TDLAS feasible for monitoring the endpoint of secondary drying. However, flow velocities are significantly lower than in primary drying, now typically found in the order of 2 to 5 m/s. Such low gas velocities impose much higher errors to the mass flow calculation by TDLAS. However, these calculations are still possible, and recent studies have shown that it is possible to integrate the mass of water removed starting at an anchor point to target intermediate moisture contents28,29. Additionally, the mass flow reading at a constant product temperature can be used to estimate the moisture content of the bulk if a reliable correlation is established beforehand. Although these preliminary laboratory experiments are encouraging for future applications of TDLAS, mass flow measurement with the TDLAS equipment currently available is not absolutely reliable for very low water concentrations which are frequently encountered in secondary drying.

Present Merits and Demerits of TDLAS
TDLAS technology for freeze drying operations was originally developed as a joint development between Physical Sciences Inc. (Andover, MA), IMA Edwards (Tonawanda, NY) and the University of Connecticut (Storrs, CT). This technology has, just recently, been turned into a commercial product (LyoFluxTM 100, IMA Edwards). As mentioned above, TDLAS has been demonstrated in a number of (laboratory) studies, proving that this technology has a great chance to become one of the leading PAT tools for freeze drying in the future. However, the number of TDLAS users in manufacturing is rather small at the moment. A possible reason for this situation could be that an existing freeze dryer cannot be easily retrofitted with TDLAS technology. Note that this technology can only be used in freeze dryers that (1) have a tube-like connection between the chamber and the condenser, (2) have a spool that has a minimum length and (3) have straight spool geometry to allow the development of parabolic gas flow18. A further obstacle which must be overcome is the initial measurement of a gas velocity offset in the early phase of the primary drying step by separating the chamber from the condenser. Overall, TDLAS is a very promising but also quite complex technology.
Conclusion
The application of Tunable Diode Laser Absorption Spectroscopy in lyophilization has been shown in numerous publications with several different methods of use. Hopefully, TDLAS may be more and more employed in both laboratory scale and production scale freeze-dryers for improved process monitoring, facilitated transfer and scale-up, and other applications that make control of critical process and product parameters easier.
References
- Pikal, M.J. 2002. Freeze Drying; In: Encyclopedia of Pharmaceutical Technology, Marcel Dekker, New York, 1299-1326.
- Tang, X.; Pikal M. J. 2004. Design of freeze-drying processes for pharmaceuticals: practical advice. Pharm Res 21(2): 191-200.
- Meister, E.; Gieseler, H. 2008. Freeze-Dry Microscopy of Protein/Sugar Mixtures: Drying Behavior, Interpretation of Collapse Temperatures and a Comparison to Corresponding Glass Transition Data. J Pharm Sci, online first.
- Fonseca, F.; Passot, S.; Cunin, O.; Marin, M. 2004. Collapse Temperature of Freeze- Dried Lactobacillus bulgaricus Suspensions and Protective Media. Biotechnol. Prog. 20, pp. 229 – 238.
- Tchessalov, S.; Warne, N. 2008. Lyophilization: cycle robustness and process tolerances, transfer and scale up. European Pharmaceutical Review, Issue 3/2008, pp. 76-83.
- Rambhatla, S.; Ramot, R.; Bhugra, C; Pikal, M.J. 2004. Heat and Mass Transfer Scale- up Issues during Freeze Drying: II. Control and Characterization of the Degree of Supercooling. AAPS PharmSciTech, 5 (4) Article 58, pp. 1-9.
- Schneid, S.; Gieseler, H. 2008. Evaluation of a New Wireless Temperature Remote Interrogation System (TEMPRIS) to Measure Product Temperature During Freeze Drying. AAPS PharmSciTech 9 (3), pp. 729-739.
- Riris, H.; Carlisle, C.B.; Carr, L.W.; Cooper, D.E.; Martinelli, R.U.; Menna, R.J. 1994. Design of an open path near-infrared diode laser sensor: application to oxygen, water, and carbon dioxide vapour detection; Applied Optics 33(30), pp. 7059-7066.
- Werle, P. 1996. Tunable diode laser absorption spectroscopy: recent findings and novel approaches; Infrared Physics and Technology 37, pp. 59-66.
- Werle, P.; Slemr, F; et al. 2002. Near- and mid-infrared laser-optical sensors for gas analysis. Optics and Lasers in Engineering 37(2-3), pp. 101-114.
- Frish, M.B.; Laderer, M.C.; Wainner, R.T.; Wright, A.O.; Patel, A.H.; Stafford-Evans, J.; Morency, J.R.; Allen, M.G.; Green, B.D. 2007. The Next Generation of TDLAS Analyzers. Proc. Society of Photo-Optical Instrumentation Engineers, Boston, MA, Sept. 2007.
- D’Amato, F.; De Rosa, M. 2002. Tunable diode lasers and two-tone frequency modulation spectroscopy applied to atmospheric gas analysis; Optics and Laser in Engineering 37, pp. 533-551.
- Druy, M. 2006. From Laboratory Technique to Process Gas Sensor: The Maturation of Tunable Diode Laser Absorption Spectroscopy; Spectroscopy, 21(3), pp. 1-4.
- Röpcke, J.; Lombardi, G; et al. 2006. Application of mid-infrared tuneable diode laser absorption spectroscopy to plasma diagnostics: a review. Plasma Sources Science & Technology 15(4), pp. 148-168.
- Fried, A.; Wert, B. P.; et al. 1999. Airborne tunable diode laser measurements of formaldehyde. Spectrochimica Acta Part a – Molecular and Biomolecular Spectroscopy 55(10), pp. 2097-2110.
- Cook, G. 2006. Wyeth forges ahead. European Pharmaceutical Review, 5/2006.
- Kessler, W.J.; Davis, S.J.; Mulhall, P.A.; Silva, M.; Pikal, M.J., Luthra, S. 2004. Lyophilizer Monitoring Using Tunable Diode Laser Absorption Spectoscopy. Proc. 18th International Forum Process Analytical Chemistry, Arlington, VA, USA, Jan. 12-15.
- Gieseler, H.; Kessler, W.J.; Finson, M.; Davis, S.J.; Mulhall, P.A.; Bons, V.; Debo, D.J.; Pikal, M.J. 2007. Evaluation of Tunale Diode Laser Absorption Spectroscopy for In-Process Water Vapor Mass Flux Measurements During Freeze Drying; J. Pharm. Sci. 96(7), pp. 1776-1793.
- Schneid, S.C.; Gieseler, H.; Kessler, W.; Pikal, M.J. 2006. Process Analytical Technology in Freeze Drying: Accuracy of Mass Balance Determination using Tunable Diode Laser Absorption Spectroscopy (TDLAS). Proc. AAPS Annual Meeting and Exposition, San Antonio, TX, USA, Oct. 29 – Nov. 2.
- Patel, S.; Doen, T.; Schneid, S.; Pikal, M.J. 2007. Determination of End Point of Primary Drying in Freeze-Drying Process Control. Proc. AAPS Annual Meeting and Exposition, San Diego, CA, USA, Nov. 11-15.
- Rambhatla, S.; Tchessalov, S.; Pikal, M.J. 2006. Heat and Mass Transfer Scale-Up Issues During Freeze-Drying, III: Control and Characterization of Dryer Differences via Operational Qualification Tests. AAPS PharmSciTech, 7 (2) Article 39, pp. E61-70.
- Patel, S. 2008. Choked flow and importance of mach I in freeze drying process design. Proc. CPPR Freeze-Drying of Pharmaceuticals and Biologicals, Breckenridge, CO, USA , Aug. 6-9.
- Patel, S.; Jameel, F.; Pikal, M.J. 2006. The Effect of Dryer Load on Freeze Drying Process Design. Proc. AAPS Annual Meeting and Exposition, San Antonio, TX, USA, Oct. 29 – Nov. 2.
- Kuu, W.Y.; Nail, S.L.. 2008. Freeze-Drying Cycle Optimization Facilitated by Mathematical Modeling and Tunable Diode Laser Absorption Spectroscopy (TDLAS). Proc. CPPR Freeze-Drying of Pharmaceuticals and Biologicals, Breckenridge, CO, USA, Aug. 6-9.
- Pikal, M. J.; Roy, M. L.; et al. 1984. Mass and heat transfer in vial freeze-drying of pharmaceuticals: role of the vial. J. Pharm. Sci. 73(9), pp. 1224-37.
- Kuu, W.Y.; Nail, S.L.; Sacha, G.. 2009. Rapid Determination of Vial Heat Transfer Parameters Using Tunable Diode Laser Absorption Spectroscopy (TDLAS) in Response to Step-Changes in Pressure Set-Point During Freeze-Drying. J. Pharm. Sci. 98(3), pp. 1136-54.
- Schneid, S.; Gieseler, H.; Kessler, W.; Pikal, M.J. 2008. Non-invasive product temperature determination during primary drying using tunable diode laser absorption spectroscopy.” J. Pharm. Sci., online first Sept. 2008.
- Schneid, S.; Gieseler, H.; Kessler, W.J.; Pikal, M.J. 2007. Tunable Diode Laser Absorption Spectroscopy (TDLAS) as a Residual Moisture Monitor for the Secondary Drying Stage of Freeze Drying. Proc. AAPS Annual Meeting and Exposition, San Diego, CA, USA, Nov. 11-15.
- Kessler, W. J.; Galbally-Kinney K.; Mulhall, P.A.; Schneid, S.; Gieseler, H.; Pikal, M. J.; Luthra, S.; Patel, S. 2008. Lyophilization PAT: Monitoring Product Residual Moisture using Water Vapor Mass Flux Measurements. Proc. International Forum on Process Analytical Chemistry, Baltimore, MD, USA.
Issue
Related topics
Freeze Drying, Lyophilisation, Process Analytical Technologies (PAT)


