

Photobleaching profile of Raman peaks and fluorescence background
Posted: 15 December 2017 | Derya Cebeci-Maltaş, Dor Ben-Amotz, Md Anik Alam, Ping Wang, Rodolfo Pinal | 1 comment
Laser-induced fluorescence is the most common source of interfering baseline signal encountered in Raman measurements. It shows itself as a slowly changing background in a spectrum. One of the challenges in the successful use of Raman spectroscopy is to extract Raman signatures from this, orders of magnitude stronger, broadband fluorescence emission. Irradiating the sample with intense laser light, ie, photobleaching, is one effective technique to reduce the level of fluorescence emission, thus increasing the signal to noise (S/N) ratio of a spectrum.

The fluorescence interference in Raman spectroscopy may result from the compound analysed or from fluorescent impurities in the sample. It is an absorption process that causes molecules to be excited to a higher electronic state, which requires high-energy photons. Fluorescence light is then emitted while molecules relax back to the lower energy level. The phenomenon depends strongly on the excitation wavelength and appears only at a fixed frequency, while the Raman shifts are independent of the laser’s wavelength.
Raman scattering and fluorescence emission may compete with each other when the excitation laser energy is close to the electronic transition energy of the material. Higher energy green or red excitation sources, such as 514nm or 633nm visible laser, produce stronger fluorescence background. As the laser line moves to the near-infrared (NIR) region, as with 785nm or 1,064nm laser, the fluorescence effect subsides or completely disappears since the energy of these wavelengths may not be sufficient to excite the molecule to higher electronic state or may not be enough to destroy fluorescing molecules in the material. This effect is illustrated in Figure 1.
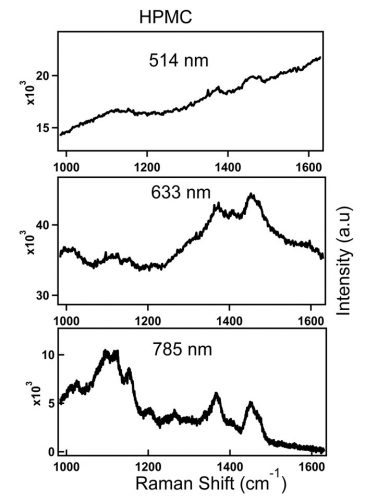
Figure 1: Spectra of HPMC obtained with 514nm, 633nm and 785nm laser lines. Top spectrum (514nm): 5s, 77mW at the sample. Middle (633nm): 30s, 33mW at the sample. Bottom (785nm): 60s, 68mW at the sample.
Figure 1 shows spectra of an inactive pharmaceutical ingredient, hydroxypropyl methylcellulose (HPMC), a common pharmaceutical excipient, which is measured at three different laser lines; 514nm, 633nm and 785nm. The figure illustrates the loss of Raman peaks in the presence of increasing levels of fluorescence with high energy excitation sources. In contrast to the 514nm laser excitation line that produced significant fluorescence baseline, a better S/N ratio HPMC spectrum is acquired with 785nm excitation wavelength. Advances in compressive detection strategy have recently been made to facilitate Raman classification and quantitation in the presence of fluorescence background.1 This is reported to be a better alternative to conventional subtraction strategies2-4 by virtue of its compatibility with automated high-speed chemical analysis in the presence of fluorescence background.1
It is well known that Raman scattering is an inefficient phenomenon. Typically, one Raman photon is generated for every 106 to 109 laser photons incident upon the sample. As a result, very low amounts of fluorescent species in the sample may be enough to mask the low Raman scattered photons or make it difficult to interpret the spectrum. If the fluorescence baseline is high, the shot noise generated by this signal may be of a similar order, or even greater than the Raman signal alone and will completely mask the signal from the Raman photons. Consequently, proposed mathematical techniques2-4 to eliminate the fluorescence background will only make larger peaks more visible against the background while smaller peaks may still remain undiscernible against the noise.
In many cases, Raman signal can still be acquired from samples producing autofluorescence. In the fluorescence process, the sample is excited to the higher electronic state by the absorption of a photon and subsequently relaxes back to the ground electronic state by emitting a fluorescence photon. When compared to the rate of fluorescence emission, which typically occurs in 10-5 to 10-10s, the rate of photon absorption is very rapid at about 10-14 to 10-15s. Thus, the fluorescence effect can be reduced by photobleaching the sample. Alternatively, if the fluorescence is due to an impurity in the material, long exposure to sustained laser light may destroy fluorescent impurities, hence decreasing the fluorescence background. More specifically, irradiating the sample with an intense laser beam for a period of time before data acquisition could remove or partially quench the fluorescence, leading to a higher quality Raman spectrum. The irradiation time period can range from seconds to hours, depending on the fluorescent material in the particular sample.
Experiment and results
In this study, pure microcrystalline cellulose (MCC) was photobleached for about 1hr and consecutive Raman spectra were recorded at various time periods without moving the sample. These measurements were carried out with an in-house constructed Raman instrument. The sample was irradiated with a single mode diode laser of 785nm wavelength, which delivered 80mW of power at the sample. A 20x NIR objective lens (NA 0.40, Olympus, LMPL 20X IR) was used to focus the laser onto the sample and also to collect scattered Raman photons. The scattered light was dispersed with a 300 lines/mm grating. Acquisition time for each spectrum was 60s. A total of 40 spectra were collected in a time span of 61min. Data analysis was carried out using Igor Pro 6.37 (WaveMetrics).
The spectrum of MCC has a high fluorescent background, which bleaches down in time. Figure 2 shows the representative spectral time series obtained at six different time points to demonstrate the overall effect of photobleaching on the spectra. The Raman peaks are located on top of the fluorescence background in the spectra. Before any calculation, a dark background is subtracted from each spectrum. In order to calculate the areas of Raman peaks and fluorescence background, Raman peaks between 765cm-1 and 1,580cm-1 spectral range are fitted to third-degree polynomial as shown in Figure 3A. Then, these Raman spectral features are effectively separated from the fluorescence background and the area shown above red polynomial curve in Figure 3A is calculated as a Raman peak area.
Also, the fluorescence counts over the 500cm-1 to 3,410cm-1 range without including the Raman peaks are calculated for each spectrum collected, so that the level of fluorescence emitted can be evaluated as a function of photobleaching time. Figure 3B gives the photo-bleaching profile, demonstrating how the intensities of fluorescence background and Raman peak areas change with laser exposure at different periods of irradiation time. The left axis in Figure 3B corresponds to the curve of fluorescence area calculated at each irradiation time. The curve is fitted to a double exponential function (red line), indicating that the fluorescence level decreased at the beginning in more rapid fashion than ensuing time periods. The right axis of the graph represents the Raman peak areas. While fluorescence area shows an exponential decrease, no systematic (accompanying) change was observed in Raman peak area as the photobleaching progressed. There were no changes in peak positions, peak broadening or any changes in general shape. Thus, it is reasonable to infer that Raman photons are not affected by continuous laser exposure and remain unchanged throughout.
Concluding remarks
Resonant interaction of an exciting laser with electronic sample states, which produces orders of magnitude higher intensity fluorescence background than that of Raman signatures, is the well-known nemesis of Raman spectroscopy. If the sample exhibits a fluorescence effect, in most cases, the effect may be so intense that the Raman signatures cannot be detected, thus precluding a reliable analysis. Subjecting a specimen to prolonged photobleaching by continuously irradiating it with laser light is demonstrated to reduce the fluorescence background exponentially, without affecting the Raman peak area or the Raman peak heights calculated from the absolute peak height above the local background.
Acknowledgment
The present work was financially supported by NSF-Engineering Research Center for Structured Organic Particulate Systems (ERC-SOPS, EEC-0540855). The authors also acknowledge Professor Rodolfo J Romañach at the University of Puerto Rico – Mayagüez Campus, for his careful review of the manuscript.
References
- Rehrauer OG, Mankani BR, Buzzard GT, Lucier BJ, Ben-Amotz D. Fluorescence modeling for optimized-binary compressive detection Raman spectroscopy. Optics Express. 2015;23(18):23935-23951.
- Lieber CA, Mahadevan-Jansen A. Automated Method for Subtraction of Fluorescence from Biological Raman Spectra. Applied Spectroscopy. 2003;57:1363-1367.
- Beier BD, Berger AJ. Method for automated background subtraction from Raman spectra containing known contaminants. Analyst. 2009;134(6):1198-1202.
- Zhao J, Lui H, McLean DI, Zeng H. Automated autofluorescence background subtraction algorithm for biomedical Raman spectroscopy. Applied Spectroscopy. 2007;61(11):1225-1232.
Biography
 DERYA CEBECI-MALTAŞ is currently with PortMera (in Technopark Istanbul) as a Research Chemist, applying vibrational spectroscopy and chemometrics to develop realtime measurement systems for continuous pharmaceutical manufacturing. She has a PhD in Analytical Chemistry from Purdue University and holds an MBA from Ball State University. Prior to joining PortMera, she worked at the FDA as a postdoctoral fellow, generating spectroscopy methods for at-field counterfeit screening applications.
 MD ANIK ALAM is currently pursuing his PhD degree in Pharmaceutics from Duquesne University. He has been working on the development of multivariate calibration in spectral space for quantitative analysis of pharmaceutical tablets. His research activities also include the implementation of process analytical technology and quality by design principles in pharmaceutical manufacturing set-up to monitor and control unit operation processes.
 PING WANG received his PhD from Wuhan Institute of Physics and Mathematics, Chinese Academy of Science. He did postdoctoral research at Purdue University’s Departments of Physics (2008-2010), Chemistry (2011-2012), and Biomedical Engineering (2012-2015). He is currently Professor at Wuhan National Laboratory for Optoelectronics. His research focuses on labelfree chemical imaging of cultured cells, unprocessed tissues, live organism and human diseased tissues by stimulated Raman scattering microscopy.
 DOR BEN-AMOTZ obtained his PhD from UC Berkeley, followed by a postdoctoral fellowship with Dudley Herschbach at the Exxon Corporate Research Lab in Annandale, NJ. He has been a faculty member in the Department of Chemistry at Purdue University since 1989. His recent experimental and theoretical interests include hydration-shell spectroscopy, liquid theory, hyperspectral compressive imaging, and new ways of teaching physical chemistry.
 RODOLFO PINAL is Associate Professor of Industrial and Physical Pharmacy at Purdue University. Prior to his academic appointment, he worked at Hoffmann-La Roche (Nutley, NJ) for 13 years, where he was Head of the Solid-State Characterisation Laboratory. His research interests include the study of raw material functionality and manufacture of personalised medications.
Issue
Related topics
Related organisations
Duquesne University, Portmera Research, Purdue University, Wuhan National Laboratory for Optoelectronics
Related people
Derya Cebeci-Maltaş, Dor Ben-Amotz, Md Anik Alam, Ping Wang, Rodolfo J Romañach, Rodolfo Pinal

Many thanks for the explanation but there are another reason for the florescence I think .the substrate have a big effect on the fluorescence density. one you use a pure material as a substrate with high absorptivity that will reduce a lot the fluorescence. That’s what I found in my experiments.