Raman spectroscopy of the amorphous phase from silicon to pharmaceutical drugs – a brief overview
Posted: 1 July 2019 | Zafar Iqbal | No comments yet
Zafar Iqbal sheds light on how Raman spectroscopy is used to detect and understand the amorphous phase in a range of solids, providing examples of his own laboratory applications.

Abstract
The following is a short overview of the use of Raman spectroscopy, particularly in the low wavenumber lattice and intermolecular mode region, to detect and understand the amorphous phase in solids ranging from that in plasma-grown nanoscale silicon to organic molecule pharmaceutical drugs. Examples from work in the author’s laboratory on silicon and pharmaceutical drugs, acetaminophen, fenofibrate and griseofulvin are discussed.
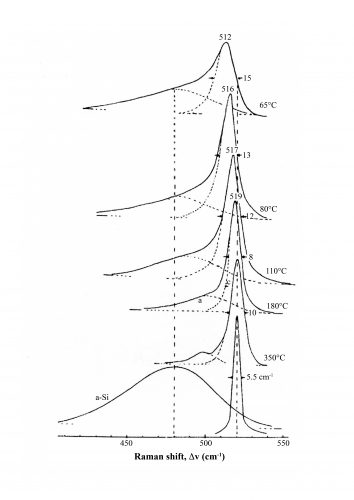
Figure 1: Raman spectra of the Si-Si Γ25’ mode of nanoscale silicon deposited in a hydrogen plasma at
different temperatures. The crystallite sizes decreasing with reducing deposition temperatures were obtained from X-ray diffraction linewidths. The bottom spectra
are those of plasma-deposited X-ray amorphous silicon and single crystal silicon.
Raman spectroscopy is used to detect and study the fundamental atomic vibrational modes of extended inorganic semiconductor structures, such as that of silicon. It is also used to similarly examine the fundamental Raman-active vibrational modes of molecular organic solids used as the bioactive ingredient in pharmaceuticals. In the face-centred cubic crystal of silicon there is only one type of fundamental atomic motion comprised of Si-Si vibrations that gives rise to a narrow Raman line at 520cm-1. In pure organic solids where the molecules are held together mostly by van der Waals forces – and in some instances by hydrogen bonding – there are two types of Raman active modes: one referred to as lattice or inter-molecular modes and the other as intra-molecular or internal modes associated with the molecular modes of the molecules forming the solid. The lattice modes lie in the low wavenumber region, typically below 200cm-1, whereas the intra-molecular modes range in wavenumbers from 300 to 3,300cm-1. In molecular solids, the lattice modes are either translational motions of the centre of mass of the molecules or hindered molecular rotations. Typical pharmaceutical and biomedical applications of Raman spectroscopy involve investigations of intra-molecular modes showing Raman shifts that are usually greater than 200cm-1. In the past, lower frequency modes were not investigated due to the limitations of optical filters used to remove the intense, elastic Rayleigh scattering from the samples. However, with recent advances in optical technologies, low frequency Raman spectroscopy (LFRS) to well below 200cm-1 can now be rapidly performed with the same sensitivity and resolution as higher frequency spectroscopy. LFRS enables the detection of crystalline features via the appearance of lattice modes in organic solids in the early or later stages of crystallisation from the amorphous phase and the appearance of short-range order in the amorphous phase of extended solids, such as silicon and diamond.
Figure 2: The low frequency Raman spectra of the amorphous and crystalline phases I, II and III polymorphs of acetaminophen.
The concept of phonons as collective modes propagating through the material was first developed in 1912 by Debye who realised, in contrast to Einstein, that low energy vibrational excitations in solids are not just oscillations of single atoms, but are collective modes that propagate throughout a lattice and accept energy in discrete amounts within the formalism of quantum mechanics. Phonons therefore behave as quasi-particles with definite energies and directions of vibrational motions analogous with photons and likewise obey Bose-Einstein statistics. The theoretical underpinning of lattice dynamics associated with phonons, as formulated by Born and von-Karman,1 adopts the symmetry of the crystals in a harmonic potential under adiabatic conditions. Within the framework of thermodynamics, an adiabatic process involves one that takes place without transfer of heat or matter between a thermodynamic system and its surroundings. As a consequence of crystal symmetry, the properties of the entire crystal can be obtained from that of a small region of the crystal.
In crystalline, extended solids, phonons of only one type comprising interatomic vibrations exist as noted above. In bulk crystals, such as that of cubic silicon, only one sharp and symmetric fundamental line at 520cm-1 is Raman active. As shown in Figure 1, this line decreases in frequency due to phonon confinement with reduced crystal size2 and broadens asymmetrically due to increase in the surface-to-bulk ratio resulting in the initial stages of amorphous phase formation on the nanocrystal surfaces. Below the crystal size limit of about 35Å (achieved at a plasma deposition temperature of 65°C, shown in Figure 1) the crystalline state becomes thermodynamically unstable and transforms to a purely amorphous phase with a broad Raman spectrum peaking near 480cm-1. The amorphous phase in silicon and similar structures can be considered to comprise of highly disordered atoms that can be modelled as a random ‘walk’ with regions of short-range crystalline order.3
Figure 3: Low wavenumber Raman spectra below 200cm-1 at room temperature of pure fenofibrate (panel A) and high
wavenumber Raman spectra in the 1,500-1,700cm-1 (panel V) spectral region for its crystalline phases I and II polymorphs and the amorphous phase III.
In most organic solids, however, the amorphous phase is ‘glassy’ with no indication of even short-range order. The Raman spectrum is therefore featureless as for the pharmaceutical fenofibrate shown in Figure 3. When intermolecular hydrogen bonding is present, as in the pharmaceutical acetaminophen, the Raman spectrum depicted in Figure 2 of the amorphous phase below 200cm-1 shows a broad feature overlapping the lines associated with its lattice modes. This indicates the likely presence of short-range ordered regions in the amorphous phase. The higher frequency Raman spectra for both amorphous fenofibrate and acetoaminophen retain relatively sharp features that are somewhat broadened and shifted from that observed in the crystalline phase. This indicates that intra-molecular order is largely retained in the amorphous phase of organic solids.
The broadening and wavenumber shifts reflect changes in potential energy due to the fundamentally metastable amorphous phase. Another feature of the organic amorphous phase is displayed in Figure 4, which shows the normal Raman spectrum in the higher frequency region of the molecular modes of the pharmaceutical griseofulvin. The surface-enhanced Raman spectrum (SERS) taken at a low concentration from a nanostructured substrate provides the spectrum of a finite number of molecules.4 Note that the SERS molecular spectrum is essentially the same as the solid-state spectrum of the amorphous phase. This suggests that the amorphous phase in an organic solid, such as griseofulvin, is a random or glassy distribution of molecules.
Figure 4: Normal Raman spectrum of the amorphous phase of the pharmaceutical drug griseofulvin (top) and SERS spectrum of a 10-3 M griseofulvin solution in acetone on adiatom substrate (bottom).
Biography
ZAFAR IQBAL obtained his PhD in physics from the University of Cambridge followed by a postdoctoral fellowship at the University of Warwick. He has been on the faculty in the Chemistry Department of the New Jersey Institute of Technology since 2001. Prior to that he was at Honeywell/AlliedSignal, the University of Zurich and the Swiss Federal Institute of Technology (ETH) in Zurich. His current research interests include biological fuel cells, surface enhanced Raman and chromatic sensing and plasma synthesis of novel nanomaterials.
References
- Born M, Huang K. “Dynamical Theory of Crystal Lattices” Clarendon Press, Oxford (1954).
- Iqbal Z, Veprek S. “Raman Scattering from Hydrogenated Microcrystalline and Amorphous Silicon” Phys. C 15, 377 (1982).
- Veprek S, Iqbal Z, Sarott FA. “A Thermodynamic Criterion for the Crystalline-to-Amorphous Transition in Silicon” Mag. B45,137 (1982).
- Luczak A, Iqbal Z. “Using gold to enhance Raman scattering techniques” European Pharmaceutical Review 20, 34-38 (2015).