Principal component analysis of Raman spectra for freeze-drying process monitoring
Posted: 31 August 2021 | Lukas Kuerten (CPI Biologics), Rachel Findlay (CPI Formulation) | No comments yet
Optical spectral measurement tools are extremely useful both for in-line measurements in process analytical techniques (PATs) as well as for evaluating the composition of finished substances. Here, CPI’s Lukas Kuerten and Rachel Findlay demonstrate a valuable method for gaining useful information from spectral data.

WHILE OPTICAL spectral measurement tools are fast, non-invasive, do not require consumables and can ideally be incorporated directly into processes, the large amount of data generated from techniques such as Raman1,2 or infrared (IR) spectroscopy3 is both a benefit and a burden. It is true that optical measurements can be highly informative and precise, but correct interpretation of the data is essential and not necessarily straightforward.
Typically, the analytical scientist will inspect the spectrum of the compound under investigation and compare it to reference spectra of the candidate constituent materials and thereby attempt to determine the chemical composition of the specimen, or attempt to fit the measured curve to some modelled reference data.
However, even pure substance spectra usually consist of a multitude of spectral features and if the substances are similar (a range of hydrocarbons, for example) their spectra are often similar as well, making it difficult and cumbersome to unequivocally identify the constituents, let alone quantify their respective fractions. In addition, pre‑processing is often necessary before any analysis can be performed, such as baseline subtraction (which requires additional measurement time) and differentiation (which can strongly amplify noise in the data).
PCA improves our ability to interpret PAT data and can even be used to automate analysis of such data and empower automated control strategies”
As an alternative to curve fitting and regression, principal component analysis (PCA)4,5 can be used to analyse spectra from Raman and near-IR (NIR) measurements.6 PCA is fast and straightforward, requiring only minimal pre-processing of the data. It does not even require knowledge of the compounds expected in a substance, as it does not rely on “pure” spectra for fitting. In fact, the spectra of the pure components can be obtained as a result of the PCA.
PCA is a well-known technique for the analysis of multivariate data. Very generally, a PCA algorithm rearranges data by categories (the ‘principal components’) of decreasing importance. Ideally, all information of consequence from a large table of data can be compressed into just a handful of principal components while noise is discarded by the algorithm.
Here, we present how PCA can be used as a process analytical technique (PAT) for a freeze‑drying process. PCA identifies the crucial process parameters in a fast and robust way and gives essential information on the freeze‑drying process, which would be difficult to obtain from the noisy raw data by curve fitting and regression. Monitoring freeze-drying processes by optical spectroscopy is a well-known technique, and analyses of such spectra by PCA have been performed in the past in various circumstances.7,8
Raman freeze drying case study
Here, we illustrate the utility of PCA for data analysis with example data from a recent collaborative project. Without going into detail about the experimental methods, we aim to highlight the power of this analysis method. In our project, we performed both Raman and NIR monitoring of freeze-drying processes and analysed the resulting data using PCA. The algorithm produced consistent results for both datasets, but for the sake of clarity we are concentrating on the Raman analysis in this article.
We present data from the freeze-drying process of an antibody in glycine solution, which was monitored by Raman spectroscopy. Freeze drying is widely used for the long-term preservation of pharmaceuticals, food and other substances. It is an efficient method to extract the water content of an aqueous substance without damaging the compound but is also a complex process, requiring close supervision.
The smoothed but otherwise unprocessed Raman spectra as functions of Raman shift for different process steps are shown in Figure 1. Changes in the spectra as the sample moves through the different process steps are visible, but the data is rather noisy and the location of the various process steps is far from clear.
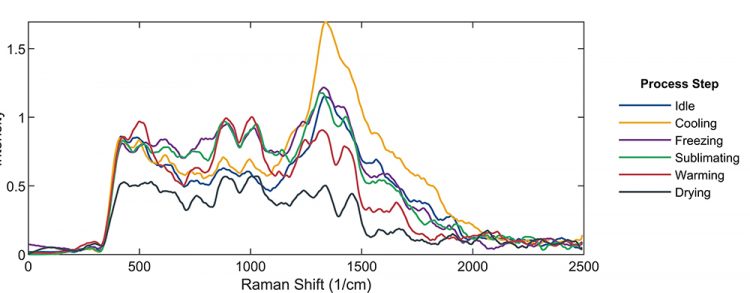
Figure 1: Smoothed Raman spectra of the substance at different stages of the freeze-drying process.
To separate the process data from the noise and unrelated signals, we perform PCA. Even though the PCA for this particular analysis was programmed explicitly and the underlying mathematical framework is complex, we emphasise that many software tools such as SAS-JMP or the PLS toolbox for MATLAB exist, which offer a graphical interface to perform PCA without a deeper understanding of the mathematical complexities.
The matrix of raw data was analysed and decomposed into principal components. These are rearrangements of the original data designed to capture as much of its variance as possible. This procedure enables the separation of meaningful signals from noise and compresses the data from many original datapoints (in this case, spectra of 1,000 points each) into a small number of principal components. While a detailed description of the underlying mathematics is beyond the scope of this article, it is noteworthy that PCA involves only matrix algebra and no fitting or optimisation, making it both fast and robust to missing data. Furthermore, in contrast to most optimisation and fitting algorithms, PCA is not affected by local minima within the data.
Having obtained the result of our PCA, we now plot the first four PCs as a function of time, shown in Figure 2. These principal components capture most of the variability in each individual spectrum, while higher-order PCs capture mostly noise and can be discarded. Thus, PCA retains the most important data while still significantly reducing the size of the dataset. Comparing the time evolution of the PCs to the process data, we find that for each event in the freeze-drying process (eg, crossing the freezing threshold, initiation of drying, etc), a clear reaction in at least one of the principal components can be observed. Furthermore, when we plot the ‘scores’, ie, the projections of datapoints onto the PCs, against one another, there is clear clustering of the scores belonging to different process steps.
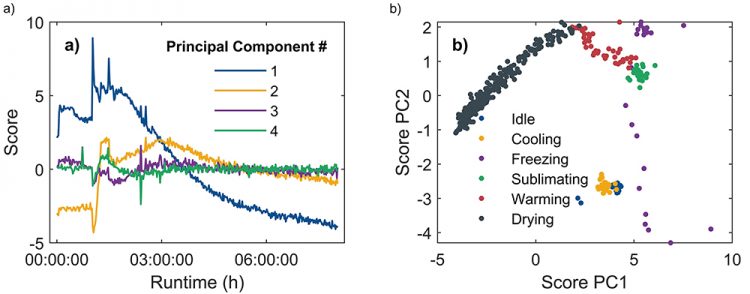
Figure 2 a: Scores on the first four principal components as a function of process runtime. Changes in the components can be associated with specific steps of the freeze-drying process. b: PC 1 and PC 2 plotted against each other. The trajectory is separated into distinct clusters, which again correspond to the individual process steps.
In a machine learning approach, once the PCA has been performed for one process, it can be used to monitor and control other processes. Instead of fitting or interpreting individual spectra as the process proceeds, it is sufficient to monitor the principal component values to understand, and if necessary control, how the process evolves. Another useful feature of PCA is demonstrated in Figure 3. While the scores inform on how individual datapoints contribute to the components, “loadings” are a measure of how the components relate to the variables (in this case, the frequencies of the spectrum). It is clear from Figure 3 that the loadings for the different PCs are centred in different wavenumber ranges of the spectra. By comparing these frequency weightings to known spectra of pure substances, the PCs can be related to the fractions of those substances for an unknown compound.
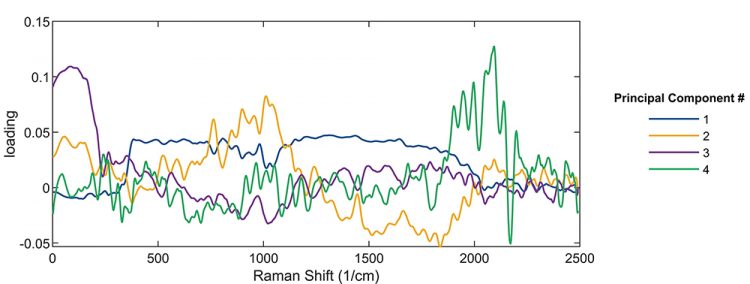
Figure 3: Loadings of the first four principal components as a function of Raman shift. Using this plot, one can identify which principal components correspond to which spectral region, and correspondingly, to which compound.
In this way, PCA can supplement and even replace curve fitting and expert analysis of Raman spectra. The simplicity of PCA and its small computational footprint make it suitable for rapid analysis – thus, it can be used as an efficient PAT. The output of the PCA algorithm can additionally be used as input for a control algorithm and hence facilitate advanced automated process control.
Conclusion
In combination with optical spectral measurements, PCA is a powerful tool but nonetheless simple to use. PCA improves our ability to interpret PAT data and can even be used to automate analysis of such data and empower automated control strategies. While in this article we present the utility of PCA for monitoring freeze-drying with Raman spectroscopy, the features demonstrated here can in principle be extended to any process analysed by optical spectroscopy.
About the authors

Lukas Kuerten is a Senior Data Scientist at CPI Biologics. With a background in physics and experience in the laboratory, he is helping to transform CPI to a digital and data-driven enterprise. He is involved both in the analysis of data from biological systems and the implementation of automation and advanced process control in the laboratory.

Rachel Findlay is a Senior Data Scientist at CPI Formulation. She has a mathematics background, holds a biophysics PhD and has several years’ experience developing predictive mathematical models, developing image analysis methods and applying data science techniques to help understand and characterise complex systems. Within CPI, Rachel is helping to lead the development of innovative tools that allow data science techniques to be rapidly built, maintained and re-applied across manufacturing sectors.
List of authors
- CPI – Lukas Kuerten, Rachel Findlay, Harvey Branton, Stuart Jamieson
- University of Nottingham – Jonathan Burley
- De Montfort University – Geoff Smith
- IS-Instruments Ltd. – Jonathan Storey, Charles Warren
- National Institute for Biological Standards and Control – Paul Matejtschuk
Acknowledgements
This project was funded by Innovate UK.
References
- Raman CV, Krishnan CRKK. “A New Type of Secondary Radiation,” Nature, 121, p. 501, 1928.
- McCreery RL. Raman spectroscopy for Chemical Analysis, New York: Wiley-Interscience, 2000.
- Stuart BH. Infrared Spectroscopy: Fundamentals and Applications, Weinheim: John Wiley & Sons, Ltd, 2004.
- Pearson K. “On Lines and Planes of Closest Fit to Systems of Points in Space,” Philosophical Magazine, 559–572, 1901.
- Joliffe IT. Principal Component Analysis, New York: Springer, 2002.
- Biancolillo A, Marini F. Chemometric Methods for Spectroscopy-Based Pharmaceutical Analysis, Frontiers in Chemistry, 6, p. 576, 2018.
- De Beer TRM, Vercruysse P, Burggraeve A, et al. In-line and real-time process monitoring of a freeze drying process using Raman and NIR spectroscopy as complementary process analytical technology (PAT) tools. Journal of Pharmaceutical Sciences, 98, no. 9, pp. 3430-3446, 2009.
- Romero-Torres S, Wikström H, Grant ER, Taylor LS. Monitoring of mannitol phase behavior during freeze-drying using non-invasive Raman spectroscopy. PDA J Pharm Sci Technol, 61, no. 2, pp. 131-45, 2007.