Real-time Transition Analysis curve in column chromatography with SIMCA®
Posted: 28 October 2021 | Alejandro Toro (Amgen Manufacturing Limited), Badua Merheb (Amgen Manufacturing Limited), Melvin Ortiz (Amgen Manufacturing Limited), Pablo J Rosado (Amgen Manufacturing Limited) | No comments yet
Transition Analysis (TA) is a method traditionally used to evaluate the condition and integrity of a chromatography column. However, this method generally requires conducting complex data post‑processing and calculations which are hard to automate and to run in real time during the manufacturing process. Thus, completing the TA offline leads to time-consuming efforts that may delay the subsequent manufacturing operations. Colleagues from Amgen Manufacturing Limited developed an automated method using SIMCA® and SIMCA®-online to compute the TA curve in real time, allowing them to monitor and verify the condition of their column chromatography steps with limited operator input and no impact on manufacturing rate.

Introduction
Column chromatography steps are among the main unit operations in the purification area of any biopharmaceutical manufacturing setup. To ensure consistent product quality, it is essential to regularly monitor performance for consistency, degradation, efficiency and integrity. There are multiple techniques that have been used to evaluate chromatographic performance. One traditional technique is a pulse injection integrity test, generally used to assess the efficiency of a newly packed column.1 This method requires conducting an additional activity at the column to generate the data needed to calculate the height equivalent of a theoretical plate (HETP) and Asymmetry factor (Af) based on the normal distribution of an elution peak.
Transition Analysis (TA) is another promising technique for evaluating column performance. TA consists of measuring and inspecting the response of a signal (eg, conductivity) at the column outlet to a step change caused by an input solution,2,3 which can be measured during normal column operations, avoiding the additional activity required for the pulse injection integrity test. When performing TA, a first derivative transition analysis curve (TA curve) is calculated on the chromatographic transition,1,4 leading to a bell-shaped curve. HETP and Af can also be computed based on this transition curve.
The TA method described above often poses several challenges. First, it relies on collecting high‑frequency data that needs to be processed with a complex algorithm for filtering and calculating interpolations and derivatives.3 Second, these calculations are generally performed offline due to the challenges of automating them with some of the traditional analytics packages while the chromatographic transition is occurring. Thirdly, the prospects of validating these TA methods were low due to the complexities of validating such a manual and person-dependent approach. Lastly, these complex offline calculations take time and labour, causing commercial manufacturing to delay its subsequent operations. This last challenge is becoming increasingly important as demand for increased manufacturing capacity and efficiency grows.2
There have been recent efforts to automate TA and the calculations of column performance indicators (eg, HETP and Af). J Reckamp,3 for example, presented an automatic approach using the software Seeq®. However, manual TA calculations still prevail in many biotechnology settings. These calculations are often performed using spreadsheet software such as Microsoft (MS) Excel. Although MS Excel provides an extensive list of mathematical functions, some of which are necessary to quickly perform first derivative calculations, this method is prone to errors due to its inherent nature of manually querying and transforming process data. It is also time consuming and delays operation activities.
We developed a method using SIMCA®5 and SIMCA®-online6 to compute in real time the TA curve while the column is either being equilibrated in preparation for use or during any of the post‑elution steps where there is a well-defined output signal transition. The mathematical functions in SIMCA are very limited and lack the functions typically used offline in MS Excel. However, by creatively combining the few mathematical functions available in the software, we were able to replicate the more advanced functions required to generate the TA curve. Additionally, with the use of SIMCA-online, we can now obtain the TA curve in real time, while manufacturing activities on the chromatography column are ongoing, avoiding operational delays due to manual calculations.
Methodology
Translating offline calculations to SIMCA
When performing transition analysis manually, the slope, S, formula7 in (1) is readily available in software such as MS Excel and can be used to obtain the transition curve. To do so, (1) is applied to vectors of transition data to obtain a first derivative of a conductivity signal with respect to totalised flow volume. Thus, when applying (1), V represents totalised flow volume, C represents conductivity, and V_ and C_ represent sample means of totalised flow volume and conductivity, respectively. (1) 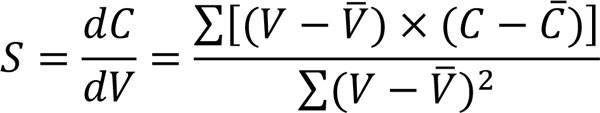 Although this exact formula is not available in SIMCA, we developed a method that replicates the calculations obtained with (1). Table 1 lists the mathematical functions available in SIMCA that can be combined to mimic the TA curve calculated manually. The key to solving the TA curve, STA, in SIMCA was deciphering how to compute moving averages on any given variable. A moving average, N_Z, can be obtained by applying the Lag function as (2)
 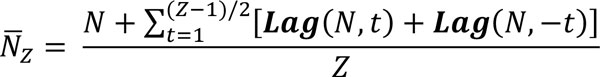 where N is a vector of any given variable, Z is an odd number representing the number of values used for calculating a sample average, and N_Z is a vector of moving averages of N using Z-values. For example, a three-value moving average on vector N can be expressed as (3)
 ![]()
Calculating the TA curve in SIMCA
The steps defined below can be followed to obtain TA curves in SIMCA that are equivalent to the curves obtained with traditional spreadsheet software. First, the original transition data needs to be post-processed and filtered for noise. The original data on flow rate, Fr, measured at a frequency of s seconds, is converted to totalised flow volume, VT, and normalised by Column Volume, VC, as (4) 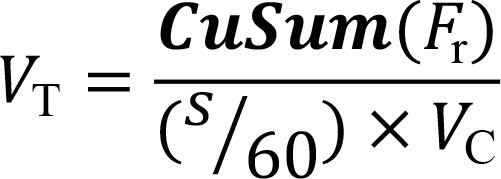 where frequency s is divided by 60 to convert to minutes. We suggest using data recorded at a frequency of two seconds because it provides sufficient resolution without overwhelming the calculation engine.
Let C be the original conductivity data measured at the same frequency of flow rate. Performing the post-processing and noise filtering on C offline would be achieved by computing a moving average. We achieved this post-processing in SIMCA by employing (2). While there is no standard or recommendation on what value of Z should be used, we used here Z = 11 to match the results from the manual approach presented below in the Results section. Thus, the smoothed conductivity C_11, is obtained as (5) 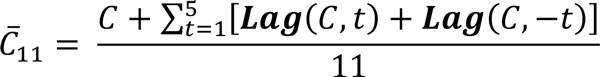 A normalised smoothed conductivity C_N was then obtained as Norm(C_11). Now that the original transition data has been post-processed, we proceeded to solve for each term in the slope equation, S (1). Like the signal smoothing calculations, there is no standard on the sample size when calculating sample means. Hence, using Z = 5 to match the sample size in the manual approach, the sample means V_ and C_ were obtained by applying (2) as (6)
 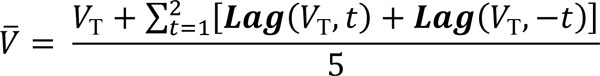 (7)
(7)  The summations in the numerator, dC, in (1) were obtained using once again the Lag function. The number of terms in the summation should match the Z value used when applying (2). Thus, in our example, dC is obtained with a five-term summation as (8)
 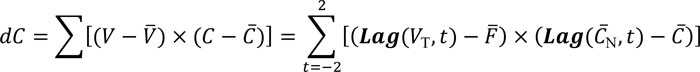 Similarly, the denominator, dF, in (1) can be obtained as (9)
 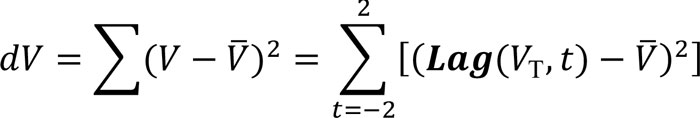 Finally, the first derivative TA curve, STA, is obtained as (10)
Results
To demonstrate the proposed method, we illustrate transition data from a commercial process recorded and plotted in real time during a transition activity of a chromatography column. Figure 1 shows the original flow rate (a) and conductivity (b) as it was recorded in real time with SIMCA-online while the process was ongoing. The maturity variable for both trends in Figure 1 is the totalised transition flow normalised to column volume. 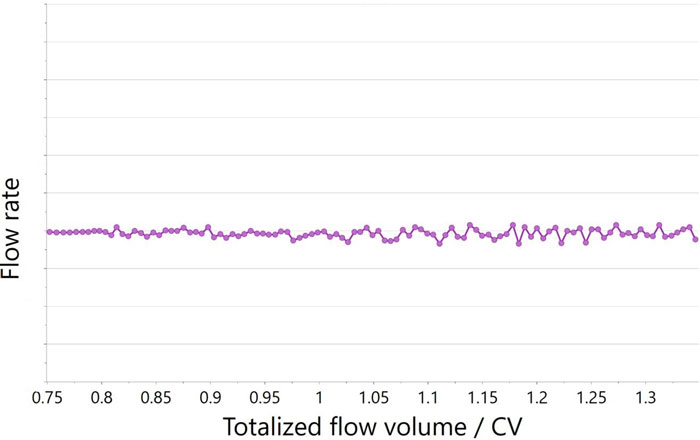
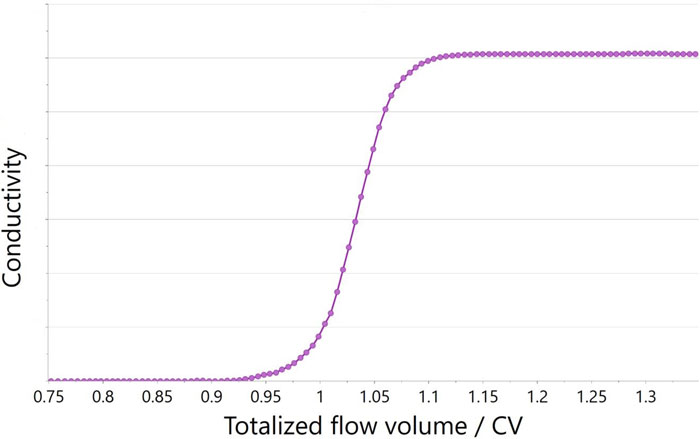
Figures 1a and 1b: Original data captured in real time with SIMCA®-online for (a) flow rate and (b) conductivity
Figure 2 illustrates the TA curve that appeared in SIMCA-online based on the same original flow rate and conductivity data shown in Figure 1. Since the TA curve calculations require data processing that depends on normalisation and on the Lag function, the curve appears automatically in SIMCA-online only after the transition phase has concluded.
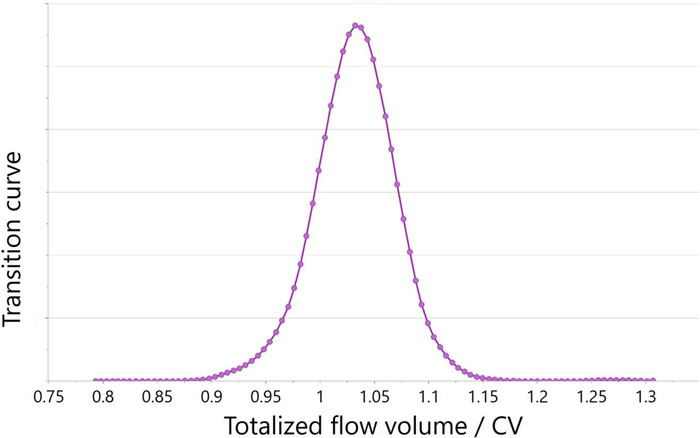
Figure 2: TA curve (dC/dV) calculated in SIMCA®-online based on the data from Figure 1
Figure 3 compares TA curves obtained in SIMCA‑online to those calculated offline in MS Excel. The TA curves in Figure 3a were obtained from a manufacturing unit and batch different than that of Figure 3b. The TA curves obtained online have a nearly identical shape and size to the curves obtained offline. 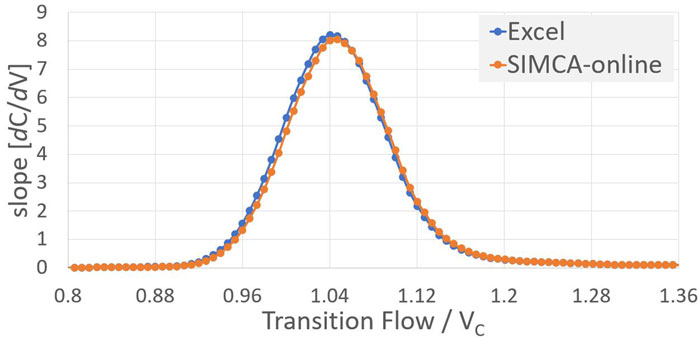
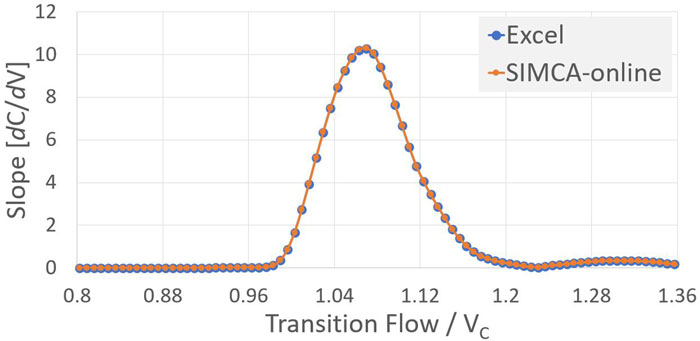
Figures 3a and 3b: TA curves (dC/dV) calculated in SIMCA®-online compared to the TA curves obtained offline. TA curves in panel (a) are for a column and lot different than those in panel (b).
Discussion
Value proposition of the real-time TA curve
We presented a method that can be easily adopted by any company that uses SIMCA for real-time monitoring of their column chromatography operations. A model based on these calculations can be developed and quickly deployed into a good manufacturing practice (GMP) and validated production environment for agile analysis of chromatography operations. As such, with minimum effort, it is possible to build a collection of TA curve models for different chromatography units. This presents an opportunity to easily standardise how a manufacturing setting may monitor in real time the condition and efficiency of their chromatography operations with limited operator input and no impact to manufacturing rate.
Next steps
The Direct Transition Analysis (DTA) method developed by Cui et al.1 proposes two performance indicators: a) transition width (TransWidth) and b) direct asymmetry (DirectAf), which can be directly extracted from the transition data without complex signal processing. These two indicators are analogous to the commonly used HETP and Af, respectively.
Therefore, our proposed real-time method for obtaining the TA curve can be greatly enhanced by having real-time and automatic results of HETP and Af, TransWidth, and/or DirectAf. The authors are actively engaged with Sartorius to advance our real-time TA curve method by incorporating online calculations of the above-mentioned performance indicators for a more robust chromatographic analysis.
Acknowledgements
The authors would like to thank their Amgen colleagues: Carlos Domínguez, Christopher Garvin, Daniel Chow, Deborah Soto Ortega, Abhishek Ramanathan, Taína Franco and Michelle Burgos Ortiz. They also want to recognise the contributions from Scott Carpenter, Anna Persson and Amin Ganjian from Sartorius.
References
- Cui Y, Huang Z, Prior J. Using direct transition analysis in chromatography. BioPharm International [Internet]. 2018 Jan [cited 2021 Aug 06]; 31(1):34-40. Available from: https://www.biopharminternational.com/view/using-direct-transition-analysis-chromatography
- Larson T, Davis J, Lam H, Cacia J. Use of process data to assess chromatographic performance in production-scale protein purification columns. Biotechnology Program [Internet]. 2003 [cited 2021 Aug 06]; 19(2):485-92. Available from: https://doi.org/10.1021/bp025639g
- Reckamp J. Using online transition analysis to predict chromatography column failure. Pharmaceutical Technology [Internet]. 2020 Apr [cited 2021 Aug 06]; 44(4):38-41. Available from: https://www.pharmtech.com/view/using-online-transition-analysis-predict-chromatography-column-failure
- Martin A J P, Synge R L M. A new form of chromatogram employing two liquid phases: 1) a theory of chromatography 2) application to the micro-determination of the higher monoamino-acids in proteins. Biochem J [Internet]. 1941 Dec [cited 2021 Aug 06]; 35(12):1358-68. Available from: https://doi.org/10.1042/bj0351358
- SIMCA® Multivariate Data Analysis Solution. Version 16.0.2.10561 (64-bit); Sartorius Stedim Data Analytics AB, Goettingen, Germany. Available from https://www.sartorius.com/en/products/process-analytical-technology/data-analytics-software/mvda-software
- SIMCA®-online. Version 16.1.1.16164 (64-bit); Sartorius Stedim Data Analytics AB, Goettingen, Germany. Available from https://www.sartorius.com/en/products/process-analytical-technology/data-analytics-software/mvda-software
- Microsoft Support [Internet]. SLOPE function. [cited 2021 Aug 02]; Available from: https://support.microsoft.com/en-us/office/slope-function-11fb8f97-3117-4813-98aa-61d7e01276b9
About the authors
 Pablo J Rosado is a Process Development Data Scientist at Amgen Manufacturing Limited in Juncos, Puerto Rico, supporting initiatives related to process monitoring, data analytics and digital transformation. He has a BS in Mechanical Engineering from the University of Puerto Rico at Mayagüez, as well as a MS and PhD in Mechanical Engineering from the University of California at Berkeley. Pablo joined Amgen in 2017 after completing a Postdoctorate fellowship at Lawrence Berkeley National Laboratory and Postdoctoral fellowship training with Insight Data Science.
 Melvin Ortiz is a Principal Engineer at Amgen Manufacturing Limited in Juncos, Puerto Rico. He has a BS in Chemical Engineering from the University of Puerto Rico at Mayagüez, as well as a MS in Chemical Engineering from Purdue University. He has over 23 years of experience in commercial manufacturing with 17 years supporting downstream biotechnology manufacturing.
 Badua Merheb is a Data Sciences Senior Manager at Amgen Manufacturing Limited in Juncos, Puerto Rico. He has a Bachelor of Science in Chemical Engineering from University of Puerto Rico at Mayagüez and a Masters in Engineering Management from the Polytechnic University of Puerto Rico. He has more than 24 years of experience in the pharma/biotech industries supporting upstream and downstream processes. He currently leads the Data Science and Analytics team in the Drug Substance Unit.

Alejandro Toro is currently the Executive Director of Drug Substance Process Development at Amgen Manufacturing Limited in Juncos, Puerto Rico supporting commercial operations for bacterial fermentation and mammalian cell culture manufacturing plants. He is responsible for the site’s Process Sciences, Attribute Sciences, Process Engineering (MS&T), Process Validation and Data Science & Analytics teams. Alejandro holds a BS in Chemistry from the Pontifical Catholic University of PR and a PhD in Protein Biochemistry from Rutgers University.
Issue
Related topics
Analytical techniques, Chromatography, Informatics, Lab Automation, Technology
Related organisations
Amgen Manufacturing Limited, FUJIFILM Wako Pure Chemical Co. Ltd.