Safeguarding purity under pressure: detecting nitrosamine contamination
Posted: 23 April 2024 | Venkata Ranga Rao Attaluri | No comments yet
In this article, analytical chemist Venkata Ranga Rao Attaluri explores the ongoing challenges posed by nitrosamine contamination in pharmaceuticals, highlighting the importance of robust and sensitive analytical detection methods.


In 2018 the discovery of unacceptable levels of N-nitrosodimethylamine (NDMA) and N-nitrosodiethylamine (NDEA) in angiotensin receptor blockers (ARBs) triggered increased regulatory focus on nitrosamines (NAs). Acceptable intake (AI) levels have since been established for a range of NAs with regulators (European Medicines Agency (EMA) and US Food and Drug Administration (FDA)) calling for submissions for any associated changes in existing market authorisations by 1 October 2023.1-2 This article considers the issues associated with meeting demand for appropriately sensitive analysis and includes details of a demonstrated method for NDMA detection in extended release (ER) metformin tablets.
The issue of NA contamination
NAs are characterised by both nitroso (N=O) and amine (NH2) functionality. Collectively referred to as a ‘cohort of concern’ by the International Council for Harmonization of Technical Requirements for Pharmaceuticals for Human Use (ICH), multiple NAs are classified as ‘probable human carcinogens’ by the International Agency for Research on Cancer (IARC). Following the initial 2018 ARB-related incident, NAs have been discovered in a range of pharmaceutical products, including ranitidine and metformin. To date, more than 1,400 batches have been recalled in efforts to minimise the associated risk to human health.2
NA contamination can occur in multiple ways; such as from by-product reactions associated with the use of nitrosating agents, the introduction of specific raw materials, manufacturing steps such as quenching, or progressive synthesis during storage. Identifying and controlling the root cause of NA contamination can therefore be challenging. Even relatively subtle process changes, such as a switch to alternative, more cost-effective reagents or the adoption of solvent recycling strategies, can prove problematic.
The FDA originally highlighted just seven NAs that could theoretically be present in pharmaceutical products, but the scope of concern has since broadened. The latest guidance includes AI limits for a wide range of nitrosamine drug substance‑related impurities (NDSRIs) reflecting growing concern over these product-specific contaminants. Indeed, NDSRI contamination has recently triggered two relatively high-profile product withdrawals: Orphenadrine Citrate tablets (Sandoz)3 and Quinapril HCl/Hydrochlorothiazide (Pfizer).4 More generally, regulation around NA contamination continues to evolve with the EMA issuing new guidance as recently as October 2023.1


Figure 1: Schematic showing nitrosamine formation.
A challenging analysis
The relative speed with which NA detection requirements have been established has left some scrambling to establish in-house capability and, more generally, threatened to severely test industry capacity for trace analysis. The 26.5ng per day AI levels established for compounds of most concern, such as NDEA, reflect their potential to cause harm at levels as low as parts per billion (ppb) but present a significant analytical challenge when it comes to robust detection. Contract providers have an important role to play in meeting this demand and have invested significant time and resources to the development and validation of advanced methods for detection that combine sensitivity, speed and flexibility.
Sensitivity
Liquid chromatography-mass spectrometry (LC/MS), LC/MS-N (multistage MS) and LC-High Resolution MS (HRMS) all have proven sufficiently sensitive for NA detection, with appropriate method development. Combining LC and MS brings the orthogonality needed for accurate detection at the lowest contaminant levels and addresses the challenge of isobaric species. Optimisation of the LC step with appropriate reference standards is critical when it comes to addressing solubility issues and mass suppression from excipient species; advanced extraction techniques can help to minimise sample loss, enhance recovery efficiency and keep NAs intact for identification. Robust atmospheric pressure chemical ionisation (APCI) can mitigate the ionisation effects caused by complex and variable sample matrices.
Speed
LC/MS techniques are also appealing from the perspective of speed and efficiency. The need to retrospectively analyse authorised products creates a significant analytical burden, but so too does the extension of measurement into new chemical entity development, where there is scope for process alteration. By minimising sample preparation, for example via direct injection or direct sample analysis, and adopting other streamlining strategies, LC/MS techniques can be shaped for relatively high productivity.
Flexibility
Flexible and robust methods are critical given the need to detect and quantify a wide range of NAs, NA precursors and NDSRIs in a multiplicity of drug products. Furthermore, each specific NA – drug combination requires a unique method and associated validation. Both triple quadrupole mass spectrometry (TQ‑MS) and HRMS platforms are valuable in this respect and a good choice when implementing LC/MS methods. That said, there are scenarios where even TQ systems may struggle; for instance, when dealing with drugs with a high maximum daily dose (MDD) for which AI specifications push detection techniques to their limit.
The validation guidelines shown in Table 1 are useful in supporting the development of methods that meet requirements and provide a useful checklist with respect to sensitivity, speed and flexibility.
| Parameter | Purpose | Acceptance Criteria |
| System precision | Ensures the consistency and reproducibility of the analytical system. | n Relative standard deviation (RSD) of peak area responses from six replicate injections of Level-4 standard solution: ≤ 15% |
| System suitability | Ensures accuracy and reliability in quantifying impurities across the linear range. | n Cumulative RSD of impurity peak area responses (including bracketing standards): ≤ 20% n Correlation coefficient (r) for impurity peak: ≥ 0.98 |
| Accuracy | Provides measurements closely aligned with the actual analyte concentrations. | n Recovery at each level: 70% – 130% n % RSD for LOQ: ≤ 30% n % RSD for all other levels: ≤ 25% |
| Limit of quantitation (LOQ) | Ensures robust and accurate detection down to low concentrations. | n LOQ: 1.0049 ng/mL (0.01005 ppm) n RSD of peak area response for six injections of LOQ solution: ≤ 25% n Signal to noise ratio for NDMA peak in LOQ solution: ≥ 10 |
| Limit of detection (LOD) | Ensures robust and accurate detection down to low concentrations. | n Average signal-to-noise ratio: NLT 3 |
| Specificity | Confirms the method’s ability to detect and quantify the impurity, free from interference. | n Peak area in blank at impurity peak retention time < peak area in LOD solution |
| Repeatability/Intermediate precision/Ruggedness | Demonstrates reliability and consistency in measuring impurity content. | n RSD for impurity content from six samples: ≤ 15.0% n Cumulative RSD for 12 samples from Repeatability and Intermediate precision: ≤ 20.0% |
| Stability of standard and sample solution | Ensures stability over time, leading to accurate and reliable measurements. | n Percent recovery of stability standard for standard solutions: 80% – 120% n Percent difference between impurity content in initial and stability sample: within 20.0% |
| Robustness | Ensures minor variations in experimental conditions do not significantly impact accuracy and precision. | n RSD of peak area response for impurity peak from six replicate injections of Level-4 standard solution: ≤ 15% |
Table 1: Validation criteria checklist
Case study: using TQ LC/MS/MS for the detection of NDMA
Linearity data for an LC/MS/MS method (TQ, AB Sciex API 6500) optimised and validated for the detection of NDMA in ER metformin hydrochloride tablets (500 and 1,000mg) is shown in Figure 2 and Table 2. The method was developed from a published FDA method utilising LC/HRMS5 with the aim of demonstrating the utility of a TQ system for this application.
| Linearity samples | Actual Concentration (ng/mL) | NDMA Area (counts) | Calculated Concentration (ng/mL) | % Accuracy |
| Level 1 | 1.0049 | 33,761 | 1.0268 | 102 |
| Level 2 | 2.5123 | 80,485 | 2.3614 | 94 |
| Level 3 | 5.0245 | 172,418 | 4.9874 | 99 |
| Level 4 | 7.5368 | 265,518 | 7.6467 | 101 |
| Level 5 | 10.0490 | 351,394 | 10.0996 | 101 |
| Level 6 | 20.0980 | 719,790 | 20.6225 | 103 |
| Slope | 35000 | |||
| Y-Intercept | -2190 | |||
| r | 0.9992 |
Table 2: Associated metrics for LC/MS/MS NDMA detection method
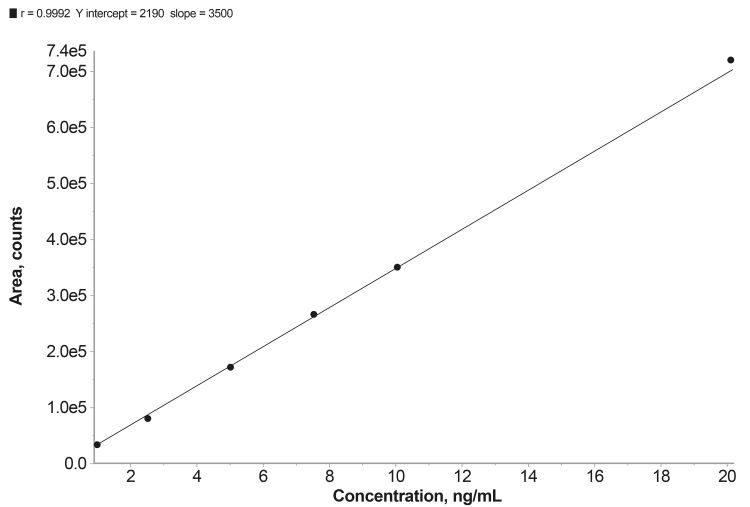

Figure 2: Linearity plot for LC/MS/MS NDMA detection method.
The method demonstrates excellent linearity across the concentration range spanned by the six calibration standards, which runs from one to 20 ng/ml. Accuracy is well within the acceptance criteria for each standard (80-120 percent), notably so for the most dilute, Level 1, Limit of Quantification (LOQ) solution (70-130 percent); the correlation coefficient r=0.9992 also meets the acceptance criteria (r not less than 0.98). The gradient of the curve (slope 35,000) indicates good sensitivity.
Table 3 shows data from repeat measurements of the LOQ calibration standard. The percentage relative standard deviation (RSD) of six percent is well within the acceptance criteria limits (not more than 25 percent) and the signal‑to-noise ratio is above the minimum value of 10 specified. The method therefore has a confirmed LOQ of 0.01005ppm and a limit of detection (LOD) as determined using the signal-to-noise ratio method of 0.00301ppm.
| LOQ Concentration | 0.01005 ppm w.r.t sample 1.0049 ng/mL | |
| Injection | Peak Area | s/n ratio |
| 1 | 33,108 | 28.1 |
| 2 | 32,132 | 84.2 |
| 3 | 30,216 | 25.6 |
| 4 | 34,823 | 10.4 |
| 5 | 30,506 | 15.5 |
| 6 | 35,030 | 32.6 |
| Mean | 32,636 | 33 |
| % RSD (for peak area) | 6 | NA |
Table 3: Repeat measurements of the LOQ calibration standard
Via rigorous validation testing the optimised method was shown to meet all the validation criteria and was subsequently used successfully for product testing. The LOQ and LOD figures for the method are especially noteworthy given the FDA requirement of an LOQ of 0.03ppm for products with a MDD < 880 mg/day, where the AI is 26.5 ng/day, and the most stringent EMA requirement of an LOQ ≤10 percent of the level indicated by the AI, where the ppm level of interest is determined by dividing the AI by MDD.6
Conclusion
The regulatory focus on NAs and NDSRIs has rapidly intensified and continues to evolve. It creates a need for highly sensitive analysis for samples that vary considerably with respect to the analyte of interest and associated matrix. Contract service providers have the expertise to help the industry develop and apply relevant methods to meet the significant analytical burden efficiently and at pace. Case studies such as the one presented here showcase their capabilities.
About the author
Venkata Ranga Rao Attaluri


References
1. ‘Question and answers for marketing authorisation holders/applicants on the CHMP Opinion for the Article 5(3) of Regulation (EC) No 726/2004 referral on nitrosamine impurities in human medicinal products’ EMA/409815/2020 Rev.19. [Internet] European Medicines Agency. 2023. [cited 2024Jan]. Available from: https://www.ema.europa.eu/en/documents/referral/nitrosamines-emea-h-a53-1490-questions-and-answers-marketing-authorisation-holders-applicants-chmp-opinion-article-53-regulation-ec-no-726-2004-referral-nitrosamine-impurities-human-medicinal-products_en.pdf
2. Guidance for Industry ‘Control of Nitrosamine Impurities in Human Drugs’ Rev 1. [Internet] US Food and Drug Administration, Center for Drug Evaluation and Research. 2021.
[cited 2024Jan]. Available from: https://www.fda.gov/media/141720/download
3. Company Announcement ‘Sandoz, Inc. Issues Nationwide Recall of 13 Lots of Orphenadrine Citrate 100mg Extended Release Tablets Due to Presence of a Nitrosamine Impurity’. [Internet] FDA. 2022. [cited 2024Jan]. Available from: https://www.fda.gov/safety/recalls-market-withdrawals-safety-alerts/sandoz-inc-issues-nationwide-recall-13-lots-orphenadrine-citrate-100-mg-extended-release-tablets-due
4. Company Announcement ‘Pfizer Voluntary Nationwide Recall of Lots of ACCURETICTM (Quinapril HCl/Hydrochlorothiazide), Quinapril and Hydrochlorothiazide Tablets, and Quinapril HCl/Hydrochlorothiazide Tablets Due to N-Nitroso-Quinapril Content’. [Internet] FDA. 2022. [cited 2024Jan]. Available from: https://www.fda.gov/safety/recalls-market-withdrawals-safety-alerts/pfizer-voluntary-nationwide-recall-lots-accuretic-quinapril-hclhydrochlorothiazide-quinapril-and
5. Liquid Chromatography-Electrospray Ionization-High Resolution Mass Spectrometry (LC-ESI-HRMS) Method for the Determination of Nitrosamine Impurities in Metformin drug Substance and Drug Product. [Internet] US Food and Drug Administration. 2020. [cited 2024Jan]. Available from: https://www.fda.gov/media/138617/download
6. Guidance on Nitrosamine Impurities. [Internet] Indian Pharmaceutical Alliance. 2022. [cited 2024Jan]. Available from: https://www.ipa-india.org/wp-content/uploads/2023/07/guideline-05072023c.pdf


