PAT for freeze drying: cycle optimisation in the laboratory
Posted: 25 January 2007 | | No comments yet
Freeze drying is generally known to be a time consuming and therefore expensive process. In order to lower costs during manufacturing, the effective cycle time must be reduced. This goal can be achieved by optimising a freeze drying cycle in the laboratory – in particular the primary drying phase. Applying PAT in the laboratory can provide valuable information about product and process behaviour and may help to identify the critical process parameters during cycle development and optimisation.
The PAT Initiative: manufacturing vs. laboratory
The pharmaceutical industry and the FDA have come to realise that testing quality in the final product is inhibiting the rate of introducing important new drugs. During the past few years the FDA has formulated an important new initiative intended to modernise pharmaceutical manufacturing and encourage pharmaceutical manufacturers to use PAT. The FDA has indicated that drug manufacturers who adopt advanced process monitoring and control techniques may receive favourable treatment from them1,2. The goal of the initiative is to enable manufacturers to produce drug products more efficiently and with higher quality. To be capable of producing more efficiently in manufacturing while still assuring product quality means that critical process parameters (CPPs) must be specified and controlled within predefined limits (design space). These specifications, however, must be set by performing experiments in the laboratory and using PAT tools that are capable of describing all of the important process parameters with acceptable accuracy. PAT is a tool-box which includes the use of ‘smart’ sensors that may enhance process monitoring and process understanding during development as well as process monitoring and control during commercial manufacture. It is important to underline that PAT in the laboratory is more focussed on process understanding, i.e. PAT tools should enable a more detailed scientific approach to product and process development in the laboratory (Quality by Design, QbD). It is mandatory to identify and correlate the critical process parameters relative to quality attributes for a particular product in the early phase of formulation and process development and then to control these parameters during manufacturing.
What are the Critical Process Parameters in freeze drying?
Properties of the formulation and the design of the freeze drying process are closely interrelated. The ‘critical temperature’ of the product governs the maximum allowable temperature at the sublimation interface (Tp) during primary drying. The overall goal of a freeze drying cycle optimisation is to keep the product temperature (Tp) close to the critical temperature during primary drying to cut cycle time. It should be noted that the sublimation rate (dm/dt) increases dramatically when the product temperature at the sublimation interface increases (approximately a factor of two for a 5°C increase in product temperature)3. However, Tp must not exceed the critical temperature of the product to avoid negative effects on product quality.
The ‘critical temperature’ is known to be the collapse temperature (Tc) or the glass transition temperature of the maximal freeze concentrate (Tg’) for an amorphous and the eutectic temperature (Teut) for a crystalline formulation4. Note that Tc and Tg’ are not necessarily the same: Tc was in several cases found to be higher (1-5°C) than Tg’ which might be critical for process optimisation4. However, Tc (or Tg’) of an amorphous formulation is much lower compared to a crystalline formulation, but an amorphous phase is often required to stabilise the drug. This, however, results in a much more conservative process design. Collapse temperatures can be determined by freeze-dry microscopy (FDM), a technology where the product drying behaviour can be observed in a custom made freezing stage through a microscope5,6. A common standard to determine Tg’ or Teut is differential scanning calorimetry (DSC)3,4.
Finally, there is increasing interest in evaluating the product resistance (Rp) as a CPP. The product resistance, defined as the ratio of driving force across the barrier to the mass flow through the barrier, is dependent upon product nature and the thickness of the dried product. Rp increases as primary drying proceeds. This may be a limiting factor for the sublimation rate. Reproducibility of the product resistance of a formulation is a critical parameter to judge structure consistency of a product when manufactured in different batches.
Traditional problems with product temperature determination
The standard methodology used over recent decades to measure product temperature in freeze drying has involved placing temperature sensors, usually thermocouples, directly into the product in a few selected vials. However, it was also shown many years ago that the presence of the temperature sensor in the product changes the nucleation behaviour of the system such that product vials with thermocouples freeze sooner and with less super-cooling than the vials without thermocouples, meaning that these vials take less time in primary drying7. This problem is not usually significant in the laboratory, but has a significant effect in manufacturing where the perturbation in nucleation caused by the thermocouple is much more serious than in the laboratory. Moreover, temperature sensors measure the product temperature at the bottom of the vial and not at the sublimation interface where structural loss (i.e. collapse) may happen during the process. Note that there is a temperature gradient between the product at the bottom and the sublimation interface in the order of 2°C or even higher, depending on the nature of the formulation and the fill volume8. The temperature gradient, however, decreases with total primary drying time. In addition, product vials in the front row of the vial array are typically chosen for the ‘thermocouple vials’. Front row vials dry atypically relative to the rest of the vials because they receive extra heat by radiation from the walls and the chamber door of the freeze dryer and therefore run warmer and take much less time to freeze dry9.
The new concept: Manometric Temperature Measurement
Manometric Temperature Measurement (MTM) is a procedure to determine product temperature at the sublimation interface by quickly (i.e. less than a second) isolating the chamber from the condenser over a short period of time. The pressure rise raw data are subsequently analysed by an algorithm which leads to a direct measure of the pressure at the sublimation interface (Pice) and mass transfer resistance (Rp)8,10. Based on Pice and Rp data, additional important information can be gained by using basic heat and mass transfer theory, e.g. the calculation of product interface and bottom temperature, the sublimation rate and heat transfer coefficients, etc. Based upon the MTM technology and the heat and mass transfer principles, the concept of a ‘smart’ freeze dryer was recently developed as a process control and optimising system for the laboratory (SMART™ Freeze Dryer, FTS Systems)11. This technology seems attractive as a PAT tool for routine development work in the laboratory for the following two reasons:
- Even a user with little or no experience in freeze drying is able to perform an optimised freeze drying process with a single experiment
- Second, this software instantaneously provides data on all critical process parameters after each MTM measurement (‘product feed back’), which are usually determined by time consuming procedures
The reader is referred to the literature for details about MTM and SMART Freeze Dryer technology10,12. The following case studies may provide an early idea about how this technology can support the FDA PAT initiative in the future.
PAT in the laboratory, I: product temperature measurements by MTM
An example for process optimisation in the laboratory by MTM and SMART Freeze Dryer technology is shown in Figure 1 (page 63). A freeze drying cycle was performed for a 100 mg/mL sucrose sample solution (20 mL tubing vials, 3 mL total fill volume) and a known collapse temperature of -32°C6. The SMART Freeze Dryer software automatically elevated the shelf temperature in two steps to -20°C based on the product temperature ‘feedback’ from the MTM measurement. The maximum product temperature at the sublimation interface was approximately -35°C during primary drying and no temperature gradient could be found in the product during this run. MTM data for the bottom temperature of the product showed a very good agreement to thermocouple data which were placed centre bottom in centre vials. This comparison is valid and may be used as a rough confirmation of MTM (or thermocouple) reading. MTM product temperature is always representative for the vials in the batch that are running on the coldest temperature (i.e. the centre vials). However, one should be careful to use this comparison to validate the MTM method due to the problems associated with using thermocouples (as mentioned above).
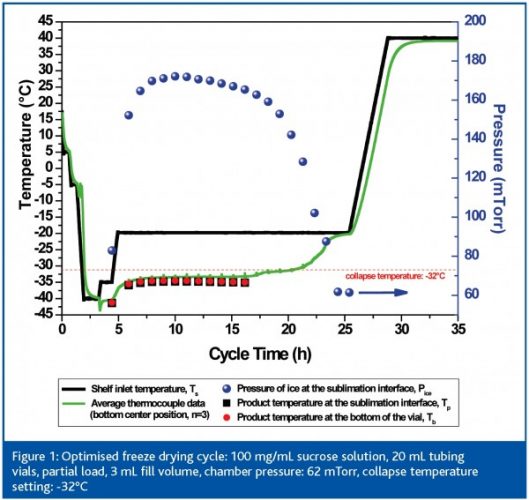

The SMART system always uses a target temperature which is 2 – 5°C lower than the critical temperature of the formulation. This is a safety margin to avoid the potential risk of product collapse due to a bias in the drying behaviour of centre and edge vials. Edge vials dry much faster since they receive more heat by radiation from facing the chamber wall or door. As a result, these vials are exposed for longer to hot temperatures in late primary drying, due to the absence of a cooling effect from ice sublimation. When using the MTM procedure to evaluate the temperature profile of a formulation it is important to keep in mind that this technology is less accurate in temperature prediction when the first couple of vials are dry. Based on our experience this is the case after approximately 50 – 60% of the total primary drying phase for an amorphous product at a moderate total solid content and fill volume. However, the critical adjustments of the shelf temperature are made in the early phase of primary drying to get the product to a target temperature. Here, insufficient product temperature control more likely results in negative product quality effects than at the end of the primary drying phase.
In Figure 1 the decrease of the Pice value after approximately 18 h indicates in this run that the edge vials are almost dry, accompanied by a slight increase in the average centre thermocouple reading. At this point centre vials turn into edge vials and receive more heat and may run at a higher temperature. The total primary drying time for this product is approximately 22 h and almost no cake shrinkage was found (<< 10%). It is questionable whether the use of thermocouples during this run to adjust the shelf temperature might have resulted in a similar optimisation success. The answer is presumably yes. However, this is only a valid assumption since in this particular case the product shows no temperature gradient between ice interface and bottom of the vial. But how do we know that there is no temperature gradient? Clearly the answer is: only from MTM measurements.
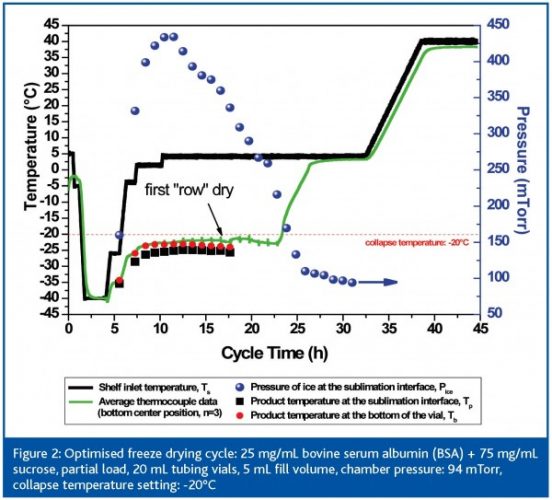
An example of the interrelation between formulation and process design is illustrated in Figure 2 (page 63). Here, the formulation composition was changed to 25 mg/mL bovine serum albumin (BSA) and 75 mg/mL sucrose and the fill volume was increased from 3 mL to 5 mL. Since Tc of a product is highly dependent on nature and concentration of the individual components, the Tc value increases from -32°C for pure sucrose to roughly -20°C for the binary mixture. When performing a SMART run, the system increases the shelf setting over four steps to +5°C with a maximum product temperature at the sublimation interface of -23°C. During this experiment a clear temperature gradient between the sublimation interface and the bottom of the vial was found (> 2.5°C) which would be a significant difference if thermocouples were used in process optimisation. Note that this binary mixture showed no shrinkage after the SMART freeze drying cycle.

PAT in the laboratory, II: product resistance data
The total primary drying time of the 100 mg/mL BSA / sucrose mixture (28 h) is longer compared to a 100 mg/mL pure sucrose solution (22 h), although the shelf temperature setting was clearly higher during the cycle for the binary mixture. The change in formulation composition and the change in the fill volume (increase of the initial ice thickness from 0.57 cm to 0.95 cm) have an important impact on the product resistance profile and therefore total primary drying time. Figure 3 (page 64) illustrates the difference in Rp data between these two compositions as the dry layer thickness increases. At the beginning of primary drying the Rp data are still of the same order of magnitude, but after approximately l = 0.1 cm the Rp of the BSA / sucrose mixture is approx 1 cm2 Torr h g -1 higher than the pure sucrose solution. Note that the resistance curve shows a less distinct plateau phase at l = 0.1 – 0.35 cm for the binary mixture which is an indication for less microcollapse in the structure, therefore smaller holes and higher resistance to vapour flow13.
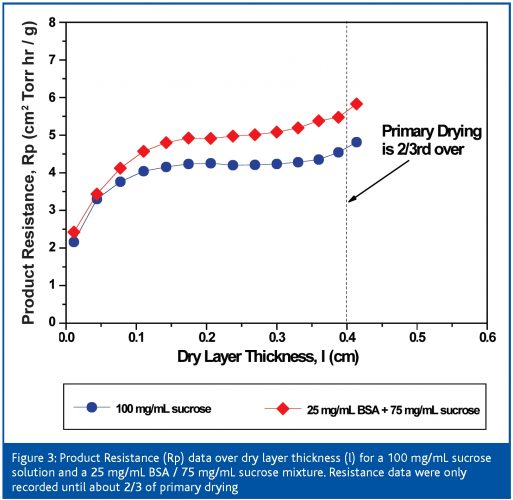

Product resistance is a critical process parameter, which may provide a multifold statement about the process situation. As an example, consistency of Rp between two (or more) different batches may confirm the robustness of a cycle during the freezing and primary drying phase. In turn, impact of excursions in the product temperature on product quality may be delineated by Rp values (e.g. a temperature increase in the product as a result of a loss of pressure control in the chamber during drying). Finally, product resistance measurements in the laboratory may guide the formulation development to further optimise the freeze drying cycle and final product quality.
PAT in the Laboratory, III: Impact of ‘critical temperature’ on cycle design
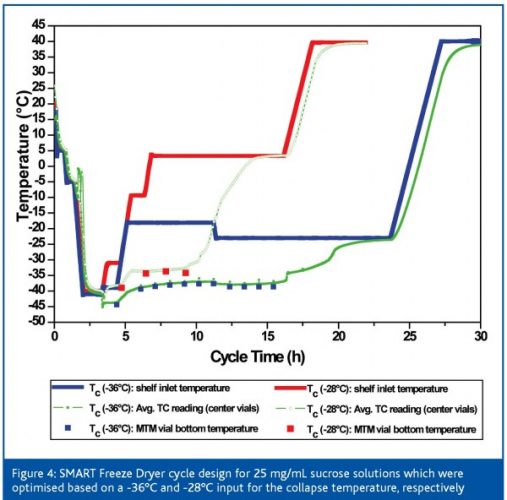
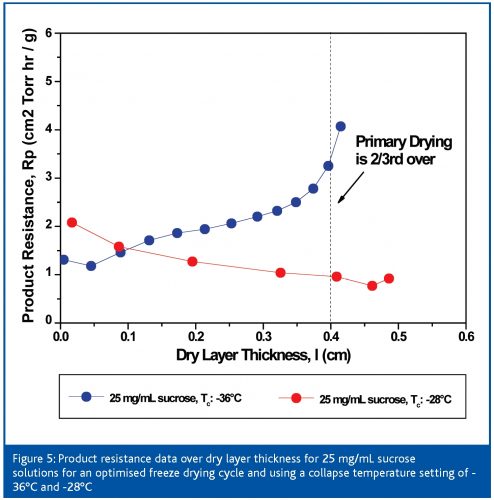
As previously mentioned, the assessment of the critical temperature of a given amorphous formulation may impact the cycle design and therefore optimisation. Since the critical temperature setting is the ‘thread’ for the entire optimisation procedure, a bias between the evaluated critical temperature by FDM or DSC and the real critical temperature would have a significant impact on cycle time and performance. Figure 4 (page 64) shows an example illustrating the overall relevance on cycle design when two different collapse temperature settings are used for a 25 mg/mL sucrose solution: first, a very conservative (Tc: -36°C), then a much more aggressive setting (Tc: -28°C). This temperature gap may even be ‘real’ when using different formulation parameters (Tg’ vs. Tc) and less sophisticated measurement methodologies. Primary drying was almost 30 per cent longer when using the conservative Tc setting, leading to an initial shelf temperature setting of approximately -18°C. Shelf temperature was even automatically lowered to -24°C after approx 10.5 h since the product temperature exceeded the calculated target temperature (-39°C). The aggressive setting, however, produced a two step increase of shelf temperature to a final setpoint of 4°C (Ttarget = -31°C) which clearly illustrates the difference in cycle performance. However, although product temperature by MTM and average thermocouple data are in very good agreement during both runs, the final appearance of the product was very different. Whereas the conservative product showed no shrinkage, the more aggressive setting resulted in a clear microcollapse of the structure (> 40 per cent). These results could also be confirmed by product resistance data obtained during these runs (Figure 5, page 66): when using a Tc of -36°C, the resistance data almost linearly increases. However, resistance data of the aggressive cycle clearly decrease over time which proves a severe loss of microstructure. This particular study illustrates that controlling product temperature at the sublimation interface within a target temperature alone is not sufficient enough to judge the optimisation success or even the robustness of a given cycle. The same assumption applies for product resistance data. Only the combination of the critical process parameters TP and RP allow a reliable Quality by Design approach.


Conclusions
The product temperature at the sublimation interface is perhaps the most critical process parameter during freeze drying, followed by the product resistance. Therefore a PAT technology used during cycle development or optimisation in the laboratory should be capable of a (non-invasive) measurement of these two important parameters. The upper boundary for Tp is always dictated by the critical temperature of the formulation and the optimisation success of the process is always linked to the robustness of the formulation. Therefore PAT must start at the beginning, which means defining the critical formulation parameters. In the future, we need to clarify the acceptance criteria for the final product, i.e. the acceptable degree of shrinkage of the cake structure and the associated negative effects on cake appearance, reconstitution times, stability of the drug, etc.
References
- A. S. Hussain. Emerging Science Issues in Pharmaceutical Manufacturing: Process Analytical Technologies. FDA Science Board Meeting, Nov. 16, 2001.
- FDA/ORA Compliance Policy Guide. Sub Chapter 490.100. Process Validation Requirements for Drug Products and Active Pharmaceutical Ingredients Subject to Pre-Market Approval (CPG 7132c.08), 2006: www.fda.gov/ora/compliance_ref/cpg/default.htm
- M. J. Pikal. Freeze Drying. In: Encyclopedia of Pharmaceutical Technology, Marcel Dekker, New York, 2002.
- H. R. Costantino and M. J. Pikal. Lyophilization of Biopharmaceuticals. AAPS Press series, Biotechnology: Pharmaceutical Aspects, Vol. 2, 2005.
- E. Meister and H. Gieseler. Evaluation of Collapse Temperatures by Freeze-Dry Microscopy: Impact of Excipient Concentration on Measured Transition and the Overall Dependence on Measurement Methodology. Proc. 5th World Meeting on Pharmaceutics and Pharmaceutical Technology, Geneva, March 27-30, 2006.
- E. Meister and H. Gieseler. Collapse Temperature Measurement by Freeze-Dry Microscopy and Transferability to Freeze Drying Processes: Influence of Solute Concentration on Collapse Behavior and Effect on Cycle Design. Proc. AAPS Annual Meeting and Exposition, San Antonio (TX), USA, Oct. 29 – Nov. 2, 2006.
- M. L. Roy and M. J. Pikal. Process Control in Freeze Drying: Determination of the End Point of Sublimation Drying by an Electronic Moisture Sensor. J. Par. Sci. and Tech.: 43, 60-66, 1989.
- N. Milton, M. J. Pikal, M. L. Roy, S. L. Nail. Evaluation of Manometric Temperature Measurement as a Method of Monitoring Product Temperature during Lyophilization. PDA J. Pharm. Sci. Technol.: 51 (1), 7-16, 1997.
- S. Rambhatla, M. J. Pikal. Heat and Mass Transfer Scale-up Issues During Freeze Drying I: Atypical Radiation and the Edge Vial Effect. AAPS Pharm. Sci. Tech.: 4 (2) Article 14, 111-120, 2003.
- X. Tang, S. L. Nail, M. J. Pikal. Freeze-Drying Process Design by Manometric Temperature Measurement: Design of a Smart Freeze-Dryer. Pharm. Res.: 22 (4), 685-700, 2005.
- SMART Freeze-Dryer™ product information:www.ftssystems.com
- X. Tang, S. L. Nail, M. J. Pikal. Evaluation of Manometric Temperature Measurement, a Process Analytical Technology Tool for Freeze-Drying: Part I, Product Temperature Measurement. AAPS Pharm. Sci. Tech.: 7 (1) Article 14, 1-9, 2006.
- M. J. Pikal. Use of Laboratory Data in Freeze Drying Process Desgn: Heat and Mass Transfer Coefficients and the Computer Simulation of Freeze Drying. J. Par. Sci. and Tech.: 39, 115-138, 1985.
Issue
Related topics
Freeze Drying, Lyophilisation, Process Analytical Technologies (PAT)


