Sample preparation – is it possible to have too much?
Posted: 18 October 2017 | Tony Edge (Agilent Technologies) | No comments yet
In the field of bioanalysis, the use of sample preparation is fundamental to ensuring that data is robust. This article looks at some of the various forms of sample preparation that are commonly used for the pre-treatment of biological fluids and considers the advantages and disadvantages of each approach.

The effects of sample preparation will be discussed in terms of the removal of some targeted analytes, which are known to cause detection issues with mass spectrometry, the detector of choice for many bioanalytical laboratories. Effective sample pre-treatment of a biological fluid – as well as removing problem endogenous components – can be used to increase the sensitivity of the assay by pre-concentrating the final extract, as well as improving the performance of the instrumentation, resulting in improved lifetimes of consumable items and improved robustness of the detectors. The nature of the compound under investigation can be exogenous or endogenous, with the nature of the biological fluid also being very varied, ranging from urine and bile, to more complex fluids such as blood and cerebrospinal fluid.1-3 The nature of the biological matrix presents the greatest challenge within bioanalysis. This is often referred to as matrix effects, as it causes issues with selectivity and specificity, which ultimately affects the sensitivity and robustness of the assay. It is used in a variety of contexts including pharmacokinetic studies,4 metabolism studies,5 and also metabonomics.6 Depending on the nature of the analysis, different sample preparation techniques are favoured, thus an approach which is suitable for a single compound determination in a biological fluid may not be suitable to identify a particular metabolic biomarker using a metabonomic approach.
The current approaches to sample pre-treatment include:
- Dilution
- Protein precipitation
- Solid phase extraction
- Liquid-liquid extraction
- Supported liquid extraction
- Turbulent flow chromatography
- Immunoassays
- Molecularly imprinted polymers.
The most common approach for blood and plasma samples is the addition of a chaotropic reagent to the biological fluid, resulting in the precipitation of the proteins. The chaotrope is typically acetonitrile, although other organic solvents and a range of acids can also be used. The choice of chaotropic reagent is dependent on a range of factors, with the primary consideration being financial.
However, different chaotropes can have different effects on proteins since they affect different parts of a protein structure, resulting in slightly different mechanisms for the denaturing of the protein molecule.7 So-called ‘matrix effects’8-10 are well recognised for their potential to distort analytical data if not properly controlled, and are discussed in method validation in relation to the effect that the matrix has on a compound(s) response. These matrix effects arise because of the complexity of biological fluids, which contain many thousands of different compounds with a broad range (>107) of concentrations.11 Each of the endogenous compounds present in biofluids vary from sample to sample,12 with many of these compounds being ionisable under the conditions used for mass spectrometry resulting in them either:
- Competing for the available charge in the ion source of the mass spectrometer13
- Enhancing the ionisation capabilities of other compounds14
- Reducing in solvent evaporation.15
Other processes16 can also cause variable responses from the mass spectrometer. The variability in matrix composition potentially means that the degree of ionisation will vary from one sample to another with possible adverse effects on the analysis of target analytes. It can therefore be critical that the compound is resolved from any endogenous materials to reduce or eliminate the effects of ion suppression within the mass spectrometer source.
Measuring extraction performance
Phospholipids are one of the classes of compounds often monitored as a measure of the performance of the sample extraction procedure being employed.17 These compounds are a class of lipids that form a major component of all cell membranes. They can form lipid bilayers due to their amphiphilic characteristic. The structure of the phospholipid molecule generally consists of two hydrophobic fatty acid ‘tails’ and a hydrophilic ‘head’ consisting of a phosphate group. The phosphate head has a very characteristic fragment ion at m/z 184 and, due to the high concentrations generally present in blood and plasma, this fragment ion is readily seen, even if the source conditions have not been optimised. If a tandem mass spectrometer is being used, then a range of phospholipids can be sought. Table 1 highlights five characteristic phospholipids that have been used to monitor the performance of the extraction technique.
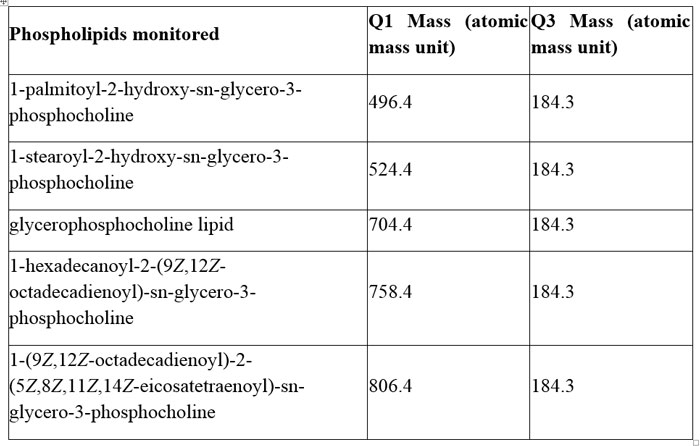
Table 1: Some commonly tracked phospholipids used to determine the performance of matrix removal
The ever-increasing number of samples, particularly in the field of bioanalysis, and the introduction of chromatography coupled to mass spectrometry, has meant that typical chromatographic run times are as little as two to three minutes, with an average injection to injection analysis times routinely less than 10 minutes. In general, compounds of interest are eluted from the column under gradient conditions, with acetonitrile being the strong elutropic solvent and formic acid added to aid ionisation. The chromatography is optimised for the compounds under investigation, and it is common for other components not to be monitored when developing the chromatography. This makes quantification substantially easier, and the use of tandem mass spectrometry aids this process, as it effectively reduces what should be a very complex chromatogram to very few peaks. This presents a substantial challenge because when using other forms of detection, such as UV, it is trivial to determine if all the components injected onto the column have eluted. This presents an extra degree of complexity for bioanalytical scientists, since not only will each sample have different matrix effects, potentially the order in which these compounds are analysed will also have an effect on the determination of the concentration of the target compounds.
As an example of this, 100μL of rat plasma with EDTA anticoagulant was used as the matrix. 300μL acetonitrile was added to the rat plasma and vortex mixed. Since the experiment is focusing on the removal of the matrix, no analytes are spiked into the sample. The precipitated proteins were then removed by centrifugation at 10,000g for 15 minutes. Subsequently, the supernatant was transferred to a 2mL vial and evaporated to dryness under a constant stream of nitrogen at 40°C and finally reconstituted with 100μL of water-methanol-formic acid (95:5:0.1 v/v/v).
The resulting sample was analysed using LC-MS. The mass spectrometer was used to monitor the five phospholipids listed in Table 1. All of these compounds have the same phosphocholine daughter group, which has a characteristic mass of 184.3, with the parent masses being: 496.4; 524.4; 704.4; 758.4 and 806.4 respectively.
A C18 silica-based column was used in all cases (50mm x 2.1mm). Mobile phases were 0.1% formic acid in water [A] and 0.1% formic acid in methanol [B]. A gradient programme was employed for the analysis and was designed to reflect that used in many bioanalytical laboratories. The initial composition of 95% [A] and 5% [B] was held for 0.5 minutes, then a linear gradient was applied, increasing the concentration of [B] to 95% in three minutes. This composition was held for one minute then changed to the original starting conditions of 95% [A] and 5% [B], where it was held for a further 0.5 minutes. A constant flow rate of 0.6mL/min was employed, with an injection volume of 10μL. This arrangement gave an injection to injection time of approximately five minutes.
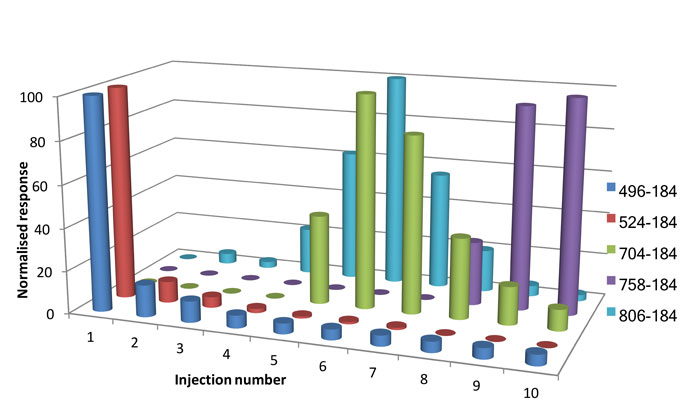
Figure 1: Normalised detector response for phospholipids in 10 water injections subsequent to an injection from a protein precipitated extract. Phospholipid m/z transition labelled. Modified from ref 3.
Subsequent to the extracted plasma sample, a series of aqueous injections were performed. Phospholipids are not present within the aqueous sample and detection would be due to the incomplete elution of the phospholipid during the previous chromatographic run. Figure 1 shows the detector response obtained for a series of injections of water subsequent to the first injection of a protein precipitated plasma extract. Figure 1 shows that, in general, the less lipophilic phospholipids are eluted from the column quicker than the more lipophilic phospholipids. However, with consecutive aqueous injections the more strongly retained, heavier phospholipids are gradually eluted from the analytical system. Figure 1 clearly demonstrates one of the challenges associated with the short analysis times typically employed in bioanalysis, as it is evident that the heavier phospholipids have not eluted from the HPLC column on the first injection and that it takes several injections to remove these compounds from the column. The data here suggests that, under commonly used bioanalytical chromatographic conditions, traces of phospholipids will remain even after 10 injections of a pure aqueous solution.
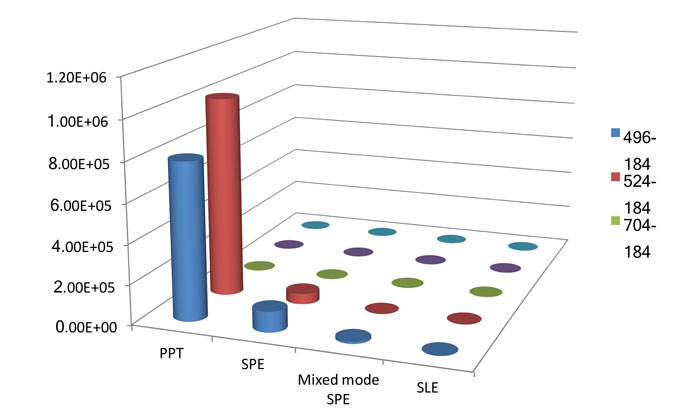
Figure 2: Detector response obtained for the extract using different sample preparation techniques, PPT – protein precipitation, SLE – support assisted liquid-liquid extraction, Hydrophobic SPE, Mixed mode SPE CX. Modified from ref 3.
Comparing modes of sample preparation
The mode of sample preparation can also have a significant effect on the removal of endogenous components. Figure 2 shows data obtained from four different extraction procedures: a polymeric hydrophobic SPE; mixed mode cation SPE; support assisted liquid extraction; and protein precipitation. The experimental detail for each of these approaches is given below.
A polymeric SPE media in a 30mg/1mL cartridge was conditioned with 1mL of methanol followed by 1mL of water. 100μL of plasma was diluted to 1mL in water and loaded onto the cartridge. A generic wash using 1mL of 5% methanol in water was employed, although if the wash protocol was optimised for a particular set of compounds this value could vary for a real assay. The elution was performed with two aliquots of 500μL of methanol.
A 30mg/1mL mixed-mode cation exchange cartridge was conditioned with 1mL 0.1% formic acid in methanol followed by 1mL 0.1% formic acid in water. 100μL of plasma was diluted to 1mL in water with 0.1% formic acid and loaded onto the cartridge. The cartridge was then washed with 1mL 0.1% formic acid in water and then 1mL 0.1% formic acid in methanol. The elution was performed by applying two aliquots of 500μL of methanol with 5% ammonia solution added.
All SPE eluants from the elution step were collected and evaporated to dryness under nitrogen at 40°C then reconstituted with 100μL of water-methanol-formic acid (95:5:0.1 v/v/v). In all the SPE procedures, positive pressure was applied to the cartridges using a 50mL plastic syringe with a cartridge adaptor attached. This allowed accurate control of the flow rate of the solvents through the cartridge.
Support assisted liquid/liquid extraction was performed on a bed of 200mg of diatomaceous earth in a 1mL cartridge. 100μL of plasma was vortex mixed for ten seconds with 100μL water and then loaded onto the SLE cartridge. The sample was left on the cartridge for 10 minutes before application of the elution solvent, which was 1mL of ethyl acetate. The eluant was then evaporated to dryness under nitrogen at 40°C and reconstituted with 100μL of water-methanol-formic acid (95:5:0.1 v/v/v). Clearly for dissolving heavier phospholipids, this may not be an ideal solvent choice, however, this would not replicate typical reconstitution solvent systems used for gradient reversed phase chromatography, where the solvent has to be weak to avoid peak distortion of the major analyte.
In the protein precipitation technique, 100μL of plasma was vortex mixed with 300μL acetonitrile. The precipitated proteins were then removed by centrifugation at 10,000g for 10 minutes. Subsequently, the supernatant was transferred to a 2mL vial and evaporated to dryness under a constant stream of nitrogen at 40°C and finally reconstituted with 100μL of water-methanol-formic acid (95:5:0.1 v/v/v).
Figure 2 shows the responses obtained from the mass spectrometer for the different phospholipid transitions when an injected extracted plasma matrix using the various extraction techniques was introduced to the chromatographic system. There are significant differences, over a factor of 10, in the detector response obtained for the different extraction techniques with SLE and the mixed mode cation exchange material providing the least amount of detectable phospholipids. The extraction technique which provides the largest response is protein precipitation. It is interesting to note that the heavier phospholipids are not detectable on the first injection of an extract on a clean chromatographic system.
Thus, from the evidence provided it may appear that the best sample preparation techniques will remove the bulk of the phospholipids to ensure that the data integrity is maintained. This may not always be the case, however. In the field of metabolomics and metabolism, it is the identification of unknown compounds that drives the analysis, and so removal of matrix components can have a detrimental effect on the determination of the specific metabolites.
In another series of experiments, a comparison was made between SPE, TFC and protein precipitation. As previously, the amount of phospholipids was monitored, however, the intention for this set of experiments was to determine potential biomarkers/metabolites from two sets of distinctive samples. In this series of experiments, the column was fully equilibrated by multiple injections of extracted samples. Full experimental details can be found.18
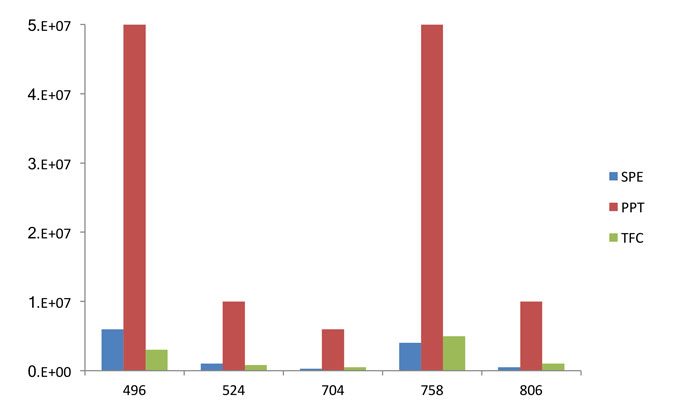
Figure 3: Comparison of phospholipid recovery using three popular extraction approaches. Modified from ref 18.
Figure 3 shows the difference in intensities between the three extraction technologies for the five phospholipid transitions highlighted previously. It can be seen that the TFC and the SPE approach are broadly comparable in removing phospholipids, with the MS response reduced by a factor of approximately 10 for each technique when compared to protein precipitation. The reduction in signal intensity, however, is seen for other components, as shown with some representative data in Figure 4. This clearly shows that there is a reduction in signal intensity for a series of unknown compounds. In the field of metabonomics, however, this is detrimental to determining the unknown species and so, in this case, the use of more selective extraction methodologies is not beneficial.
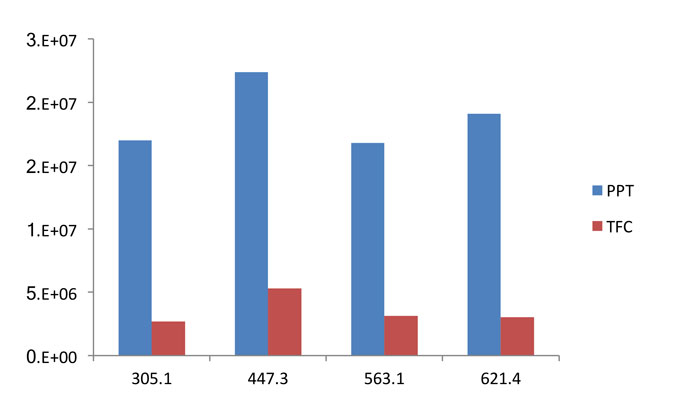
Figure 4: Variation of intensities for certain MS ions used to identify biomarkers, for two extraction techniques. The greater the ion intensity the easier it is to identify the biomarker. Modified from ref 18.
Conclusion
The use of sample preparation and extraction technologies when analysing biological samples is a critical component to ensure that the data produced has the highest integrity. The wide range of sample preparation techniques available ensures that wherever it is necessary to remove matrix components this can be achieved effectively, with a range of approaches that address financial, analysis time, and sensitivity considerations. It should also be noted that, as with all questions posed to analytical scientists, the nature of the question must be considered and that simply using a one approach fits all scenario will invariably not be the best approach. For determination of target compounds the removal of matrix components can be beneficial as it will remove more endogenous components. However, for the analysis of metabolism and metabonomic samples, it is necessary to maintain the sample integrity as much as possible to ensure that a correct understanding of the sample can be obtained.
Author biography
Tony Edge is an R&D Manager at Agilent Technologies, heading a team of specialist scientists in developing next-generation stationary phases for HPLC. In 2008, he was awarded the Desty memorial lecture for his contributions to innovating separation science, and in the same year also won a clinical excellence award from AstraZeneca. Dr Edge was awarded an honorary fellowship at Liverpool University, where he lectures on separation science, and also lectures at Keele University on Management in Analytical Science. He is the President of The Chromatographic Society in the UK and a permanent member of the scientific committee for the International Symposium on Chromatography.
References
- Earla R, Sai HS, Boddu HS, Cholkar K, Hariharan S, Jwala J, Mitra AK. J Pharm Biomed Anal. 2010; 52(4):525-533.
- Holder BR, McNaney CA, Luchetti D, Schaeffer E, Drexler DM, Biomed Chromatogr. 2015;29(9):1375-9.
- Michopoulos F, Edge AM, Hui Y-T, Liddicoat T, Theodoridis G, Wilson ID. Bioanalysis. 2011;3(24):2747-2755.
- dos Santos Magalhães IR, Bioanalysis. 2014;6(12):1711-23.
- A Handbook of Bioanalysis and Drug Metabolism. 2004. Ed G Evans. CRC Press.
- Nicholson JK, Lindon JC, Holmes E. Xenobiotica. 1999;29(11):1181-9.
- Sinha R. The Protein Journal. 2014; Vol 33,Issue 4:394-402.
- Mei H, Hseih Y, Nardo C, et al. Rapid Commun Mass Spectrom. 2003;17:97-103.
- Sangster T, Spence M, Sinclair P, Payne R, Smith C. Rapid Comms. Mass Spectrom. 2004;18(12):1361-1364.
- Matuszewski BK, Constanzer ML, Chavez-Eng CM. Anal Chem. 2003;75,3019-3030.
- Liumbruno G, Alessandro A, Grazzini G, Zolla L. J Proteomics. 2010;73:(3)883-507.
- Wilkinson GR, Advanced Drug Delivery Reviews. 1997;27(2-3):129-159.
- Larger PJ, Breda M, Fraier D, Hughes H, James CA. J Pharm And Biomed Anal. 2005; 39(1-2):206-216.
- Ismaiel OA, Halquist MS, Elmamly MY, Shalaby A, Karnes HT. J Chrom B. 2008;875(2):333-343.
- Cole RB, Harrata AK. J Amer Soc Mass Spectrom. 1993;4(7):546-556.
- Jessome LL, Volmer DA. LCGC North America. 2006;24(5):498-510.
- Ahmad S, Kalra H, Gupta A, Raut B, Hussain A, Rahman A. J Pharm & Bioallied Sciences. 2012;Vol.4, Issue 4:267-275.
- Michopoulos F, Edge AM, Theodoridis G, Wilson ID. J Sep Sci. 2010;33:1-8.