Applying simple PAT tools to crystallisation in process chemistry
Posted: 23 October 2017 | Des O’Grady | No comments yet
Crystallisation is a common step in the synthesis of organic compounds used to isolate and purify the desired product. As the importance of crystallisation has increased and chemists improve the processes involved, process analytical technology (PAT) tools can be used to design, analyse, and control them. This article considers the benefits and challenges of adopting these PAT tools.
The importance of crystallisation in the pharmaceutical and high-value chemical industries has increased recently due to:1
- A requirement to reduce impurities to extremely low levels that may not have historically been detectable
- A desire to tightly control physical crystal attributes for:
- Better formulation and improved reproducibility and bioavailability
- Improved downstream processing – filtration, drying, milling
- The need to crystallise more complicated molecules of increasing molecular weight
- Increasing requirements to duplicate crystal attributes across multiple scales during development and manufacture to meet regulatory requirements.
These demands mean process chemists now spend more time developing better crystallisation processes for :(a) intermediate synthesis steps, where impurity rejection and efficient downstream processing are critical; (b) the final synthesis step, where the crystallisation process will produce the final active ingredient under strict regulatory guidelines and with the desired bioavailability.
The PAT framework2 provides guidance on the use of novel measurement technologies, often inline or at-line, to design, analyse, and control pharmaceutical processes. Critical process parameters (CPPs) and critical quality attributes (CQAs) for crystallisation processes, such as supersaturation, crystal size and impurity profile, can be measured inline or at-line during the development and manufacture of an active ingredient. But the successful implementation of PAT technologies often requires a level of expertise that necessitates specialist groups which can only focus on a small number of high-priority projects at once.
Simpler technologies, such as real-time microscopy, can be readily adopted by scientists without any specific PAT expertise, however. This provides scientists with high-quality images and videos of crystals and crystal structures inline as process conditions are changing.3
Critical quality attributes
Crystal size, shape and structure are critical quality attributes that require control during scale-up and manufacturing. For intermediate synthesis, the role of size, shape, and structure in developing successful processes may not be clear at first, since the crystal product will simply be dissolved before the initiation of the next reaction steps. However, crystal products generated as part of intermediate steps must be isolated, and these isolation properties are directly related to the size, shape, and structure of the product. In Figure 1, four real-time microscopy images are shown for different crystal products.
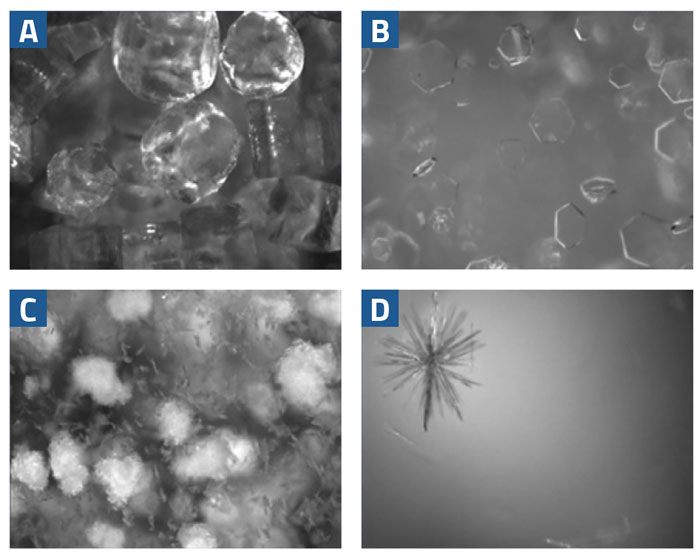
Figure 1: Four real-time microscopy images of different crystal products with differing crystal size, shape, and structure
The crystals in Figure 1a will likely filter quickly and consistently. The large ‘boulders’ will leave plenty of space for the filtrate to pass between them as they pack on the filter. Flat platelet crystals (Figure 1b) can be some of the most difficult to filter. Platelets tend to stack on top of each other, creating a layer of crystals that the filtrate cannot pass through. This leads to long and potentially variable filtration times, depending on how the crystals are discharged from the crystalliser.
The small crystals shown in Figure 1c will plug gaps left by the larger crystals, making it difficult for the filtrate to pass through the crystal bed. A significant population of fine (small) crystals often extends filtration times and can be particularly difficult to isolate and move to the next process step.
The dendritic crystal shown in Figure 1d is quite common in organic processes that rely on seed crystals to initiate the processes. Imperfections on the crystal surface lead to crystal growth from these areas and long crystal branches growing from a seed core. It is difficult to predict how something like this will filter, but it is likely to break apart, resulting in variable filtration times.
Figure 2 illustrates some of the options available to scientists who wish to develop a crystallisation process. Critical process parameters need to be designed and controlled to ensure crystallisation mechanisms, such as nucleation growth or agglomeration, occur predictably, allow quality attributes such as crystal size and impurity profile to be carefully optimised. PAT tools can help understand crystallisation processes, but many require expertise to implement.
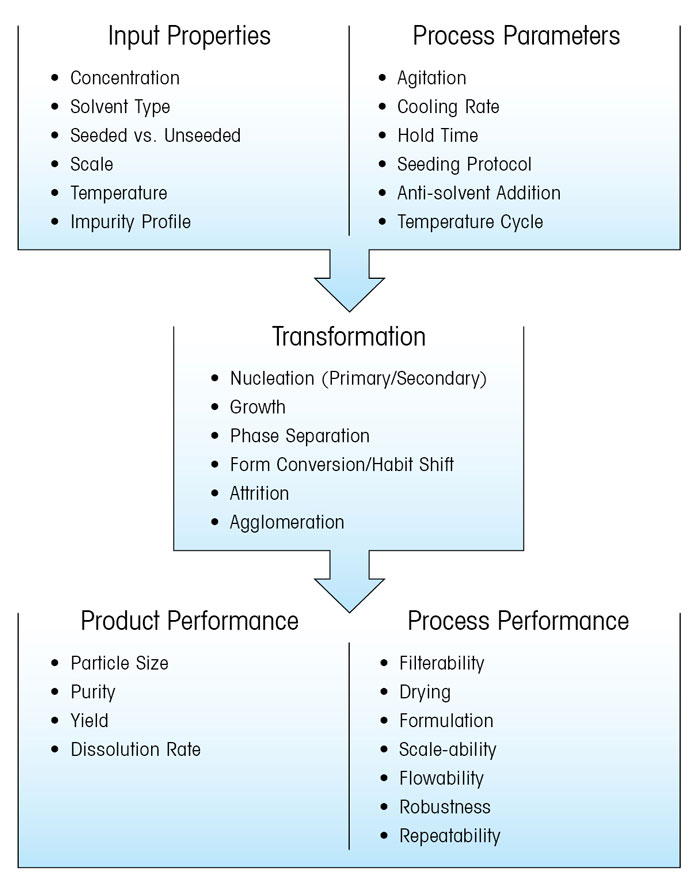
Figure 2: LEFT: Flow diagram illustrating how input properties and process parameters influence crystallisation mechanisms, and the subsequent impact on process and product performance
Real-time microscopy
Real-time microscopy allows an understanding of the key mechanisms that take place during crystallisation, and how critical process parameters influence these mechanisms. Videos and images of crystals viewed directly inline as they change provide unambiguous process understanding without any data analysis or complex interpretation.
Many recent examples demonstrate how this technique is applied to understand and optimise crystallisation processes, in particular, to optimise cooling rates,4 control polymorphism,5 and identify and address phase oiling and phase separation.6 Image analysis routines such as relative backscatter index (RBI)3 have been developed to further automate and enhance the development of process understanding from images. RBI is a measure of the overall reflectivity of the crystal system at a given point in time and is similar to a turbidity measurement in that it can be used to follow crystallisation progression using a simple univariate trend.
The combination of real-time microscopy, RBI, and recorded process parameters become powerful PAT techniques that any scientist can use to understand a crystallisation process. Figure 3 shows how RBI can be used to measure the dissolution and nucleation temperature for an organic compound. Using this information, scientists can easily determine the solubility curve for their system and optimise the nucleation temperature, which correlates directly with process consistency and purity.7 Supersaturation is the driving force for crystallisation processes and directly influences crystal nucleation and growth rates. This relationship is explained in detail by Nývlt et al,8 but for the purposes of this paper, it should be clear that the choice of cooling rate has a dramatic effect on the prevailing level of supersaturation and final crystal size distribution.
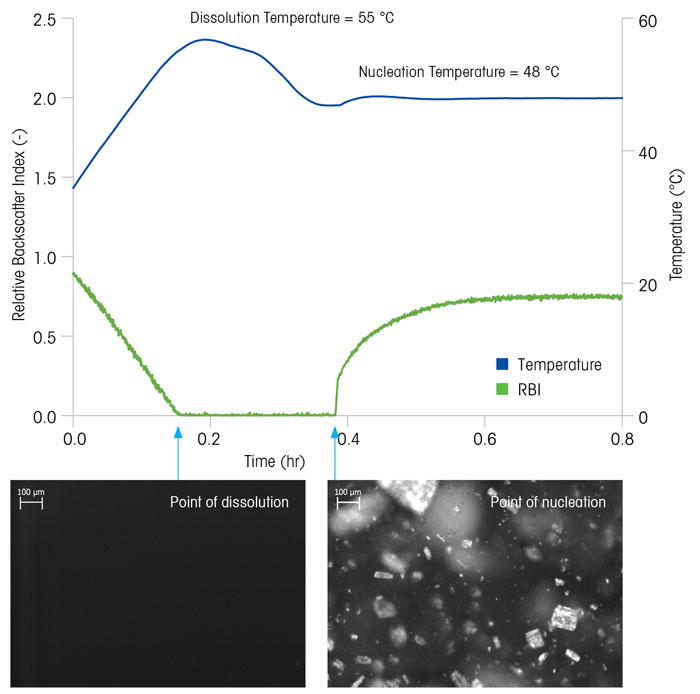
Figure 3: Combining real-time microscopy with RBI and temperature to measure the dissolution and nucleation temperature for an organic compound
Figure 4 compares two crystallisation processes with different cooling rates. The RBI trends in each case indicate the difference between the process growth kinetics, endpoint, and batch time. The slower cooling rate, Process A, results in noticeably larger crystals, whereas the faster cooling rate results in smaller, thinner crystals. This classic example illustrates where a trade-off must be made in the effective design of a crystallisation process. In this case, a balance must be drawn between faster crystallisation, which may save time in the plant, versus a smaller, thinner crystal, which may pose challenges during filtration and drying.
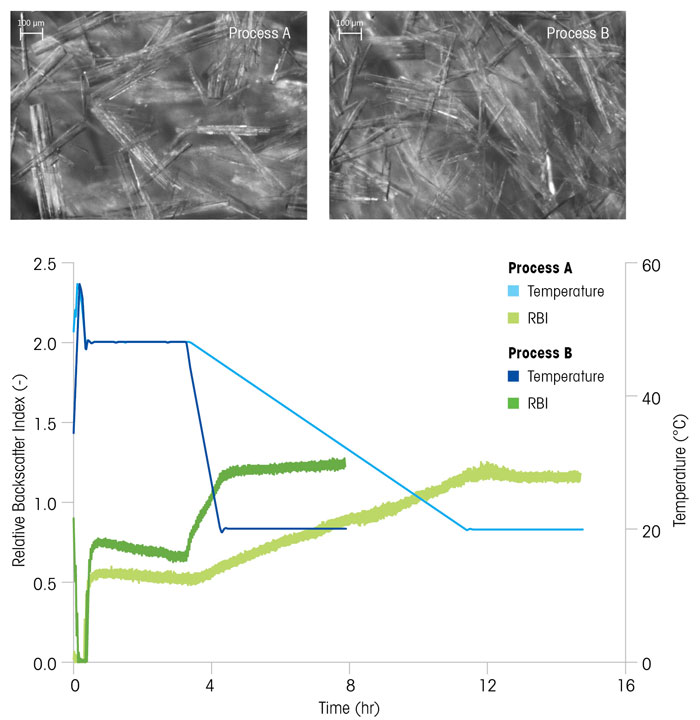
Figure 4: Two crystallisation processes (A) and (B), with a slow and fast cooling rate respectively, result in crystals of different size and shape
Identifying polymorphs during crystallisation
Strict understanding and control of an active ingredient’s polymorphic behaviour are vital at all stages of development. For intermediate synthesis steps, the isolation properties of a crystalline product can depend heavily on the polymorphic form, and consistently producing the correct polymorph demonstrates good understanding and control of the process.
In some cases, new polymorphic forms can appear during development, and fast identification is critical. In other cases, where the presence of more than one polymorph is known, and an in-process transition is required, a PAT methodology can ensure that the transition from the less stable to more stable polymorph occurs consistently across all scales and operating conditions.
Figure 5 highlights a polymorphic transformation. Both the RBI and real-time microscopy images provide detailed and unambiguous process understanding. When the initiator is added nucleation occurs immediately, as indicated by the rapid increase in the RBI signal, corresponding to crystal formation. While the temperature remains constant at 50ºC, the RBI reaches a steady state, but soon increases again rapidly – indicating a second nucleation event has occurred.

Figure 5: Monitoring the nucleation of two polymorphs, and the subsequent transition to the more stable form
The real-time microscopy images confirm that a second crystal morphology has nucleated, which can be verified as a different polymorphic form using offline x-ray diffraction analysis. Over time, the transition from less stable to the more stable form occurs, until the RBI trend again reaches a steady state, and the real-time microscopy images show that only needle-shaped crystals persist.
Recognising and addressing oiling out
Oiling out (phase separation) can occur in crystallisation processes where impurity levels are high and/or supersaturation is generated very quickly (typically through anti-solvent crystallisation or a salting out with an acid-base reaction). Oiling out occurs when the system is driven to a point in the phase diagram where a liquid-liquid phase split becomes possible, and a product-rich oil phase is formed in the solvent matrix. Crystallisation will subsequently occur, but the product is more likely to contain residual impurities and has a variable crystal size distribution. Processes that oil out and then crystallise can also be difficult to isolate and leave a residue on equipment that is very difficult to clean, particularly at larger scales.
Recognising when oiling out occurs is important so that changes can be made early in development. Visual observation, by looking through the glass walls of a crystalliser, is often impossible because the solution simply looks turbid, as it might appear if it were to crystallise normally.
Figure 6 shows a crystallisation process where rapid cooling results in oiling out. The RBI identifies an initial ‘nucleation’ event – but the real-time microscopy images reveal that oil droplets have appeared, rather than crystals (Figure 6a). Over time, the oil phase disappears and crystals nucleate and grow, while real-time microscopy images reveal that crystals are also growing out of the oil droplets (Figure 6b). Subsequently, the oil phase disappears completely and only crystals remain, which then go on to grow until the end of the process (Figure 6c). This phenomenon has been shown in the literature, and methods to prevent oiling out range from adjusting starting concentration,9 to adjusting the seed size and loading.10
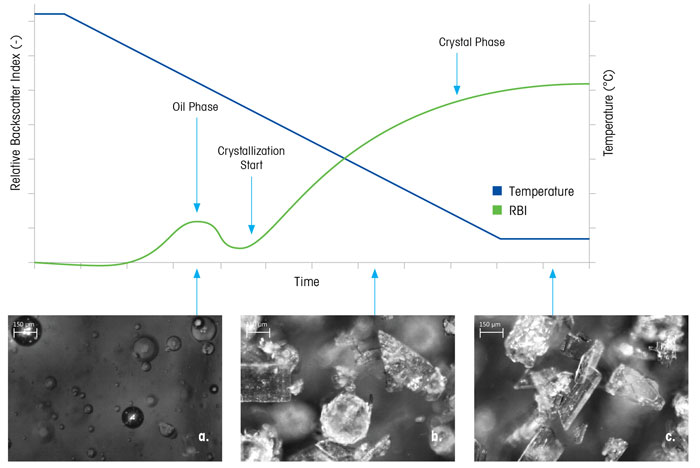
Figure 6: Real-time microscopy images and RBI monitor a crystallisation process that goes through a phase separation (oiling out)
Conclusions
Crystallisation is a unique unit operation that offers scientists a method to isolate and purify products in a single step. The pressure to deliver optimised crystal products with the desired attributes is increasing, and scientists must improve their process understanding to support their optimisation efforts. Many PAT tools suitable for supporting the development of crystallisation processes are extremely valuable, but they can be so complicated that they are not adopted outside dedicated and specialist groups. Real-time microscopy combined with simple image analysis, in this case RBI, is an opportunity for every scientist to begin using PAT to design, analyse, and control crystallisation processes as part of the PAT framework.
References
- Powder Technology. 150:133-143.
- Guidance for Industry PAT – A Framework for Innovative Pharmaceutical Development, Manufacturing, and Quality Assurance – fda.gov/downloads/Drugs/Guidances/ucm070305.pdf
- mt.com/ParticleView
- Chem Eng Res Des. 2010;88(8):1108-1119.
- Organic Process Research & Development. 2015;19(12):1820-1825.
- Industrial & Engineering Chemistry Research. 2016;55(44):11631-11637.
- Organic Process Research & Development. 12(2):243-248.
- Journal of Crystal Growth. 1968;(3-4):377-383.
- Crystal Growth & Design. 2004;4(6):1175-1180.
- Organic Process Research & Development. 2005;9(6):943-950.
Biography
Des O’grady: is the Head of Particle Systems Characterisation at Mettler Toledo. He focuses on ensuring high-value chemical companies can extract a strategic advantage from the deployment of in-process particle characterisation technology. Dr O’Grady is a regular contributor at international conferences and is a regularly published author on these and other topics.